www.njps.com.ng
Coffee Consumption Attenuates Insulin Resistance and Glucose
Intolerance in Rats fed on High-Sucrose Diet
Morakinyo AO*, Adekunbi DA, Dada KA and Adegoke OA
Department of Physiology, College of Medicine of the University of Lagos, Lagos. Nigeria
Summary: Several epidemiological evidences indicate that consumption of coffee is associated with a lower risk of type 2 diabetes mellitus (T2DM) however; there is dearth of experimental data to support these observations. Given that associations do not necessarily infer causality, the present study was designed to investigate the effect of coffee consumption on glucose regulation, T2DM and the probable mechanisms of action, using an animal model. The effect of coffee (2-fold dilution) by oral gavage on normal and high sucrose-solution (HSS) fed (30 % w/v) rats was evaluated. The results showed that consumption of coffee significantly increase glucose tolerance and insulin sensitivity (p<0.05) along with significant improvement in SOD and GSH activities. In addition, lipid indices such as TG and LDL as well as the lipid peroxidation marker (MDA) were markedly reduced (p<0.05) in rats fed with coffee compared with that of the HSS fed rats. These findings suggest that coffee consumption improves insulin sensitivity, glucose tolerance in HSS-fed rat possibly via inhibition of oxidative stress.
Keywords: Coffee, Glucose Tolerance, Insulin resistance, Oxidative Stress, Sucrose ©Physiological Society of Nigeria
*Address for correspondence:+2348055947623; morakinyofemi@yahoo.com; aomorakinyo@cmul.edu.ng Manuscript Accepted: October, 2013
INTRODUCTION
Coffee is probably the most frequently ingested beverage worldwide as it is consumed by billions of people in most countries of the world. The numerous beneficial health effects of coffee consumption have received considerable scientific attention (Nawrot et al. 2003; Ranheim and Halvorsen, 2005). Studies have shown that moderate consumption of coffee is correlated with a lower incidence of gallstones (Lindsay 2002; Maia and de Mendonca, 2002), Alzheimer’s disease (CBS 2012), dementia (Health news 2012) and Parkinson’s disease (Leitzmann et al. 1999). Coffee consumption improves short term memory (Leitzmann et al. 2002) while the tannins in coffee may reduce the cariogenic potential of foods by reducing plaque formation (Armstrong et al.
2005). Similarly, evidence obtained through
epidemiological studies indicates that consumption of coffee is consistently associated with a lower risk of Type 2 diabetic mellitus (T2DM) (van Dam et al. 2004; Agardh et al. 2004; Bidel et al. 2006).
In a number of prospective study, it was observed
that an inverse relationship exist between
consumption of coffee and insulin insensitivity as well as glucose intolerance (Natella et al. 2007). Similarly, a meta-analysis (9 prospective and 6
case-control epidemiological studies involving about
200,000 participants) indicated an inverse
relationship between regular consumption of coffee and the risk of T2DM (van Dam and Hu 2005).
Since associations do not necessarily infer causality, experimental study using a representative diabetic animal model is importantly meaningful. Although a small number of these studies have been performed (Van Dam et al. 2006; Yamacuchi et al.
2010; Matsuda et al. 2011), presently, there is no
report of the anti-diabetic effects of coffee in diet-induced diabetic model and its anti-oxidative potential under diabetic conditions. It is widely known that oxidative stress is a fundamental factor in the pathogenesis of types 2 diabetes mellitus (Maritim et al. 2003), interestingly, coffee is a rich source of antioxidant polyphenols. Thus, the antioxidant properties of coffee may contribute to its anti-diabetic effects. In the present study, we employed sucrose-induced diabetic rats to investigate the effects of coffee on insulin resistance and glucose tolerance as well as the mechanism involved taking advantage of the antioxidant potential of coffee. The T2DM model used in the present study is a more desirable representative of the widespread diet-induced T2DM which is usually caused by excess consumption of sweet foods, particularly
sugar-Coffee and Insulin resistance 180
sweetened beverages. Our study also reported the effect of coffee on lipid profile.
MATERIALS AND METHODS
Drugs and chemical reagents: Regular (caffeinated)
canned coffee (Nestle Gold, UK) purchased was used to prepare the coffee solution using distilled water. All the other chemicals and test kits used were of analytical grade.
Animals: Male Sprague-Dawley rats weighing
120-150g were obtained from the Laboratory Animal House of the College of Medicine of the University of Lagos. Animals were housed in plastic cages with
ad libitum access to commercial rodent pellet diet (Vital Feeds, Jos, Nigeria). The light cycle was maintained at 12 h of dark, followed by 12 h of light. The room temperature was maintained at 24±2 °C and humidity of 50% - 64%. The rats were allowed to acclimatize for a period of one week before the commencement of the experiment. All animal handling and experimental protocols adopted in this study complied with the international principles for laboratory animals as obtained in the Helsinki’s Declaration (NIH, 1985).
Study Design: Twenty-four (24) rats were randomly
divided into four equal groups of six animals and given water (control); diluted coffee (coffee); high sucrose solution, (HSS/sucrose); and both HSS and diluted coffee (suc+cof). A 2-fold dilution coffee solution was administered to the rats; this was prepared every second day while the undiluted coffee
was stored at -200C until being diluted. Free access to
high sucrose solution (HSS) (30 % w/v) as drinking water was provided to the “sucrose” and “suc+cof”
rats according to the modified method of Riberio et
al. (2005). The diluted coffee solution was
administered to the rats once daily by oral gavage and treatment lasted for 12 consecutive weeks during which experimental measurements were done.
Blood glucose and glucose tolerance test: The
experimental rats were fasted overnight before blood samples were collected via tail tipping for blood
glucose measurement at 8th and 12th week of
treatment. Oral glucose tolerance test (OGTT) was also performed to evaluate the change in glucose concentration with an oral glucose load. For this, experimental rats were fasted overnight for sixteen hours (16-hr) and subsequently challenged with a glucose load of 2 g/kg body weight. Blood glucose levels were determined at 0 hr (pre-glucose treatment) and at 30, 60, 90, 120 and 180 min (post-glucose treatment). The area under the (post-glucose curve (AUCOGTT) was calculated using the trapezoidal rule. The glucose levels were measured using a complete blood glucose monitoring system (Accu-Chek Glucometer, Roche, Germany).
Insulin tolerance test (ITT): ITT was performed at
the 8th and 12th week of the experiment. After
sixteen-hour (16-hr) fast, blood was collected from the tail of the animals and used for the determination of the baseline glucose level. Subsequently, a human insulin solution (0.5 U/Kg BW; Human Insulatard, Novo Nordisk) was injected intra-peritoneally. Blood glucose levels were thereafter determined at 30, 60, 90, 120 and 180 min (post-insulin injection). The area under the glucose curve (AUCITT) was also calculated.
Serum insulin and biochemical profile: At the end
of 12-week treatment period, the rats were fasted overnight and sacrificed by cervical dislocation technique, and then blood samples were drawn from the rat’s heart. The blood samples were centrifuged at 3500rpm for 20 min to separate blood serum. The serum insulin was estimated using the enzyme-linked immunoassay kit (MP Biomedicals-Orangeburg, USA). The biochemical data which include total cholesterol (TC), triglycerides (TG), high-density lipoprotein (HDL) and low-density lipoprotein (LDL) were measured by an automatic blood chemical analyzer (BT 2000 plus, Germany).
MDA level: As a marker of lipid peroxidation, the
level of malondialdehyde (MDA) in the plasma was measured by the method of Uchiyama and Mihara
(1978) as thiobarbituric acid reactive substances
(TBARS). The development of a pink complex with absorption maximum at 535nm is taken as an index of lipid peroxidation.
Antioxidant activities: Oxidative analyses of the
plasma were carried out using previously described standard methods. The reduced glutathione (GSH) was determined using the method described by Van
Dooran et al. (1978). The GSH determination method
is based on the reaction of Ellman’s reagent 5, 5’ dithiobis (2-nitrobenzoic acid) DNTB) with the thiol group of GSH at pH 8.0 to produce 5-thiol-2-nitrobenzoate which is yellow at 412nm. Activity of the SOD enzyme was also determined according to the method described by Sun and Zigman (1978). The reaction was carried out in 0.05m sodium carbonate buffer pH 10.3 and was initiated by the addition of epinephrine in 0.005N HCl. Absorbance was
recorded using Shimadzu recording
spectro-photometer (UV 160) in all measurements.
Statistical Analysis: Data are expressed as mean ±
standard error of mean (SEM) and analysed using the
ANOVA followed by SNK post-hoc test. P < 0.05
was accepted as significant. All the analyses were carried out using the GraphPad Instat Version 3.05 for Window Vista, GraphPad Software, San Diego California, USA.
Coffee and Insulin resistance 181
RESULTS
Effects of coffee on body weight and food intake
The body weight and food intake of all rats measured
and recorded at 4th, 8th and 12th weeks were shown in
Table 1. There was no significant difference in the final body weight among the control, coffee, sucrose and sucrose+cof groups. Similarly, the food intake did not differ among all the experimental groups.
Effects of coffee on glucose tolerance
To investigate the effect of coffee solution on glucose tolerance, rats were fed with HSS in combination with daily intra-gastric administration of coffee solution for 12 weeks. As expected, chronic consumption of HSS caused overt glucose intolerance
in the rat at the 8th and 12th week of treatment. During
the OGTT, there was a two fold increase in blood glucose after 30 min of oral glucose load in control rats; and at 60 and 120 min, there was a decrease in blood glucose level and at 180 min, the blood glucose level was back to baseline level. Whereas in HSS fed rats, the increase was about three fold at 30 min and it was sustained until 60 min; while reduction was observed at 120 and 180 min, the hyperglycaemic state still persisted. The HSS fed rats treated with coffee solution behaved in a similar manner as that of control, the blood glucose level at 30, 60, 120 min were lower compared with HSS fed rats (Figure 1 and 2). The AUC during the OGTT in the HSS fed rats was significantly higher than the control rats; treatment of HSS fed rats with coffee preparation emend HSS-induced glucose intolerance as shown by a significantly (p<0.05) lower AUC (Figure 3).
Effects of coffee on insulin sensitivity
The results of insulin tolerance test show the changes in blood glucose in response to insulin injection (Figure 4 and 5). In the control group, blood glucose
level recorded a time-dependent fall at 15 min and 30 min post insulin injection. Compared to glucose level at 0 min, the blood glucose level was significantly (p<0.05) lower at 30 min post-insulin timeline. At 60 min, blood glucose level showed a gradual increase toward the baseline (pre-insulin injection) level but does not fully return to the baseline even at 120 min insulin injection. However, at 15 min post-insulin injection, the HSS fed rats showed a transient rise in the blood glucose level and falls to about pre-insulin injection level at 30 min timeline. When compared to the 0 min, there was no significant (p>0.05) difference in the blood glucose level at 30 min post-insulin injection. Administration of coffee solution to HSS fed rats attenuated the HSS-induced insulin resistance. At both 15 and 30 min, there was a time-dependent fall in the blood glucose level in the HSS fed rats treated with coffee similar but less
pronounced compared with control group.
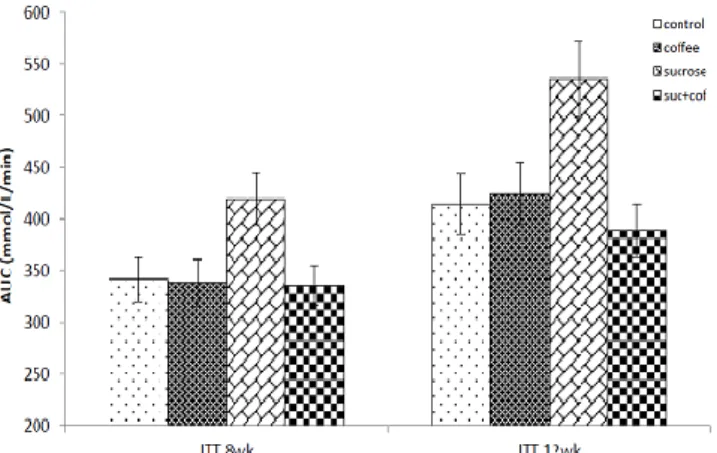
Meanwhile, the blood glucose level was significantly (p<0.05) lower at 30 min compared with baseline level. The AUC during the ITT in the HSS fed rats was significantly higher than the control rats; however, HSS fed rats treated with coffee showed a significantly (p<0.05) lower AUC compared with untreated HSS rats (Figure 6).
Effect of coffee on serum insulin level and lipid indices
The serum insulin concentration was only determined after consumption of HSS for 12 weeks (Table 2). The result showed that HSS caused a significant (p<0.05) increase in the serum insulin level compared with control rats. Treatment with coffee solution however produced a significant (p<0.05) decrease in the insulin concentration compared with HSS fed rats
Table 1: Body weight and food intake in all experimental groups
Data are expressed as mean ± SEM (n=6).
Table 2: Serum insulin, TC, TG, HDL and LDL levels in the experimental groups after 12 weeks of treatment.
Control Coffee Sucrose Suc+Cof
Insulin (μU/ml) 7.69 ± 0.22 8.63 ± 0.53 12.25 ± 0.51* 9.21 ± 0.66#
TC (nmol/L) 1.80 ± 0.10 1.71 ± 0.11 2.20 ± 0.14 2.14 ± 0.11
TG (nmol/L) 0.35 ± 0.03 0.32 ± 0.06 1.43 ± 0.32* 0.44 ± 0.06#
HDL (nmol/L) 0.89 ± 0.06 1.19 ± 0.08 0.69 ± 0.02* 1.10 ± 0.06#
LDL (nmol/L) 0.69 ± 0.03 0.65 ± 0.05 0.91 ± 0.06* 0.75 ± 0.03#
Data are expressed as mean ± SEM (n=6). *P < 0.05 vs. Control; #P < 0.05 vs. Sucrose (One-way ANOVA followed by SNK’s multiple comparison test).
Control Coffee Sucrose Suc+Cof
Body weight (g)
Week 0 125.0 ± 6.8 126.6 ± 5.4 125.8 ± 8.1 120.6 ± 4.2
Week 4 153.3 ± 8.5 152.1± 6.7 153.3 ± 7.4 150.8 ± 3.9
Week 8 175.8 ± 6.0 171.7 ±5.1 173.3 ± 3.6 176.6 ± 3.0
Week 12 200.8 ± 8.6 197.8 ± 7.8 200.8 ± 3.7 197.5 ± 8.6
Food Intake (g/100g BW/day)
Week 0 10.6 ± 3.68 10.8 ± 0.9 10.7 ± 0.6 10.8 ± 0.7
Week 4 10.9 ±1.8 11.6 ± 1.14 11.1 ±1.3 11.4 ± 1.5
Week 8 12.8 ± 1.4 13.9 ± 2.1 13.3 ± 1.1 13.3 ± 1.5
Coffee and Insulin resistance 182 Table 3: Level of lipid peroxidation and antioxidant enzyme activities in the different experimental groups after 12 weeks of treatment.
Control Coffee Sucrose Suc+Cof
MDA (nmol/ml) 17.3 ±1.41 18.6 ±1.74 37.4±3.59* 21.4±2.36#
SOD (mmol/ml) 5.45± 0.38 5.91± 0.72 1.63±0.01* 4.38 ± 0.23#
GSH (μmol/ml) 0.62 ± 0.04 0.66 ± 0.04 0.24± 0.01* 0.53 ± 0.03#
Data are expressed as mean ± SEM (n=6). *P < 0.05 vs. Control; #P < 0.05 vs. Sucrose (One-way ANOVA followed by SNK’s multiple comparison test).
Figure 1: Glucose response curves during oral-glucose-tolerance test in control and experimental rats after 8 weeks of treatment. Each point represents the mean, n=6. *P<0.05 compared with control group, #P<0.05 compared with sucrose group
Figure 2: Glucose response curves during oral-glucose-tolerance test in control and experimental rats after 12 weeks of treatment. Each point represents the mean, n=6. *P<0.05 compared with control group, #P<0.05 compared with sucrose group.
Table 2 also shows the serum TC, TG, HDL and LDL levels of all experimental rats. In normal rats treated with coffee, there was no significant (p>0.05) change in the TC level. However, TC level was significantly (p<0.05) increased in the HSS fed rats compared with the control rats. Meanwhile, in HSS fed rats treated, coffee treatment did not have an effect in reducing the TC level significantly after 8 weeks. TG and HDL
Figure 3: Area-under-curve during OGTT in control and experimental rats. Result are presented as mean±SEM, n=6. *P<0.05 compared with control group, #P<0.05 compared with sucrose group.
Figure 4: Glucose response curves during insulin-tolerance test in control and experimental rats after 12 weeks of treatment. Each point represents the mean, n=6. *P<0.05 compared with control group, #P<0.05 compared with sucrose group
Figure 5: Glucose response curves during insulin-tolerance test in control and experimental rats after 8 weeks of treatment. Each point represents the mean, n=6. *P<0.05 compared with control group, #P<0.05 compared with sucrose group.
Coffee and Insulin resistance 183
Figure 6: Area-under-curve during ITT in control and experimental rats. Result are presented as mean±SEM, n=6. *P<0.05 compared with control group, #P<0.05 compared with sucrose group.
levels were increased (p<0.05) significantly in HSS-fed rats compared with control rats. Consumption of coffee by HSS-fed rats produced a significant (p<0.05) decrease in TG and HDL levels when compared to their respective untreated HSS fed rats. After 12 weeks of HSS consumption, the serum LDL level was significantly (p<0.05) higher in the HSS fed rats compared with the control group. However, treatment with coffee solution significantly (p<0.05) decreased the serum LDL level compared with HSS fed rats.
Effect of coffee on lipid peroxidation and antioxidant enzymes
The effect of the high-sucrose diet on lipid peroxidation and antioxidant activities in plasma is shown in Table 3. Thus, we found that the HSS significantly (p<0.05) increased the MDA level compared with that observed in control rats. However, in HSS-fed rats treated with coffee, we found a significantly lower MDA level. Moreover, the antioxidant activities of SOD and GSH were significantly (p<0.05) reduced in HSS-fed rats compared with control rats while the differences were no longer observed with coffee treatment.
DISCUSSION
The objective of this study was to experimentally evaluate the effect of coffee consumption on the risk of T2DM. The data obtained from the present study suggest that coffee consumption attenuates the induction of insulin resistance by high-sucrose diet in rats. We observed that the severity of glucose intolerance, insulin insensitivity, lipid abnormalities and oxidative stress induced by chronic HSS diet was ameliorated by the administration of coffee solution.
Glucose intolerance is a consequence of a derangement of glucoregulatory control and is related to the status of T2DM. Changes in plasma glucose (and insulin) upon consumption of a bolus of glucose
assessed through OGTT provides information on small intestinal absorption of glucose, hepatic glucose uptake and to an extent the endocrine functions of the
pancreas and peripheral insulin resistance
(Tuomilehto, 2002). An increased glucose response in comparison to normal during the OGTT process is a marker of reduced pancreatic function or insulin resistance (Ralston, 2002). The AUCOGTT was significantly increased in HSS-fed rats but decreased in coffee solution treated rats. Glucose response 30 min post glucose administration was significantly reduced in rats treated with coffee solution when compared with rat given HSS only. Furthermore, examination of the glucose curve showed that the decline after peak glucose level is delayed on HSS-fed rats compared with coffee-treated rats. Our results showed a strong negative relationship between coffee consumption and the risk of HSS-induced glucose intolerance.
Ingestion of meals containing starches and sugar produces a rise in blood glucose which triggers the secretion of insulin by pancreas. Insulin acts to increase glucose transport, metabolism and storage (Gould and Holman, 1993). Insulin also inhibits glucagon secretion and lowers serum free-fatty acid concentrations, contributing to a sharp decline in liver glucose production (Shepherd and Kahn, 1999). Insulin tolerance test (ITT) has been shown to be a valuable tool to determine the basal insulin sensitivity directly (Graci et al. 1999). Typically, when the ITT is performed in an animal that is resistant to insulin, blood glucose levels will not fall as dramatically and/or will return to normal levels more quickly compared to a normal animal. In the present study, compared with the HSS-fed rats, plasma glucose concentration fall considerably upon insulin injection in rats treated with coffee solution. It is suggested
that coffee consumption may modulate
glucoregulatory pathway to have enhanced insulin sensitivity (possible) in the skeletal muscles (Champy et al. 2004), but the exact mechanism is not completely known.
Oxidation of fatty acid, de novo synthesis of fatty acids and cholesterol as well as lipoprotein assembly are essential process in lipid metabolism. These metabolic pathways are coordinately regulated to maintain glucose and lipid homeostasis under physiological condition (Raddatz and Ramadori, 2007). Dysregulated lipid synthesis is considered a major pathophysiological factor in the development of insulin resistance and T2DM. (Dong et al. 2006). In the present study, HSS increased TGs and LDL whereas coffee consumption reduced the levels of lipids. Serum concentration of HDL was also increased in the coffee solution treated group compared with HSS fed rats. We hypothesize that coffee solution regulate hepatic metabolism of lipids
Coffee and Insulin resistance 184
and could attenuate lipid abnormalities induced by HSS.
Excess glucose or hyperglycemia causes toxic effects on structure and functions of many organs including the pancreatic islet. Included in the mechanism for glucose toxicity is the production of excessive reactive oxygen species that result in oxidative stress and impaired insulin secretion (Robertson, 2004). Oxidative stress is known to be a fundamental mechanism involved in the development and progression of diabetes mellitus (Perez-Matute et al. 2009). Coffee may protect against oxidative stress - induced damage to pancreatic beta cells (Kaneto et al. 1999; Prasad et al. 2000). In the HSS-fed group, MDA level was elevated but was reduced in rats treated with coffee solution; under normal conditions, the antioxidant system maintain a low MDA level (Cerielo and Testa, 2009). The MDA level is a widely acceptable marker of lipid peroxidation and/or oxidative stress. Coffee possesses a high antioxidant capacity and is one of the major contributors to the antioxidant capacity of diet (Halvorsen et al. 2006; Pellegrini et al. 2007). Coffee antioxidants are bioavailable and it has been demonstrated that coffee consumption increases plasma antioxidant capacity
(Natella et al. 2007).In the present study, compared
with lipid peroxidation induced by HSS, antioxidants
activities was downregulated whereas coffee
consumption produced an upregulation. We therefore hypothesized that inhibition of oxidative stress may be one of the anti-diabetic mechanisms of the coffee solution. However, the association between coffee solution and oxidative stress vis a vis the complex mixture of compounds including caffeine, and phenolic compounds should be explored in further experimental study.
In conclusion, the data from the present study suggest that coffee consumption improves insulin sensitivity, glucose tolerance in HSS-fed rat possibly via inhibition of oxidative stress. The need to identify the active components of coffee and the mechanism of actions merits further investigation.
REFERENCES
Agardh E.E., Carlsson S. and Ahlborn A. (2004). Coffee consumption, type 2 diabetes and impaired
glucose tolerance in Swedish men and women. J.
Intern. Med. 255:645-652.
Bidel S., Hu G. & Qiao Q. (2006). Coffee consumption and risk of total cardiovascular mortality among patients with type 2 diabetes.
Diabetologia. 49:2618-2626.
Cerielo A. and Testa R. (2009). Antioxidant Anti-inflammatory treatment in type 2 diabetes.
Diabetes Care. 32:S232-S236.
Champy M.F., Selloum M., Piard L., Zeitler V., Caradec C., Chambon P. & Auwerx J. (2004).
Mouse functional genomics requires
standardization of mouse handling and housing
conditions. Mamm. Genome. 15:768-783.
Dong X., Park S., Lin X., Copps K., Yi X. and White M.F. (2006). Irs1 and 1rs2 signalling is essential for hepatic glucose homeostasis and systemic
growth. J. Clin. Investigation. 116:101-114.
Gould G.W. and Holman G.D. (1993). The glucose transporter family: Structure, function and
tissue-specific expression. J. Biochem. 295:329-341.
Graci S., Baratta R., Degano C., Luppa A., Vigneri R., Frittitta L. and Trischitta V. (1999). The intravenous insulin tolerance test is an accurate method for screening a general population for
insulin resistance and related abnormalities. J.
Endocrinol. Invest. 22:472-5.
Halvorsen B.L., Carlsen M.H. and Phillips K.M. (2006). Content of redox-active compounds (i.e., antioxidants) in foods consumed in the United
States. Am. J. Clin. Nutr. 84:95-135.
Kaneto H., Kajimoto Y. and Miyagawa J. (1999). Beneficial effects of antioxidants in diabetes: possible protection of pancreatic beta-cells against
glucose toxicity. Diabetes. 48:2398-2406.
Maritim A.C., Sanders R.A. and Watkins J.B. (2003). Diabetes oxidative stress and antioxidants; A
Review. J. Biochem Mol. Toxicol. 17:24-38
Matsuda Y., Kobayashi M., Yamauchi R., Ojika M., Hiramitsu M., Inoue T., Katagiri T., Murai A. and Horio F. (2011). Coffee and caffeine improve insulin sensitivity and glucose tolerance in
C57BL/6J mice fed a high-fat diet. Bio. Sci.
Biotechnol. Biochem. 75:2309-15.
Natella F., Nardini. M. and Belelli F. (2007). Coffee drinking indices incorporation of phenolic acids into LDL and increases the resistance of LDL to
ex vivo oxidation in humans. Am. J. Clin. Nutr.
86:604-609.
Nawrot P., Jordan S., Eastwood J., Rotstein J., Hugenholtz A. and Feeley M. (2003). Effects of
caffeine on human health. Food Addit. Contam.
20:1–30.
NIH (1985). Guide for the Use of Laboratory Animals DHHS, PHS.NIH Publication No. 85-23. Pellegrini N., Slavatore S. and Valtuena S. (2007).
Development and validation of a food frequency questionnaire for the assessment of
dietary total antioxidant capacity. J. Nutr.
137:93-98.
Perez-Matute P., Zulet. M.A. and Martinez J.A.
(2009). Reactive species and diabetes:
counteracting oxidative stress to improve health.
Curr. Opin. Pharmacol. 9: 771–779.
Prasad K., Mantha S.V. and Muir A.D. (2000).
Coffee and Insulin resistance 185
diglucoside against streptozotocin-induced
diabetes and its mechanism. Mol. Cell. Biochem.
206:141-149.
Raddatz and Ramadori G. (2007). Carbohydrate metabolism and the liver: actual aspects from
physiology and disease. Zeitschrift fur
Gastroenterologie. 45:51-62.
Ralston S.L. (2002). Insulin and glucose regulation.
Vet. Clin. N. Amer. Equine. Pract. 18:295-304. Ranheim T. and Halvorsen B. (2005). Coffee
consumption and human health - beneficial or detrimental? Mechanisms for effects of coffee consumption on different risk factors for cardiovascular disease and Type 2 diabetes
mellitus. Mol. Nutr. Food. Res. 49:274-284.
Ribeiro R.T., Lautt W.W., Legare D.J. and Macedo M.P. (2005). Insulin resistance induced sucrose feeding in rats due to impairment of the hepatic
parasympathetic nerves. Diabetologia.
48;976-983.
Robertson R.P. (2004). Chronic oxidative stress as a central mechanism for glucose toxicity in
pancreatic islet beta cells in diabetes. J. Biol.
Chem. 279:42351-42354.
Shepherd P.R. and Kahn B.B. (1999). Glucose transporters and insulin action-implications for
insulin resistance and diabetes mellitus. N. Eng. J.
Med. 341:248-257.
Sun M. and Zigman S. (1978). An improved
spectrophotometric assay for superoxide
dismutase based on ephinephrine autoxidation.
Anal. Biochem. 90:81-89.
Tuomilehto J. and Point. (2002). A Glucose Tolerance Test Is Important for Clinical Practice.
Diabetes Care. 25:1880-1882.
Uchiyama M. and Mihara M. (1978). Determination of malonaldehyde precursor in tissues by
thiobarbituric acid test. Anal. Biochem. 86:
271-278.
Van Dam R.M. and Hu F.B. (2005). Coffee, decaffeinated coffee and risk of type 2 diabetes: a
systematic review. JAMA. 294:97-104.
Van Dam R.M., Dekker J.M., Nijpels G., Stehouwer C.D., Bouter L.M. and Heine R.J. (2004). Coffee consumption and incidence of impaired fasting glucose, impaired glucose tolerance and type 2
diabetes: the Hoorn Study. Diabetologia.
47:2152-2159.
Van Dam R.M., Willett W.C., Manson J.E. and Hu F.B. (2006). Coffee, caffeine, and risk of type 2 diabetes: A prospective cohort study in younger
and middle-aged U.S. women. Diabetes Care.
29:398-403.
Van Dooran R., Liejdekker C.M. and Handerson P.T. (1978). Synergistic effects of phorone on the hepatotoxicity of bromobenzene and paracetamol
in mice. Toxicol. 11:225-233.
Yamacuchi R., Kobayashi M., Matsuda Y., Ojika M., Shigeoka S. and Yamamoto Y. (2010). Coffee and Caffeine Ameliorate Hyperglycemia, Fatty Liver, and Inflammatory Adipocytokine Expression in
Spontaneously Diabetic KK- A y Mice. J. Agric.