Turkish Economic Review
www.kspjournals.org
Volume 5 September 2018 Issue 3
Measurement and assessment of the evolution of
technology with a simple biological model
By
Mario COCCIA
a†Abstract. A simple model of the development of technology is presented. This model, in a broad analogy with evolutionary ecology of parasites, within a theoretical framework of Generalized Darwinism, can explain vital characteristics of technological advances and technological evolution. In particular, the evolution of technology is modelled here in terms of morphological changes between a host technology and a main subsystem of technology. The coefficient of evolutionary growth of this simple model here indicates the grade and type of the evolution of technology. This coefficient is quantified in real cases study using historical data of farm tractor, freight locomotive and electricity generation technology in steam-powered plants and internal-combustion plants. The approach of measurement and assessment of technological evolution proposed here seems to be appropriate in grasping the dynamics of technological evolution to predict which technologies are likeliest to evolve rapidly.
Keywords. Measurement of technology, Technometrics, Technological evolution, Technological change, Technological forecasting, Technology assessment, Technological progress, Innovation, Technology studies, Public decision making.
JEL. O30, O31, O32, O33, O38.
1. Introduction
he measurement of technology and innovation is an increasing challenge faced by agencies, scholars, public research labs and governments for supporting technological forecasting in society (cf., Daim et al., 2018; Hall & Jaffe, 2018; Linstone, 2004)1
. Patterns of technological innovation have been analyzed using many analogies with biological phenomena (Basalla, 1988;
Farrell, 1993; Nelson & Winter, 1982; Sahal, 1981; Solé et al., 2013; Wagner, 2011; Ziman, 2000). Wagner & Rosen (2014) argue that the application of evolutionary biology to different research fields has reduced the distance between life sciences and social sciences, generating new approaches, such as the evolutionary theory of economic change (Nelson & Winter, 1982; cf., Dosi, 1988). In the research field of technical change and technological forecasting, the measurement of technological advances is a central and enduring research theme to explain the dynamics of the evolution of technology and technological progress (Coccia, 2005, 2005a). Scholars in these research topics endeavourof measuring technological advances, the level of technological development and changes in technology with different approaches directed to technological forecasting and assessing the impact of new technology on socioeconomic systems (Coccia, 2005; Daim et al., 2018; Dodson, 1985; Faust, 1990; Fisher & Pry, 1971; Farrell, 1993; Knight, 1985; Martino, 1985; Sahal, 1981; Wang et al., 2016). However, a technometrics that measures and assesses the comprehensive evolution of
aa†
Arizona State University, Interdisciplinary Science and Technology Building 1 (ISBT1) 550 E. Orange Street, Tempe- AZ 85287-4804 USA.
. + 85287-4804 . [email protected]
T
technology as a complex system of technologies is, at author’s knowledge, unknown.
This study confronts this problem by proposing a theory of measurement of the evolution of technology based on interaction between technologies that may be useful for bringing a new perspective to explain and predict, whenever possible, the long-run coevolution between technologies. In order to position this paper in existing frameworks, the study here starts by establishing a theoretical framework of different approaches for measuring technological advances. Moreover, in broad analogy with biology, a conceptual framework of technological evolution, based on the approach of technological parasitism, is suggested (cf., Coccia & Watts, 2018). Then, the evolution of technology is modelledin simple way in terms of morphological changes between a host technology and its technological subsystems. Thecoefficient of evolutionary growth of the proposed model is quantified in real technologies using historical data. Overall, then, the technometrics here seems to be appropriate in grasping the typology and grade of the evolution oftechnology. This approach also provides fruitful information to predict which technologies are likeliest to evolve rapidly and lays a foundation for the development of more sophisticated concepts to measure and explain the general properties of the evolution of new technology in society.
2. Theoretical framework of the measurement of
technological advances (Technometrics)
Measurement assigns mathematical characteristics to conceptual entities. Stevens (1959, p.19) claims that the measurement is: ‚the assignment of numeral2 to objects or events‛. The central issue for a theory of measurement is the status of the two basic problems: the first is the justification of the assignment of the numbers to objects or phenomena (called the representational theorem); the second is the specification of the degree to which this assignment is unique (the uniqueness theorem; cf., Suppes & Zinnes, 1963; Luce et al., 1963). In the research field of technology, technometrics refers to a theoretical framework for the measurement of technology, technological advances and technological change with policy implications (Sahal, 1981). The measurement of technological advances has been performed with different approaches in engineering, scientometrics, technometrics, economics and related disciplines. This section presents some of the most important methods of technometrics, without pretending to be comprehensive (Coccia, 2005, 2005a, p. 948ff).
2.1. Hedonic approach to the measurement of technology
The assumption of this approach is a positive relationship between market price of a good or service and its quality. In particular, it is assumed that a particular product can be represented by a set of characteristics and by their value; hence, the quality of the product Qj is given by:
)
,...,
,...,
,
,...,
(
1 n 1j 2j kj jf
a
a
X
X
X
Q
where aiis the relative importance of the i-th characteristics and Xij is the qualitative level of the same characteristics in product j. Technological progress can be defined here as the change in quality during a given period of time:
t Q TCj j
The observed changes in the price of a product can be decomposed into a ‚quality/technological change‛ effect and ‚pure price effect‛ (cf., Coccia, 2005a, pp.948-949; Saviotti, 1985).
2.2. RAND
3approach to the measurement of technology
A technological device has many technical parameters that measure its characteristics and characterize the state-of-the-art (SOA). Many approaches measure the SOA and advances in SOA. Dodson (1985) considers the SOA as a convex surface in an N-dimensional space, where N is the number of essential characteristics of a technology. He proposes the use of either a planar or an ellipsoidal surface: Planar Ellipsoidal 1 1
n i i i a x 1 2 1
n i i i a xWhere xi is the i-th technological characteristic and aiis the i-thparameter (a constant). Alexander & Nelson (1973) developed an alternative procedure, using hyperplanes instead of ellipses.Overall, then, the hedonic and the RAND techniques for measuring technological advances are very similar and differ only in their choice of the dependent variable, which is price in the former and calendar year in the latter (Coccia, 2005a, pp.949-952).
2.3. Functional and structural measurement of technology
The technique by Knight (1985) is based on a functional and a structural description of a given technology over time to detectits evolution. The structural model was originated by Burks et al., (1946) that describe the computing system by outlining the pieces of equipment the computer must have, the purpose of devices, and the way the items interact with one another to perform as a computer. The functional description of a new computer over an earlier one indicates that technological advancement has taken place, but it does not specify the details of new development. In order to explain the technological advances, it is also necessary to use the structural descriptionby comparing the structure of new systems with that of earlier computers (cf., Coccia, 2005a, pp.955-957).
2.4. Wholistic and holistic approaches to the measurement of
technology
Sahal (1981) suggests two ideas of technometrics. In the first approach (called
Wholistic), the state-of-the-art (SOA) is specified in terms of a surface of constant probability density given the distribution of technological characteristics. The SOA at any given point in time is represented by a probability mountain, rising above the plane. The level of technological capability is given by the height of the mountain. Instead, the magnitude of technological change can be estimated by the difference in the heights of successive mountains. In the second approach (called Holistic), a technological characteristic is specified as a vector in an
N-dimensional space generated by a set of N linearly independent elements, such as mass, length, and time. The length of the vector represents the magnitude of a technological characteristic, while the kind of the characteristic is represented by the direction. In this case, the SOA reduces to a point. The successive points at various times constitute a general pattern of technological evolution that evinces a series of S-shaped curves. These two approaches are distinct but related (Coccia, 2005a, p.955).
2.5. Seismic approach to the measurement of technology
This approach, elaborated by Coccia (2005), categorizes effects of technological change through a scale similar to that used in seismology by Mercalli. In particular, according to the seismic approach, innovations of higher intensity generatea series of effectson subjects and objects within and between geoeconomic systems. The intensity of innovation on socioeconomic systems is measured with an indicator called Magnitude of Technological Change, which is similar to the magnitude of the Richter scale that measures the energy of earthquakes (cf., Coccia, 2005a, pp.967-969).
2.6. Technological advances measured with patent data
These studies are aimed to investigate technological evolution considering the patent data. Faust (1990, p.473) argues that patent indicators allow for a differentiated observation of technological advances before the actual emergence of an innovation, such as technological development in the scientific field of superconductivity. Wang et al. (2016, p.537ff) investigate technological evolution using US Patent Classification (USPC) reclassification. Results suggest that:‚patents with Inter-field Mobilized Codes, related to the topics of ‘Data processing: measuring, calibrating, or testing’ and ‘Optical communications’, involved broader technology topics but had a low speed of innovation. Patents with Intra-field Mobilized Codes, mostly in the Computers & Communications and Drugs & Medical fields, tended to have little novelty and a small innovative scope‛ (Wang et al., 2016, p.537, original emphasis). Future research in this research field should extend the patent sample to subclasses or reclassified secondary USPCs in order to explain the in-depth technological evolution within a specific scientific field.
2.7. Measuring technological evolution using a model of technological
substitution
In the context of the measurement of technological advances, Fisher & Pry (1971, p.75) argue that technological evolution consists of substituting a new technology for the old one, such as the substitution of coal for wood, hydrocarbons for coal, robotics technologies for humans (see Daim et al., 2018), etc. They suggest a simple model of technological substitution that contains only two parameters. Technological advances are here represented by competitive substitutions of one method of satisfying a need for another. Fisher & Pry (1971, p.88) state that: ‚The speed with which a substitution takes place is not a simple measure of the pace of technical advance… it is, rather a measure of the unbalance in these factors between the competitive elements of the substitution‛.
New approaches of technological assessment apply technology development envelope to detect multiple pathways for technological evolution and construct strategic roadmapping as illustrated by Daim et al., (2018, p. 49ff) for robotics technologies.
Overall, then, although different approaches of themeasurement of technological advances are suggested (Arthur & Polak, 2006; Sahal, 1981; Daim et al., 2018), a technometrics that measures the evolution of technology considering how subsystems of technology interact with a host technology in a complex system of technology is, at author’s knowledge, unknown. To reiterate, this study endeavours to measure the evolution of technologywith a new perspective based on coevolution between technologies to predict the long-term development of the whole complex system of technology.
Next section presents the conceptual framework of the technometrics here, which is based on the theory of technological parasitism (Coccia & Watts, 2018).
3. A proposed technometrics for the evolution of technology
in complex systems
Hodgson & Knudsen (2006) suggest a generalization of the Darwinian concepts of selection, variation and retention to explain how a complex system evolves (Hodgson 2002, p.260; cf., Levit et al., 2011; Schubert, 2014, p.486ff). In economics of technical change, it is become commonplace to argue that the generalization of Darwinian principles (‚Generalized Darwinism‛) can assist in explaining the nature of innovation processes (cf., Basalla, 1988). Sahal (1981) argues that: ‚evolution…pertains to the very structure and function of the object (p. 64) …involves a process of equilibrium governed by the internal dynamics of the object system (p. 69)‛. The process of development of technology generates the formation of a complex system (cf., Sahal, 1981, p.33). Evolution of a technology concerns a process governed by the interaction between acomplex systemof technology and its inter-related systems and subsystems (Coccia & Watts, 2018). An important step towards the measurement and assessment of technological progress is to first clarify the concept of complex system. Simon (1962, p.468) states that: ‚a complex system [is]… one made up of a large number of parts that interact in a nonsimple way… complexity frequently takes the form of hierarchy, and… a hierarchic system… is composed of interrelated subsystems, each of the latter being, in turn, hierarchic in structure until we reach some lowest level of elementary subsystem.‛ McNerney et al., (2011, p.9008) argue that: ‚The technology can be decomposed into n components, each of which interacts with a cluster of d−1 other components‛ (cf., Andriani & Cohen, 2013; Angus & Newnham, 2013; Arthur & Polak, 2006, Barton, 2014; Gherardi & Rotondo, 2016; Kauffman & Macready, 1995; Kyriazis, 2015; McNerney et al., 2011; Solé et al., 2013). Arthur (2009, pp.18-19) claims that the evolution of technology is due to combinatorial evolution: ‚Technologies somehow must come into being as fresh combinations of what already exists‛. This combination of components and assemblies is organized into systems to some human purpose and has a hierarchical and recursive structure. This studyhere endeavours, starting from concepts just mentioned, to measure technological advances in a framework of host-parasite technological systems, in a broad analogy with ecology (Coccia & Watts, 2018). Basic concepts of this conceptual framework are by Coccia & Watts (2018).
Technology is defined as a complex system that is composed of more than one component and a relationship that holds between each component and at least one other element in the system. The technology is selected and adapted in the Environment E to satisfy needs and human desires, solve problems in human society and support human control of nature.
Interaction between technologiesin complex system is a reciprocal adaptation between technologies with interrelationship of information/resources/energy and other physical phenomena to satisfy needs and human wants.
Coevolution of technologies is the evolution of reciprocal adaptations in a complex system that generates innovation—i.e., a modification and/or improvement of technologies that interact and adapt in a complex system to expand content of the human life-interests whose increasing realization constitutes progress.
In general, host technologies form a complex system of parts and subsystems that interact in a non-simple way (e.g., batteries and antennas in mobile devices; cf., Coccia & Watts, 2018; Coccia, 2017). In this context, Coccia (2017a) states the theorem of impossible independence of any technology that: in the long run, the behaviour and evolution of any technology is not independent from the behaviour and evolution of the other technologies.In fact, Sahal (1981, p.71) argues that: ‚the evolution of a system is subject to limits only insofar as it remains an isolated system.‛
Overall, then, the theory of technological parasitism (Coccia & Watts, 2018), shortly described here, proposes that the interaction between technologies in a complex system tends to generate stepwise coevolutionary processes of a whole system of technology within the ‚space of the possible‛ (Wagner & Rosen, 2014,
passim).
In order to operationalize the approach of technological parasitism to measure and predict the evolution of technology, this study proposes a simple model of technological interaction between a host technology H and an interrelated subsystem P. This model focuses on morphological changes in subsystems of technology in relation to proportional changes in the overall host system of technology. This model, based on the biological principle of allometry, was originally developed by biologists to study the differential growth rates of the parts of a living organism’s body in relation to the whole body during evolution processes (Reeve & Huxley, 1945; Sahal, 1981).
3.1. A model of technological evolution
Let P(t) be the extent of technological advances of a technology Pat the time t
and H(t) be the extent of technological advances of atechnologyH that is a master or host systemthat interacts with P, at the same time (cf., Sahal, 1981, pp.79-89). Suppose that both P and He volve according to some S-shaped pattern of technological growth, such a pattern can be represented analytically in terms of the differential equation of the logistic function:
K H
K b dt dH H 1 1 1 1We can rewrite the equation as:
K H
dH bdt H K 1 1 1 1 The integral of this equation is:
K H
A bt H log 1 1 log t b a H H K 1 1 1 log
a bt
K H 1 1 1 exp 1 t ba1 1 andt = abscissa of the point of inflection.
The growth of H can be described respectively as:
t b a H H K 1 1 1 log (1)
Mutatis mutandis, for P(t) in similar way of H(t), the equation is:
t b a P P K 2 2 2 log (2)
The logistic curve here is a symmetrical S-shaped curve with a point of inflection at 0.5K with a1= constant depending on the initial conditions, K1 = equilibrium level of growth, and b1 = rate-of-growth parameter.
Solving equations [1] and [2] for t, the result is: P P K b b a H H K b b a t 2 2 2 2 1 1 1 1 1log 1log
The expression generated is:
2 1 2 1 1 b b P K P C H K H (3)
C1=exp[b1(t2-t1)] (for t2 andt1 cf., eqs. [1] and [2]); when P and H are small in comparison with their final value, the simple model of technological evolution is given by: 1
)
(
1 BH
A
P
(4) where
1 1 2 1 1 2 C K K A b b and 1 2 1 b b B The logarithmic form of the equation [4] is a simple linear relationship:
LnH B LnA
LnP 1 1 (5)
1
B is the evolutionary coefficient of growththat measures the evolution of technology and is quantified in real instances in the next section.
This model of the evolution of technology [5] has linear parameters that are estimated with the Ordinary Least-Squares Method. The value of B1in the model [5] measures the relative growth of P in relation to the growth of H andindicates different patterns of technological evolution: B1<1 (underdevelopment), B1 1 (growth or development of technology). In particular,
1
1
B , whether technology P (a subsystem of H) evolves at a lower relative
rate of change than technology H; the whole hosttechnology H has a slowed evolution (underdevelopment) over the course of time.
1
B has a unit value: B11, then the two technologies P and H have proportional change during their evolution: i.e., acoevolution between a whole system of technology (H) and its interacting subsystem P. This case of the proportional change generates a technological evolution of isometry between elements of a complex system. In short, when B=1, the whole system of technology H here has a proportional evolution of its component technologies (growth) over the course of time.
1
1
B , whether P evolves at greater relative rate of change than H; this
pattern denotes disproportionate technological advances in the structure of a subsystem P as a consequence of change in the overall structure of a host technological system H. The whole system of technology H has an accelerated evolution (development) over the course of time.
This technometrics justifies the representational and uniqueness theorem in the measurement of the evolution of technology. Moreover, results of model [5], represented by the coefficient of evolutionary growth of technology,can be systematized in an ordinal scale that indicates the grade and type of the evolution of technology (table 1).
Table 1. Scale of the evolution of technology in complex systems
Grade of
evolution Coefficient of evolutionary growth
Type of the evolution of technology
Associated Evolutionary stages of the evolution of technology
Predictions 1 Low B<1 Slowed Underdevelopment Technologyevolves
slowly over the course of time
2 Average B=1 Proportional Growth Technologyhas a steady-state path of evolution 3 High B>1 Accelerated Development Technologyis likeliest to
evolve rapidly
Properties of the scale of the evolution of technology (Table 1) are:
Technology of higher rank-order (grade) on the scale has higher technological advances of lower rank-order (grade) technologies.
If a technology has the highest ranking on the scale (i.e., three), it evolves rapidly (development) over the course of time. Vice versa, if a technology has the lowest ranking on the scale (i.e., one), it evolvesslowly (underdevelopment).
Evolution of technology of higher rank order on the scale has accumulated all previous stages of low rank order and generatesa fruitful symbiotic growth between a whole system of technology H and its interacting subsystem-components Pi(i=1, .., n).
4. Materials and method
4.1. Data and their sources
The evolution of technology is illustrated here using historical data of four example technologies: farm tractor technology, freight locomotive technology, generation of electricity technology in steam-powered and internal-combustion plants in the USA. Sources of data are tables published by Sahal (1981, pp.319-350, originally sourced from trade literature; cf., also Coccia, 2018). Note that data from the earliest years and also the war years are sparse for some technologies.
4.2. Measures
Technological parameters that measure the evolution of technology are given by Functional Measures of Technology (FMT) over the course of time to take into account both major and minor innovations (cf., Sahal, 1981, pp. 27-29).
FMTs for farm tractor are:
fuel-consumption efficiency in horsepower-hours over 1920-1968 CE indicates the technological advances of engines (a subsystem) of farm tractors. This FMT represents the dependent variable P in the model [5].
mechanical efficiency (ratio of drawbar horsepower to belt or power take-off – PTO- horsepower) over 1920-1968 CE is a proxy of the technological advances of farm tractor. This FMT represents the explanatory variable H in the model [5].
For freight locomotive, FMTs are:
Tractive efforts in pound over 1904-1932 CE indicate the technological advances of locomotive. This FMT represents the dependent variable P in the model [5].
Total railroad mileage over 1904-1932 CE indicates the evolution of the infrastructure system of railroad. This FMT represents the explanatory variable in the model [5].
For steam-powered electricity-generating technology, FMTs are:
Average fuel-consumption efficiency in kilowatt-hours per pound of coal over 1920-1970 CE indicates the technological advances of boiler, turbines and electrical generator (subsystems of steam-powered plant). This FMT represents the dependent variable P in the model [5].
Average scale of plant utilization (the ratio of net production of steam-powered electrical energy in millions of kilowatt-hours to number of steam
powered plants) over 1920-1970 CE indicates a proxy of the technological advances of the overall electricity-generating plants. This FMT represents the explanatory variable in the model [5].
For internal-combustion type electric power technology, FMTs are:
Average fuel-consumption efficiency in kilowatt-hours per cubic foot of gas 1920-1970 CE indicates the technological advances of boiler, turbines and electrical generator (subsystems of internal combustion plant). This FMT represents the dependent variable P in the model [5].
Average scale of plant utilization (the ratio of net production of electrical energy by internal-combustion type plants in millions of kilowatt-hours to total number of these plants) over 1920-1970 CE indicates a proxy of the technological advances of the overall electricity-generating plants with this internal-combustion technology. This FMT represents the explanatory variable in the model [5].
4.3. Model and data analysis procedure
Model [5] of the technological evolution implemented in real instances here is:
Ln Pt = Ln a + B Ln Ht + ut (with ut = error term) (6)
a is a constant
Pt will be the extent of technological advances of technology P that represents a subsystem of the Host technology H at time t
Ht will be the extent of technological advances of technology H that represents the host technology of an interacting subsystem technology P at time t; H technology is the driving force of the evolutionary growth of overall interrelated subsystems of technology.
Thee quation of simple regression [6] is estimated usingthe Ordinary Least Squares method. Statistical analyses are performed with the Statistics Software SPSS version 24.
5. Case studies of the evolution of technology in the
agriculture, rail transport and electricity generation
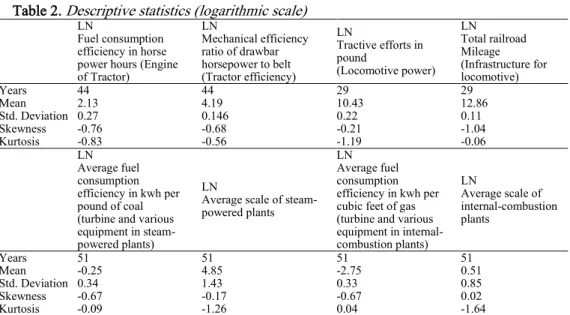
The evolution of technology modelled here is illustrated with realistic examples using historical data of farm tractor, freight locomotive, steam-powered electricity-generating technology and internal-combustion type electric power technology in the USA. Table 2 shows the descriptive statistics of the study. Table 2. Descriptive statistics (logarithmic scale)
LN
Fuel consumption efficiency in horse power hours (Engine of Tractor) LN Mechanical efficiency ratio of drawbar horsepower to belt (Tractor efficiency) LN Tractive efforts in pound (Locomotive power) LN Total railroad Mileage (Infrastructure for locomotive) Years 44 44 29 29 Mean 2.13 4.19 10.43 12.86 Std. Deviation 0.27 0.146 0.22 0.11 Skewness -0.76 -0.68 -0.21 -1.04 Kurtosis -0.83 -0.56 -1.19 -0.06 LN Average fuel consumption efficiency in kwh per pound of coal (turbine and various equipment in steam-powered plants)
LN
Average scale of steam-powered plants
LN Average fuel consumption efficiency in kwh per cubic feet of gas (turbine and various equipment in internal-combustion plants) LN Average scale of internal-combustion plants Years 51 51 51 51 Mean -0.25 4.85 -2.75 0.51 Std. Deviation 0.34 1.43 0.33 0.85 Skewness -0.67 -0.17 -0.67 0.02
5.1. Results of the evolution of farm tractor technology (1920-1968)
Table 3 shows theevolutionary coefficient of growth of farm tractor technology, from model [6], is B = 1.74, i.e., B >1: the subsystem component technology of engine (P) has a disproportionate technological growth in comparison with overall farm tractor (H). This coefficient indicates a high grade of the evolution of technology (three) anda development of the whole system of farm tractor technology (cf., Figure 1).Table 3. Estimated relationship for farm tractor technology
Note: ***Coefficient is significant at 1‰; Explanatory variable is LN mechanical efficiency ratio of drawbar horsepower to belt (technological advances of farm tractor –Host technology), t = (1920–1968).
Figure 1.
Trend and estimated relationship of the evolution of farm tractor technology
This result confirms the study by Sahal (1981) that the rapid evolution of farm tractor technology is due to numerous advances and radical innovations over time, such as the diesel-powered track-type tractor in 1931, low-pressure rubber tires in 1934 and the introduction of remote control in 1947 that made possible improved control of large drawn implements. The development of the continuous running power takeoff (PTO) also in 1947 allowed the tractor’s clutch to be disengaged without impeding power to the implements. Moreover, itis introduced, in 1950, the 1000-rpm PTO for transmission of higher power, whereas in 1953 power steering was applied in new generations of tractor. In addition, the PTO horsepower of the tractor has more than doubled from about 27hp to 69hp over 1948-1968; finally, dual rear wheels in 1965, auxiliary front-wheel drive and four-front-wheel drive in 1967 have improved the overall technological performance of the tractor (Sahal, 1981, p.132ff). These radical and incremental innovations have supported the accelerated evolution of the farm tractor technology over time as confirmed by the statistical evidence here with the coefficient of evolutionary growth B>1.
Dependent variable: LN fuel consumption efficiency in horsepower hours (technological advances of engine for tractor at t =1920, …, 1968) Constant (St. Err.) Evolutionary coefficient =B (St. Err.) R2 adj. (St. Err. of the Estimate) F (sign.) Farm tractor 5.14*** (0.45) 1.74*** (0.11) 0.85 (0.10) 256.44 (0.001)
5.2. Results of the evolution of freight locomotive technology (1904–
1932)
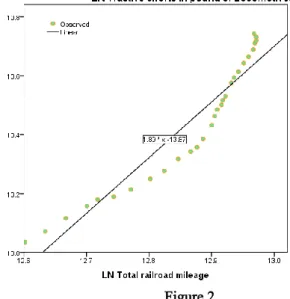
Table 4 shows that the evolutionary coefficient of freight locomotive technology is B = 1.89, i.e., B> 1: this coefficient of growth indicates a stage of development of freight locomotive technology in the complex system of rail transportation (see, Figure 2).
Table 4. Estimated relationship for freight locomotive technology
Note: ***Coefficient is significant at 1‰; Explanatory variable is LN Total railroad mileage (technological advances of the infrastructure –Host technology) at t =1904, …, 1932
This development of freight locomotive technology can be explained with a number of technological improvements, such as the introduction of the compound engine in 1906 that improved the tractive effort (Sahal, 1981). In 1912 the first mechanical stoker to use the steam-jet overfeed system of coal distribution and the substitution of pneumatically operated power reverse gear for the hand leverhave improved locomotive power. In 1916, it is introduced the unit drawbar and radial buffer that eliminated the need for a safety chain in coupling the engine and tender together. Further technological advances are due to the adoption of cast-steel frames integral with the cylinder, the chemical treatment of the locomotive boiler water supply and the introduction of roller bearings over 1930s. In particular, these technical developments reduced the frequency of maintenance work in locomotives. Subsequently, the continuous modification of the steam locomotive with reciprocating engine has led to diesel-electric locomotive by the mid-1940s (Sahal, 1981, p.154ff). These technological developments have supported the accelerated evolution of freight locomotive technology over time as confirmed by the coefficient of evolutionary growth B>1 calculated above.
Figure 2.
Trend and estimated relationship of the evolution of freight locomotive technology
Dependent variable: LN Tractive efforts in pound of locomotive (technological advances), t = (1904–1932) Constant (St. Err.) Evolutionary coefficient =B (St. Err.) R2 adj. (St. Err. of the Estimate) F (sign.) Farm tractor 13.87*** (1.48) 1.89*** (0.12) 0.91 (0.07) 270.15 (0.001)
5.3. Results of the evolution of electricity generation technology
(1920-1970)
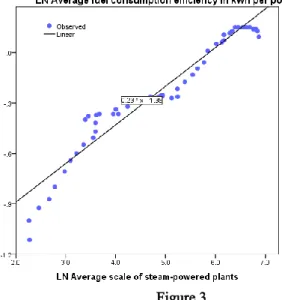
Table 5 shows that steam-powered electricity-generating technology is B = 0.23, i.e., B < 1 (see alsoFigure 3).
Table 5. Estimated relationship for the steam-powered electricity-generating technology
(1920-1970)
Note: ***Coefficient is significant at 1‰; Explanatory variable is Average scale of steam-powered plants (Host technology) at t =1920, …, 1970
Figure 3.
Trend and estimated relationship of the evolution of steam-powered electricity-generating technology (1920-1970)
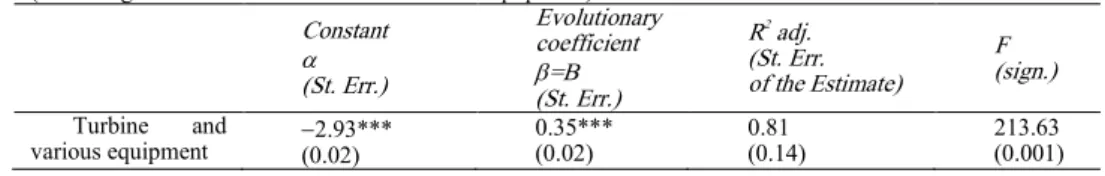
Table 6 shows for internal-combustion type electric power technology similar results to steam-powered electricity-generating technology: coefficient of evolutionary growth of this technology is B = 0.35, i.e., B < 1. In short, evolution of technology in the generation of electricity both in steam-powered plants and internal-combustion plants is low and driven by an evolutionary route of underdevelopment over the course of time (see, Figure 3 and 4). This evolution of technology in the generation of electricity is associated with available natural resources, the increase in steam pressure and temperature made possible by advances in metallurgy, the use of double reheat units and improvements in the integrated system man-machine interactions to optimize the operation of overall plants (Sahal, 1981, pp.183ff)). In general, the rate of technological evolutionin the generation of technology has slowed down (underdevelopment) because of: ‚the deterioration in the quality of fuel and of constraints imposed by environmental conditions….other main reasons: First, increased steam temperature requires the use of more costly alloys, which in turn entail maintenance problems of their own…. Thus there has been a decrease in the maximum throttle temperature from 1200 °F in 1962, to about 1000 °F in 1970. Second, there has been lack of motivation to increase the efficiency in the use of gas in both steam-powered and internal-combustion plants because of the artificially low price of fuel due to Federal Power Commission’s wellhead gas
Dependent variable: LN Average fuel consumption efficiency in kwh per pound of coal (technological advances of turbine and various equipment)
Constant (St. Err.) Evolutionary Coefficient =B (St. Err.) R2 adj. (St. Err. of the Estimate) F (sign.) Turbine and various equipment 1.35*** (0.04) 0.23*** (0.01) 0.93 (0.09) 675.12 (0.001)
price regulation. Finally, … there has been a slowdown in generation efficiency due to heavy use of low-efficiency gas turbines necessitated by delays in the construction of nuclear power plant‛ (Sahal, 1981, p.184).
Table 6. Estimated relationship for internal-combustion type electric power technology (1920-1970)
Note: ***Coefficient is significant at 1‰; Explanatory variable is LN Average scale of internal-combustion plants (Host technology) at t =1920, …, 1970
Figure 4.
Trend and estimated relationship of the evolution of internal-combustion type electric power technology (1920-1970)
6. Discussion
Themeasurement of technological advances needs a unifying perspective to explain and predict the evolution of technology, which has more and more complexity in markets with rapid changes. This article proposes a new perspective for the measurement of the evolution of technology that is adapted from ecology and is modelled with a simple modelof morphological change thatassessesand predicts the technological developmentdriven by interaction between a host technology and its parasitic- subsystems of technologyover the long run. As a matter of fact, some scholars argue that technologies and technological progress display numerous life-like features, suggesting a deep connection with biological evolution (Basalla, 1988; Erwin & Krakauer, 2004;
Solé et al., 2011; Wagner & Rosen, 2014). In general, biological evolution seems to support possible explanations of technology evolution (Basalla, 1988). In this context, this study extends the broad analogy between technological and biological evolution to more specifically focus on the potential of a technometrics based on interaction between technologies in complex systems, but fully acknowledge that interaction between technologies is not a perfect analogy of biological/ecological interaction; of course, there are differences (Ziman, 2000;
Jacob, 1977; Solé et al., 2013). For studying technical progress, though, the analogy with biology and ecology is a source of ideas because biological
Dependent variable: LN Average fuel consumption efficiency in kwh per cubic feet of gas (technological advances of turbine and various equipment)
Constant (St. Err.) Evolutionary coefficient =B (St. Err.) R2 adj. (St. Err. of the Estimate) F (sign.) Turbine and various equipment 2.93*** (0.02) 0.35*** (0.02) 0.81 (0.14) 213.63 (0.001)
evolution has been studied in-depth and provides a logical structure of scientific inquiry in research fields concerning technology.
The study here suggestsa theoretical framework that seems to be appropriate to measure the evolution of technology and predict possible evolutionary pathways of the complex systems of technology.In particular, the evolution of technology here is based on a simple assumption that technologies are complex systems that interact in a nonsimple way with other technologies and its interrelated subsystems of technology. Thedynamics of the evolution of technology here is based on a S-shaped growth curve of technological advances both forthe whole system of technology and for its interrelated subsystem components. The approach here is formalized with a simple model that contains only two parametersand provides the coefficient of evolutionary growth, which is useful to measure the typology of evolution of technology and predict which technologies are likeliest to evolve rapidly.In particular, the technometrics here provides three simple grades of the evolution of technology according to the coefficient of evolutionary growth: B<1 (underdevelopment), B=1 (growth) and B>1 indicates the development of the whole system of technology. Hence, the evolution of technology is a multidimensional process of interaction within and between technologies, such that a technology, which remains an isolated system and does not interact with other technologies, can slow down technological advances over the course of time (Coccia, 2017a; Sahal, 1981). The technometrics proposed here, illustrated infour example technologies, provides consistent patterns of the evolution of technologiessupported by the history of technology.
One of the most important findings of the proposed theoretical framework here is two general properties of the accelerated evolution of technology as a complex system: (1) disproportionate growth of its subsystems and (2) increase in the complexity of the structure of technology during the rapid evolutionary growth of its interacting subsystem-component technologies.
Thequantification of the coefficient of evolutionary growth of the model [6], called B, can also suggest reliable predictions of the long-term development of technology, given by:
Evolution of technology in the form of development of the whole system is governed by a process of disproportionate growth in its subsystems (B>1) as a consequence of change in the overall system of the host technology (e.g., technological development of farm tractor and freight locomotivetechnologies described here).
Evolution of technology reduces speed when its component subsystems have low changes as a consequence of changes of the whole system of host technology (B<1), generating underdevelopmentof the whole system of technology over the course of time (e.g., the electricity generation technology).
The long-run evolution of a technology depends on the behaviour and evolution of associated technologies (interacting systems and subsystems). To put it differently, long-run evolution of a specific technology is enhanced by the integration of two or more technologies that generate co-evolution of system innovations.
Technologies having an accelerated symbiotic growth of itsinteracting subsystem technologies (B>1) advance rapidly, whereas technologies with low growth of its interacting parts (B<1) improve slowly.
Isolated system of technology, with low interaction between systems and among the parts of its system, is subject to limits of long-run evolution.
In general, this study shows that the technology is a complex system driven by manifold factors. Sahal (1981, p.69) argues that the dynamics of a system is affected by its history and associated processes of generating and self-constraining of its growth. Moreover, the evolution of technological system is also due to processes of learning, based on interaction processes between different technological devices and its subsystems that determine the scope for
the utilization of a technology andthe directions of technological guideposts and innovation avenues over time (cf., Sahal, 1981; Nelson & Winter, 1982). In fact, Sahal (1981, p.82, original italics) argues that: ‚the role of learning in the
evolution of a technique has profound implications for its diffusion as well‛. In addition, findings here show that the evolution of technologies is affected by scientific and technological advances of the whole system and its subsystems (e.g., for farm tractor and freight locomotive technologies) but it is also affected by socio-institutional environment that can slowdown technological progress (e.g., low technological advances in steam-powered electricity-generating technology and internal-combustion type electric power technology).
The finding of this study could aid technology policy and management of technology to design best practices forsupporting development of new technology, and as a consequence, industrial and economic change in human society. Proposed theory here hasalso a number of implications for the analysis of nature, sources and evolution of technology. One of the most important implications is theinteraction between technologyand its subsystem components in complex systems that drivethe evolutionary pathways of complex systems of technology and technological diversification over time and space. This suggested approach of technometrics here is consistent with the well-established literature by Arthur (2009) as well as with studies that consider structural innovations and systems innovations based on integration of two or more symbiotic technologies (Sahal, 1981).
The main limitation of this approach is in the lack of useful data in sufficient quality for different technologies. Future efforts in this research fieldrequire a substantial amount of data of technological parameters to provide additionalempirical evidence of the different pathways of technological evolutionover time and space.
To conclude, the proposed approach here based on the ecology-like interaction between technologies—may lay the foundation for development of more sophisticated concepts and theoretical frameworks in technometrics and technological forecasting. In particular, this study constitutes an initial significant step in measuring the evolution of technology considering the interaction between technologies in complex systems to predict the long-run behaviour and evolution of fruitful technological trajectories in society. Nevertheless, identifying comprehensivetechnometrics in different domains of technology, affected by manifold and complex factors, is a non-trivial exercise. Wright (1997, p. 1562) properly claims that: ‚In the world of technological change, bounded rationality is the rule.‛
Acknowledgement
I gratefully acknowledge financial support from National Endowment for the Humanities and National Research Council of Italy–Direzione Generale Relazioni Internazionali (Research Grant n. 0072373-2014 and n. 0003005-2016) for my visiting at Arizona State University where this research started in 2014. I thank the Library of Arizona State University for scientific material provided on these topics. I am grateful to Trang T. Thai (Intel Corporation) and participants at seminars held in the USA and Italy for fruitful suggestions and comments concerning these scientific topics.
Notes
1
Cf. for study of the sources of technological innovation in a context of complexity and national system of innovation: Anadon et al., 2016; Andriani & Cohen, 2013; Angus & Newnham, 2013; Barabási et al., 2001; Barton, 2014; Coccia, 2005, 2005a, 2005b, 2006, 2009, 2010, 2010a, 2012, 2013, 2013a, 2014, 2014a, 2014b, 2015, 2015a, 2016, 2016a, 2017, 2017a, 2017b, 2017c, 2018, 2018a, 2018b, 2018c, 2018e, 2018f; Coccia & Bellitto, 2018; Coccia & Bozeman, 2016; Coccia & Cadario, 2014; Coccia et al., 2015; Coccia & Rolfo, 2009, 2010, 2013; Dawkins, 1983; Farmer & Lafond, 2016; Grodal et al., 2015; Hodgson, 2002; Hodgson & Knudsen, 2006, 2008; Kauffman & Macready, 1995; Kreindler & Peyton Young, 2014; Kyriazis, 2015; Levit et al., 2011; Nagy et al., 2013; Nelson, 2006; Nordhaus, 1997; Oswalt, 1976; Rosenberg, 1969; Schubert, 2014; Schuster, 2016; Valverde, 2016; Valverde et al., 2007; Watanabe et al., 2012.
2
The term ‚numeral‛ according to Stevens (1959, p. 19) refers to an element in a formal model, not to a particular mark on a particular piece of paper.
3
RAND Corporation ("Research ANd Development") is an U.S. research organization to develop research and analysis that support US public policy for increasing the security, health and economic growth of the USA, allied countries and in general the world.
References
Alexander, A.J., & Nelson, J.R. (1973). Measuring technological change: Aircraft turbine engines, Technological Forecasting & Social Change, 5(2), 189-203.
Anadon, L.D., Chan, G., Harley, A.G., Matus, K., Moon, S., Murthy, S.L., & Clark, W.C. (2016). Making technological innovation work for sustainable development, Proceedings of the National Academy of Sciences, 113(35), 9682–9690. doi. 10.1073/pnas.1525004113
Andriani, P., & Cohen, J. (2013). From exaptation to radical niche construction in biological and technological complex systems. Complexity, 18(5), 7-14. doi. 10.1002/cplx.21450
Angus, S.D., & Newnham, A. (2013). The bit-economy: An artificial model of open-ended technology discovery, Complexity, 18(5), 57-67. doi. 10.1002/cplx.21449
Arthur, B.W. (2009). The Nature of Technology. What it is and How it Evolves. Free Press, Simon & Schuster.
Arthur, B.W., & Polak W. (2006). The evolution of technology within a simple computer model, Complexity, 11(5), 23-31.
Barabási, A-L., Freeh, V.W., Jeong, H., & Brockman, J.B. (2001). Parasitic computing. Nature, 412, 894-897. doi. 10.1038/35091039
Barton, C.M. (2014). Complexity, social complexity, and modeling, Journal of Archaeological Method and Theory, 21, 306-324.
Basalla, G. (1988). The History of Technology. Cambridge University Press, Cambridge.
Bellitto, M., & Coccia, M. (2018). Interrelationships between Violent crime, demographic and socioeconomic factors: A preliminary analysis between Central-Northern European countries and Mediterranean countries, Journal of Economic and Social Thought, 5(3), 230-246.
Burks, A., Goldstine, H.H., & von Neumann J. (1946). Preliminary discussion of the logical design of an electronic computing instruments, the Institute for Advanced Study, Princeton.
Coccia, M. (2001). Satisfaction, work involvement and R&D performance. International Journal of Human Resources Development and Management, 1(2-3-4), 268-282. doi. 10.1504/IJHRDM.2001.001010
Coccia, M. (2003). Metrics of R&D performance and management of public research institute. Proceedings of IEEE- IEMC 03, Piscataway, pp.231-236.
Coccia, M. (2004). Spatial metrics of the technological transfer: analysis and strategic management. Technology Analysis & Strategic Management, 16(1), 31-52. doi. 10.1080/0953732032000175490
Coccia, M. (2005). Countrymetrics: valutazione della performance economica e tecnologica dei paesi e posizionamento dell’Italia, Rivista Internazionale di Scienze Sociali, CXIII(3), 377-412. Coccia, M. (2005a). Metrics to measure the technology transfer absorption: analysis of the relationship between institutes and adopters in northern Italy. International Journal of Technology Transfer and Commercialization, 4(4), 462-486. doi. 10.1504/IJTTC.2005.006699 Coccia, M. (2005b). Technometrics: Origins, historical evolution and new direction, Technological
Forecasting & Social Change, 72(8), 944-979. doi. 10.1016/j.techfore.2005.05.011
Coccia, M. (2005c). Economics of scientific research: origins, nature and structure, Proceedings of Economic Society of Australia.
Coccia, M. (2006). Classifications of innovations: survey and future directions. Working Paper Ceris del Consiglio Nazionale delle Ricerche, 8(2), 1-19. [Retrieved from].
Coccia, M. (2006a). Analysis and classification of public research institutes. World Review of Science, Technology and Sustainable Development, 3(1), 1-16.
Coccia, M. (2007). A new taxonomy of country performance and risk based on economic and technological indicators, Journal of Applied Economics, 10(1), 29-42.
Coccia, M. (2008). Science, funding and economic growth: analysis and science policy implications. World Review of Science, Technology and Sustainable Development, 5(1), 1-27. doi. 10.1504/WRSTSD.2008.01781
Coccia, M. (2008a). Spatial mobility of knowledge transfer and absorptive capacity: analysis and measurement of the impact within the geoeconomic space. The Journal of Technology Transfer, 33(1), 105-122. doi. 10.1007/s10961-007-9032-4
Coccia, M. (2008b). New organizational behaviour of public research institutions: Lessons learned from Italian case study. International Journal of Business Innovation and Research, 2(4), 402– 419. doi. 10.1504/IJBIR.2008.018589
Coccia, M. (2009). A new approach for measuring and analyzing patterns of regional economic growth: empirical analysis in Italy. Italian Journal of Regional Science- Scienze Regionali, 8(2), 71-95. doi. 10.3280/SCRE2009-002004
Coccia, M. (2009a). Measuring the impact of sustainable technological innovation, International Journal of Technology Intelligence and Planning, 5(3), 276-288. doi. 10.1504/IJTIP.2009.026749
Coccia, M. (2010). Public and private R&D investments as complementary inputs for productivity growth. International Journal of Technology, Policy and Management, 10(1/2), 73-91. doi. 10.1504/IJTPM.2010.032855
Coccia, M. (2010a). Foresight of technological determinants and primary energy resources of future economic long waves, International Journal of Foresight and Innovation Policy, 6(4), 225–232.
Coccia, M. (2010b). Energy metrics for driving competitiveness of countries: Energy weakness magnitude, GDP per barrel and barrels per capita. Energy Policy, 38(3), 1330-1339. doi. 10.1016/j.enpol.2009.11.011
Coccia, M. (2010c). Spatial patterns of technology transfer and measurement of its friction in the geo-economic space. International Journal of Technology Transfer and Commercialisation, 9(3), 255-267. doi. 10.1504/IJTTC.2010.030214
Coccia, M. (2010d). The asymmetric path of economic long waves, Technological Forecasting & Social Change, 77(5), 730-738. doi. 10.1016/j.techfore.2010.02.003
Coccia, M. (2010e). Democratization is the driving force for technological and economic change, Technological Forecasting & Social Change, 77(2), 248-264. doi. 10.1016/j.techfore.2009.06.007
Coccia, M. (2011). The interaction between public and private R&D expenditure and national productivity. Prometheus-Critical Studies in Innovation, 29(2), 121-130. doi. 10.1080/08109028.2011.601079
Coccia, M. (2012). Political economy of R&D to support the modern competitiveness of nations and determinants of economic optimization and inertia, Technovation, 32(6), 370–379. doi. 10.1016/j.technovation.2012.03.005
Coccia, M. (2012a). Evolutionary trajectories of the nanotechnology research across worldwide economic players. Technology Analysis & Strategic Management, 24(10), 1029-1050. doi. 10.1080/09537325.2012.705117
Coccia, M. (2012b). Evolutionary growth of knowledge in path-breaking targeted therapies for lung cancer: radical innovations and structure of the new technological paradigm. International Journal of Behavioural and Healthcare Research, 3(3-4), 273-290. doi. 10.1504/IJBHR.2012.051406
Coccia, M. (2012c). Converging genetics, genomics and nanotechnologies for groundbreaking pathways in biomedicine and nanomedicine. International Journal of Healthcare Technology and Management, 13(4), 184-197. doi. 10.1504/IJHTM.2012.050616
Coccia, M. (2012d). Driving forces of technological change in medicine: Radical innovations induced by side effects and their impact on society and healthcare. Technology in Society, 34(4), 271-283. doi. 10.1016/j.techsoc.2012.06.002
Coccia, M. (2013). What are the likely interactions among innovation, government debt, and employment? Innovation: The European Journal of Social Science Research, 26(4), 456–471. doi. 10.1080/13511610.2013.863704
Coccia, M. (2013a). The effect of country wealth on incidence of breast cancer. Breast Cancer Research and Treatment, 141(2), 225-229. doi. 10.1007/s10549-013-2683-y
Coccia, M. (2014). Path-breaking target therapies for lung cancer and a far-sighted health policy to support clinical and cost effectiveness. Health Policy and Technology, 1(3), 74-82. doi. 10.1016/j.hlpt.2013.09.007
Coccia, M. (2014a). Emerging technological trajectories of tissue engineering and the critical directions in cartilage regenerative medicine. Int. J. Healthcare Technology and Management, 14(3), 194-208. doi. 10.1504/IJHTM.2014.064247
Coccia, M. (2014b). Converging scientific fields and new technological paradigms as main drivers of the division of scientific labour in drug discovery process: the effects on strategic management of the R&D corporate change. Technology Analysis & Strategic Management, 26(7), 733-749, doi. 10.1080/09537325.2014.882501
Coccia, M. (2014c). Driving forces of technological change: The relation between population growth and technological innovation-Analysis of the optimal interaction across countries, Technological Forecasting & Social Change, 82(2), 52-65. doi. 10.1016/j.techfore.2013.06.001 Coccia, M. (2014). Socio-cultural origins of the patterns of technological innovation: What is the
likely interaction among religious culture, religious plurality and innovation? Towards a theory of socio-cultural drivers of the patterns of technological innovation, Technology in Society, 36(1), 13-25. doi. 10.23760/2421-7158.2017.004
Coccia, M. (2014e). Religious culture, democratisation and patterns of technological innovation. International Journal of Sustainable Society, 6(4), 397-418. doi. 10.1504/IJSSOC.2014.066771 Coccia, M. (2014f). Structure and organisational behaviour of public research institutions under
unstable growth of human resources, Int. J. Services Technology and Management, 20(4/5/6), 251–266. doi. 10.1504/IJSTM.2014.068857
Coccia, M. (2014g). Steel market and global trends of leading geo-economic players. International Journal of Trade and Global Markets, 7(1), 36-52, doi. 10.1504/IJTGM.2014.058714
Coccia, M. (2015). The Nexus between technological performances of countries and incidence of cancers in society. Technology in Society, 42, 61-70. doi. 10.1016/j.techsoc.2015.02.003 Coccia, M. (2015a). Patterns of innovative outputs across climate zones: the geography of
innovation, Prometheus. Critical Studies in Innovation, 33(2), 165-186. doi. 10.1080/08109028.2015.1095979
Coccia, M. (2015b). General sources of general purpose technologies in complex societies: Theory of global leadership-driven innovation, warfare and human development, Technology in Society, 42, 199-226. doi. 10.1016/j.techsoc.2015.05.008
Coccia, M. (2015c). Spatial relation between geo-climate zones and technological outputs to explain the evolution of technology. Int. J. Transitions and Innovation Systems, 4(1-2), 5-21. doi. 10.1504/IJTIS.2015.074642
Coccia, M. (2015d). Technological paradigms and trajectories as determinants of the R&D corporate change in drug discovery industry. International Journal Knowledge and Learning, 10(1), 29-43. doi. 10.1504/IJKL.2015.071052
Coccia, M. (2016). Asymmetric paths of public debts and of general government deficits across countries within and outside the European monetary unification and economic policy of debt dissolution. The Journal of Economic Asymmetries, 15, 17-31. doi. 10.1016/j.jeca.2016.10.003 Coccia, M. (2016a). Radical innovations as drivers of breakthroughs: characteristics and properties
of the management of technology leading to superior organizational performance in the discovery process of R&D labs. Technology Analysis & Strategic Management, 28(4), 381-395. doi. 10.1080/09537325.2015.1095287
Coccia, M. (2016). Problem-driven innovations in drug discovery: co-evolution of radical innovation with the evolution of problems, Health Policy and Technology, 5(2), 143-155. doi. 10.1016/j.hlpt.2016.02.003
Coccia, M. (2016c). The relation between price setting in markets and asymmetries of systems of measurement of goods. The Journal of Economic Asymmetries, 14(B), 168-178. doi. 10.1016/j.jeca.2016.06.001
Coccia, M. (2017). The source and nature of general purpose technologies for supporting next K-waves: Global leadership and the case study of the U.S. Navy's Mobile User Objective System, Technological Forecasting and Social Change, 116, 331-339. doi. 10.1016/j.techfore.2016.05.019
Coccia, M. (2017a). Optimization in R&D intensity and tax on corporate profits for supporting labor productivity of nations. The Journal of Technology Transfer, doi. 10.1007/s10961-017-9572-1 Coccia, M. (2017b). Varieties of capitalism’s theory of innovation and a conceptual integration with
leadership-oriented executives: the relation between typologies of executive, technological and socioeconomic performances. Int. J. Public Sector Performance Management, 3(2), 148–168. doi. 10.1504/IJPSPM.2017.084672
Coccia, M. (2017c). Sources of disruptive technologies for industrial change. L’industria –rivista di Economia e Politicaindustriale, 38(1), 97-120.
Coccia, M. (2017d). Sources of technological innovation: Radical and incremental innovation problem-driven to support competitive advantage of firms. Technology Analysis & Strategic Management, 29(9), 1048-1061. doi. 10.1080/09537325.2016.1268682
Coccia, M. (2017e). A Theory of general causes of violent crime: Homicides, income inequality and deficiencies of the heat hypothesis and of the model of CLASH, Aggression and Violent Behavior, 37, 190-200. doi. 10.1016/j.avb.2017.10.005
Coccia, M. (2017f). New directions in measurement of economic growth, development and under development, Journal of Economics and Political Economy, 4(4), 382-395.
Coccia, M. (2017g). Disruptive firms and industrial change, Journal of Economic and Social Thought, 4(4), 437-450.
Coccia, M. (2017h). The Fishbone diagram to identify, systematize and analyze the sources of general purpose Technologies, Journal of Social and Administrative Sciences, 4(4), 291-303. Coccia, M. (2018). A theory of the general causes of long waves: War, general purpose
technologies, and economic change. Technological Forecasting & Social Change, 128, 287-295 10.1016/j.techfore.2017.11.013
Coccia, M. (2018a). The relation between terrorism and high population growth, Journal of Economics and Political Economy, 5(1), 84-104.
Coccia, M. (2018c). Violent crime driven by income Inequality between countries, Turkish Economic Review, 5(1), 33-55.
Coccia, M. (2018d). The origins of the economics of innovation, Journal of Economic and Social Thought, 5(1), 9-28.
Coccia, M. (2018e). Theorem of not independence of any technological innovation, Journal of Economics Bibliography, 5(1), 29-35.
Coccia, M. (2018e). Theorem of not independence of any technological innovation, Journal of Social and Administrative Sciences, 5(1), 15-33.
Coccia, M. (2018f). Classification of innovation considering technological interaction, Journal of Economics Bibliography, 5(2), 76-93.
Coccia, M. (2018g). An introduction to the methods od inquiry in social sciences, Journal of Social and Administrative Sciences, 5(2), 116-126.
Coccia, M. (2018i). Growth rate of population associated with high terrorism incidents in society, Journal of Economics Bibliography, 5(3), 142-158.
Coccia, M. (2018j). Motivations of scientific research in society, Journal of Social and Administrative Sciences, 5(3), 196-216.
Coccia, M. (2018k). Functionality development of product innovation: An empirical analysis of the technological trajectories of smartphone, Journal of Economics Library, 5(3), 241-258.
Coccia, M., & Igor, M. (2018). Rewards in public administration: a proposed classification, Journal of Social and Administrative Sciences, 5(2), 68-80.
Coccia, M., & Bozeman, B. (2016). Allometric models to measure and analyze the evolution of international research collaboration. Scientometrics, 108(3), 1065-1084. doi. 10.1007/s11192-016-2027-x
Coccia, M., & Cadario, E. (2014). Organisational (un)learning of public research labs in turbulent context, International Journal of Innovation and Learning, 15(2), 115-129. doi. 10.1504/IJIL.2014.059756
Coccia, M., Falavigna, G., & Manello, A. (2015). The impact of hybrid public and market-oriented financing mechanisms on scientific portfolio and performances of public research labs: a scientometric analysis. Scientometrics, 102(1), 151-168. doi. 10.1007/s11192-014-1427-z Coccia, M., & Finardi, U. (2012). Emerging nanotechnological research for future pathway of
biomedicine. International Journal of Biomedical Nanoscience and Nanotechnology, 2 (3-4), 299-317. doi. 10.1504/IJBNN.2012.051223
Coccia, M., & Finardi, U. (2013). New technological trajectories of non-thermal plasma technology in medicine. International Journal of Biomedical Engineering and Technology, 11(4), 337-356. doi. 10.1504/IJBET.2013.055665
Coccia, M., Finardi, U., & Margon, D. (2012). Current trends in nanotechnology research across worldwide geo-economic players, The Journal of Technology Transfer, 37(5), 777-787. doi. 10.1007/s10961-011-9219-6
Coccia, M., & Rolfo, S. (2000). Ricerca pubblica e trasferimento tecnologico: il caso della regione Piemonte. In S. Rolfo (ed), Innovazione e piccole imprese in Piemonte, Franco Angeli Editore, Milano.
Coccia, M., & Rolfo, S. (2002). Technology transfer analysis in the Italian national research council, Technovation - The International Journal of Technological Innovation and Entrepreneurship, 22(5), 291-299. doi. 10.1016/S0166-4972(01)00018-9
Coccia, M., & Rolfo, S. (2007). How research policy changes can affect the organization and productivity of public research institutes, Journal of Comparative Policy Analysis, Research and Practice, 9(3) 215-233. doi. 10.1080/13876980701494624
Coccia, M., & Rolfo, S. (2010). New entrepreneurial behaviour of public research organizations: opportunities and threats of technological services supply, International Journal of Services Technology and Management, 13(1-2), 134-151. doi. 10.1504/IJSTM.2010.029674
Coccia, M., & Rolfo, S. (2013). Human resource management and organizational behavior of public research institutions, International Journal of Public Administration, 36(4), 256-268. doi. 10.1080/01900692.2012.756889
Coccia, M., & Rolfo, S. (2009). Project management in public research organization: Strategic change in complex scenarios. International Journal of Project Organisation and Management, 1(3), 235–252. doi. 10.1504/IJPOM.2009.027537
Coccia, M., & Wang, L. (2015). Path-breaking directions of nanotechnology-based chemotherapy and molecular cancer therapy, Technological Forecasting and Social Change, 94, 155–169. doi. 10.1016/j.techfore.2014.09.007
Coccia, M., & Wang, L. (2016). Evolution and convergence of the patterns of international scientific collaboration. Proceedings of the National Academy of Sciences of the United States of America, 113(8), 2057-2061. doi. 10.1073/pnas.1510820113
Daim, T.U., Byung-Sun, Y., Lindenberg, J., Grizzi, R., Estep, J., & Oliver, T. (2018). Strategic roadmapping of robotics technologies for the power industry: A multicriteria technology assessment, Technological Forecasting & Social Change, 131, 49-66. doi. 10.1016/j.techfore.2017.06.006
Dawkins, R. (1983). Universal Darwinism. In: Bendall, D.S. (1983). Evolution from Molecules to Man. Cambridge University Press, Cambridge.
Dodson E.N. (1985). Measurement of state of the art and technological advance, Technological Forecasting & Social Change, 27(2-3), 129-146. doi. 10.1016/0040-1625(85)90056-3
Dosi, G. (1988). Sources procedures and microeconomic effects of innovation, Journal of Economic Literature, 26(3), 1120-1171.
Erwin, D.H., & Krakauer, D.C. (2004). Evolution. Insights into innovation, Science, 304(5674), 1117-1119. doi. 10.1126/science.1099385
Farmer, J.D., & Lafond, F. (2016). How predictable is technological progress? Research Policy, 45, 647–665. doi. 10.1016/j.respol.2015.11.001
Farrell, C.J. (1993). A theory of technological progress. Technological Forecasting & Social Change, 44(2), 161-178. doi. 10.1016/0040-1625(93)90025-3
Faust, K. (1990). Early identification of technological advances on the basis of patent data, Scientometrics, 19(5-6), 473-480. doi. 10.1007/BF02020708
Fisher, J.C., & Pry, R.H. (1971). A simple substitution model of technological change, Technological Forecasting & Social Change, 3(2-3), 75-88. doi. 10.1016/S0040-1625(71)80005-7
Gherardi, M., & Rotondo, P. (2016). Measuring logic complexity can guide pattern discovery in empirical systems, Complexity, 21(S2), 397-408. doi. 10.1002/cplx.21819