Efficiency Ratios, Page 1
Efficiency Ratios and Community Bank Performance
Fred H. Hays
University of Missouri—Kansas City Stephen A. De Lurgio
University of Missouri—Kansas City Arthur H. Gilbert, Jr.
University of West Florida Abstract
This study develops a multivariate discriminant model to differentiate between low efficiency and high efficiency community banks (less than $1 billion in total assets) based upon the efficiency ratio, a commonly used financial performance measure that relates non-interest expenses to total operating income. The model includes proxies for the banking regulatory CAMELS rating variables including: the equity capital to total asset ratio, net charge-offs to loans, salaries to average assets, return on average assets, the liquidity ratio and the one year GAP ratio. The discriminant model is tested using data for 2006, 2007 and 2008. This includes periods of high performance as well as deteriorating industry conditions associated with the current financial crisis. The model’s classification accuracy ranges from approximately 88% to 96% for both original and cross-validation datasets.
Efficiency Ratios, Page 2 Introduction
The global economic and financial crisis initially affected large financial institutions like Citibank, Bank of America and Wachovia. As the effects spread throughout the U.S. economy, especially during the latter part of 2008, smaller institutions, including about 7,000 community banks (with under $1 billion in assets measured at the individual bank level rather than the bank holding company level) have been affected as well. Community banks are characterized by not only their relatively small size but also their focus on local banking markets rather than regional, national or global markets.
While subprime lending is frequently cited as a catalyst for current banking problems, community banks have been adversely affected by a decrease in liquidity in the overall financial system as well as deterioration in traditional residential real estate loans, commercial and
industrial loans and consumer loans including credit cards and student loans. Overall profitability in the banking industry has plunged from near record highs in 2006 to an industry loss of $32.1 billion in the fourth quarter of 2008, a -0.94% quarterly return on average assets. (FDIC
Quarterly Banking Report, Fourth Quarter 2008). For all of 2008 total industry profits were a mere $10.2 billion, a year-to-year reduction of almost 90%. Net interest margins for community banks fell to the lowest levels in 20 years.
Even before the recent financial crisis, the number of banks in the US declined by about half since 1980. Most of these were community banks. Predictions of their total demise have not materialized. Changes in technology, fierce competition and changing population demographics have not eliminated their presence. These forces do raise questions, however, about the ability of the least efficient to continue to operate.
This study looks at factors that differentiate efficient from inefficient community banks using the efficiency ratio, a popular tool used by bank financial analysts. The efficiency ratio measures the level of non-interest expense needed to support one dollar of operating revenue, consisting of both interest income and non-interest or fee income. The value of the efficiency ratio can be influenced by changes in salaries and benefits, labor productivity, technology, utilization of physical facilities especially branch offices along with many other factors including economies or diseconomies of scale.
The analytical framework in this study is based on the CAMELS rating system, a device created by federal banking regulators to assess the overall performance of commercial banks (Rose, 2010). The CAMELS acronym stands for Capital adequacy, Asset quality, Management, Earnings and Liquidity. Regulators created an additional measure, Sensitivity, to evaluate market risk associated with changing interest rates and other factors. This study uses proxy variables to represent each of these dimensions of bank performance.
This study also employs multiple discriminant analysis to investigate the differences between high efficiency and low efficiency banks based upon the level of the efficiency ratio. A model is developed that demonstrates substantial differences between high and low efficiency banks. The model is tested using year-end data for 2006, 2007 and 2008. This incorporates periods of high profitability as well as the negative effects of the financial crisis on recent periods including year-end 2008 when the brunt of the current crisis hit. This is the most recent data currently available.
Bank profitability as measured by return on average assets (ROAA) in Chart 1 was at near record levels from the late 1990’s until the end of 2006. Beginning in 2007 ROAA began to
Efficiency Ratios, Page 3 deteriorate rapidly. The decline in asset quality in 2008 forced banks to increase their provisions for loan losses which further reduced profits.
Chart 1
Source: FDIC Quarterly Banking Profile 4th Quarter 2008
Chart 2 depicts both the increase in non-current loans (loans 90 days or more past due) and net charge-offs (loans that have been deemed to be uncollectible). While non-current loan rates were considerably higher in the early 1990’s during the Savings and Loan and Banking Crises compared with the levels at year-end 2008, the level of actual charge-offs in 2008 exceeded the highest level in the early 1990’s.
Efficiency Ratios, Page 4 Chart 2
Source: FDIC Quarterly Banking Profile 4th Quarter 2008
The efficiency ratio is calculated by dividing overhead expenses by the sum of net
interest income and non-interest or fee income. It is a measure of how effective a bank is in using overhead expenses including salaries and benefit costs and occupancy expenses as well as other operating expenses in generating revenues. Other things being equal, a decrease in the efficiency ratio is viewed as a positive while a rising efficiency ratio is generally undesirable. The
efficiency ratio can rise temporarily when a bank expands facilities. For example, opening a new branch immediately adds to overhead costs including staffing. New loans may not be
immediately forthcoming. Fee income may be slow developing as well. As a result there can be a short-term spike in the efficiency ratio.
Chart 3 shows the differences between the efficiency ratios for community banks with assets less than $1 billion and larger regional and national banks. The efficiency ratio for community banks has risen by almost 10% since the late 1990’s. The increase has been particularly notable since 2005. By contrast, efficiency ratios for banks in excess of $1 billion in assets are actually lower at year-end 2008 than in 1998. Among other things, this may reflect the growing consolidation of large banking organizations during this period as organizations such as Nations Bank and Bank of America merged. It may also include the effects of merging banks with non-bank financial institutions including insurance companies (such as Traveler’s merging
Efficiency Ratios, Page 5 with Citicorp) that became possible after passage of the Gramm Leach Bliley Act in late 1999. The economies of scope and scale may reduce average costs and result in lower efficiency ratios.
Efficiency ratios are subject to controls of overhead expenses as implemented by senior management and the board of directors. Economic theory assumes that managers will seek to reduce overhead expenses in an attempt to maximize profits. Edwards (1977) offers an opposing view that bank management may choose to maximize utility rather than profitability. This expense preference theory has been developed in bank management literature. Williamson (1963) notes that management may increase “staff expenditures, managerial emoluments and discretionary profits” rather than focus strictly on maximizing profits. If management prefers larger staffs or more locations, this is normally reflected in the short term in higher efficiency ratios. Such decisions may or may not contribute to long-run profitability.
Chart 3
Source: FDIC Quarterly Banking Profile 4th Quarter 2008
Review of Literature
Literature on community bank performance, especially related to efficiency and bank strategy continues to expand. The following discussion summarizes some research in this area over the past decade. Wall (1985) examined small and medium sized banks from the early 1970’s until deregulation occurred in the early 1980’s. He found that profitable banks had lower
Efficiency Ratios, Page 6 interest and non interest expense than less profitable banks. In addition, the more profitable banks had lower cost of funds, greater use of transactions deposits, more marketable securities and higher capital levels.
Gup and Walter (1989) found that consistently profitable small banks stressed basic banking with low cost funds and high quality investments. The study examined banks from 1982 to 1987 during the early stages of bank deregulation. During this period there were considerable differences between regions due to declining energy, real estate and commodity prices. High performance banks during this period made higher quality loans, held proportionately more capital, invested more in securities (especially long-term) and relied on lower cost funding sources compared with the average small bank.
Zimmerman (1996) examined community bank performance in California during the early 1990’s, a period of slow recovery for these institutions. Excessive reliance on real estate lending caused deterioration in asset quality which reduced overall profitability. Lack of geographic diversification further compounded community bank performance.
Two different studies by Bassett and Brady (2001; 2002) examined recent performance of community banks. The 2001 study found that many small banks from 1985-2000 vanished through mergers and acquisitions. Increased competition with stock, bond and mutual fund investments may have weakened the competitive position of small banks. These community banks, nevertheless, were able to compete effectively against larger banks due in part to superior knowledge of local loan markets combined with a reluctance of customers to bank with out-of-area institutions. Bassett and Brady’s (2002) study found that small banks grew more rapidly than large banks from 1985-2001 with profitability remained at a high level. While interest costs increased, this was more than offset by higher returns on earning assets.
Gilbert and Sierra (2003) used the Federal Reserve System for Estimating Examination Ratings (SEER) surveillance system to estimate the probability of failure for community banks (which they define as less than $1 billion in assets) versus large banks (with assets greater than $1 billion). The failure probability declined for both groups during the 1990’s. The risk of failure since about 1997 rose slightly for community banks and as of 2003 was about 4 basis points higher than for large banks.
Myers and Spong (2003) examined community bank growth in the 10th Federal Reserve District (Kansas City) with an emphasis on economic conditions in slower growing markets. These slower growing markets presented problems in loan quality as well as staffing including senior management and directors. Community banks in low growth markets experienced higher overhead costs relative to income than banks in higher growth markets.
DeYoung, Hunter and Udell (2003) provided an extensive investigation of community bank performance commencing in the early 1970’s. They concluded that while many community banks have left the industry in the past three decades, many more inefficient banks must still exit in order for those remaining to be competitive with their larger bank counterparts.
Critchfield, Davis, Davison, Gratton, Hanc and Samolyk (2005) in a study of past, present and future community bank performance conducted for the FDIC concluded that
community banks continue to be of interest because 1) they still constitute over 90% of all banks, 2) they are economically important to small business and agricultural lending and 3) they
represent a disproportionately large percentage of FDIC failure costs.
Efficiency Ratios, Page 7 Methodology
This study examines the performance of low efficiency vs. high efficiency community banks using data from year-end 2006-2008. High vs. low efficiency is defined in terms of the efficiency ratio, a commonly used measure of bank performance. The efficiency ratio (ER) is non-interest expenses divided by the sum of interest income and non-interest income (fee
income). A higher ratio value indicates relative inefficiency while a lower value indicates greater efficiency. Inefficiency can be the result of overstaffing, excessive salaries and benefits,
investments in new branches that have yet to become profitable along with other reasons. In this study we use a “polar extremes approach” that defines high and low efficiency banks while eliminating the middle group. For additional discussion of this approach to discriminant analysis see Hair et.al. (1998).
Efficient banks are defined as those with efficiency ratios (ER) less than 51 while inefficient banks are those with efficiency ratios greater than 81. This corresponds to one standard deviation below and above the mean ER of 66.
Community banks are defined in this study as banks with total assets less than or equal to one billion dollars. This cutoff value is consistent with many current studies of community bank performance. To assure that special purpose banks such as credit card banks are excluded from the study, only banks with loan to deposit ratios greater than 25% and less than 125% are included. To eliminate problems associated with de novo (newly chartered) banks, an additional constraint that banks be chartered prior to December 31, 2002 was applied.
After applying the previous screening parameters, the result is 739 low efficiency banks and 674 high efficiency banks, the universe of U.S. banks that meet the screening criteria described above. Data are obtained from a relational database available by subscription from SNL Financial. The data are based on quarterly reports by commercial banks and bank holding companies filed with the Federal Deposit Insurance Corporation and published in the FDIC Reports of Condition and Income.
The Model and Results
The CAMELS rating system was developed by federal banking regulators as a composite measure of overall commercial bank performance. Bank management and the board of directors receive an aggregate performance score on a scale of 1-5 where 1 is the highest rating and 5 is the lowest. Banks rated 4 or 5 are considered “problem banks” and are severely limited in their operations by their respective regulators. These ratings may require obtaining additional capital, limitations on interest rates paid on deposit liabilities, limitations on dividend distributions, etc. Under the prompt corrective action requirements of the FDIC Improvement Act of 1991, banks in the problem bank categories must respond quickly or face closure (Rose, 2010).
Banks are also evaluated by federal or state regulators on individual performance elements including capital adequacy, asset quality, management, earnings, liquidity and sensitivity to market fluctuations (especially interest rate risk exposure). Deficiencies are reported to management and the board of directors for corrective action. These ratings are not, however, reported to the public because of concern that such knowledge might precipitate excessive withdrawals of bank deposits creating a “run” on a troubled bank and perhaps impairing public confidence in the overall banking system (Lopez, 1999).
Efficiency Ratios, Page 8 The CAMELS variables can be easily approximated. Such proxies are common in
commercial banking literature. Of the six CAMELS variables, the measurement of
“management” is the most subjective since it is normally evaluated and assigned a score by the bank examination staff. In our study we use the ratio of salaries and benefits to average assets as a proxy for management since salaries and benefits are generally the largest non-interest expense element of bank overhead and are also controllable by management.
The final linear discriminant model contains the following six CAMELS variables: Z= α + β1 E2TA +β2 NCO2L + β3 SalAA + β4 ROAA + β5 LiqR + β6 1yrGAP (1) Where:
α = Constant
E2TA= Equity Capital to Total Assets (Capital) NCO2L= Net Loan Charge-offs to Loans (Asset quality) SalAA= Salaries and benefits to Avg. Assets (Management) ROAA= Return on Average Assets (Earnings) LiqR= Liquidity ratio (Liquidity)
1yrGAP= GAP ratio, 1 year (Sensitivity to market changes)
These variables are listed in order of relative importance based on the structure matrix presented in Table 4 with Return on Average Assets (ROAA) representing the most important. The first four variables retain the same relative ranking in all three years; The liquidity ratio (LiqR) is ranked fifth in 2006 but is ranked last in 2007 and 2008. Based on banking theory and empirical studies these variables appear reasonable discriminators between low efficiency and high efficiency banks. For example, one would intuitively expect that a low efficiency bank would have by definition higher average overhead costs associated with overstaffing, low worker productivity, high investments in bricks and mortar facilities, older technology, etc.. This cost disadvantage would be expected to lower profits as measured by return on average assets compared with high efficiency banks. Indeed, the mean ROAA for low efficiency banks ranges between -.286% to .3245 while the ROAA for high efficiency banks ranges from 1.0% to 1.726%. (Table 1)
An important factor affecting profitability is the ratio of salaries and benefits to average assets (SalAA). Low efficiency banks have an average SalAA ratio as high as of 2.361% in 2007 which is substantially higher than the 1.291% for high efficiency banks in 2006. (Table 1)
Asset quality is an important issue for most banks. While it is seldom profitable (or even desirable) to totally eliminate credit risk, it is important that this risk be properly managed and controlled within reasonable limits. A proxy for asset quality is the loan charge-off to loan ratio. Charge-offs occur when management deems a loan to be uncollectible. Sometimes regulators pressure banks to write down loans when credit conditions deteriorate. As rule of thumb, a typical charge-off ratio based on historical averages is at or less than one percent. Both groups are substantially below that benchmark target. Low efficiency banks have a value of about .65% while high efficiency banks are even lower at .23%. (Table 1)
Banking regulators monitor the capital positions of banks quite closely. Since banks, by their nature, are highly leveraged institutions, a decrease in the ratio of equity capital to total assets would also reduce the cushion that banks have to absorb credit or market related losses.
Efficiency Ratios, Page 9 When the capital ratio declines, the risk that the deposit insurance fund might be required to pay insured depositors rises. This creates a built-in tension between the desire of shareholders to use leverage to magnify returns on equity vs. the desire of regulators to insure the safety and
soundness of the banking system. During the period from 2006-2008 low efficiency banks on average held smaller percentages of capital than did higher efficiency banks.
Liquidity is the ability of a bank to provide cash in the face of unanticipated withdrawals of deposits or for other reasons. Banks earn nothing on assets held as cash. Other assets such as reserves held at the Federal Reserve have historically not earned a return (although recent changes allow the Fed to pay a small positive return on reserve balances). Banks hold secondary reserves in the form of highly marketable securities, in particularly U.S. Treasury bills, notes and bonds.
Banks are subject to the vagaries of interest rate changes. Since bank deregulation commenced in 1980 with passage of the Depository Institutions Deregulation and Monetary Control Act (DIDMCA), banks have moved toward asset/liability management systems. These generally identify and track rate sensitive assets and liabilities. These are assets and liabilities that either mature or reprice within a given time period. If a bank has more rate sensitive assets than liabilities and interest rates rise, a bank’s net interest margin would improve; if rates fall, the bank’s net interest margin would shrink. GAP management techniques that manage the
relationship between rate sensitive assets and rate sensitive liabilities are utilized to manage the bank’s interest rate risk. While some banks use a shorter time interval such as one quarter, because of data constraints a one year GAP ratio is incorporated in the model.
Classification Accuracy
Ultimately any discriminant model is judged by its ability to correctly classify
observations into their correct groups. The model discussed above correctly classifies 92.7% in 2006, 96.2% in 2007 and 88.1% in 2008 [Table 2]. The 2008 results appear to be affected by overall deteriorating economic and financial conditions as both high efficiency and low efficiency banks suffered declining asset quality.
This study uses the “hold-one out” cross validation procedure contained within SPSS 16.0 which sequentially withholds an observation and repeatedly refits the model. The
classificatory accuracy of the cross-validation approach is virtually the same as with the original dataset. [Table 2]
Two observations should be made about the classification results. First, while the group sizes are not precisely the same (n low=739 and n high= 674) they are approximately the same
percentages (52.3% vs. 47.7%). Second, the overall classification accuracy is so high (from about 88% to over 96%) that traditional measures such as proportional chance criterion and Press’s Q overwhelmingly confirm the discriminatory power of the model.
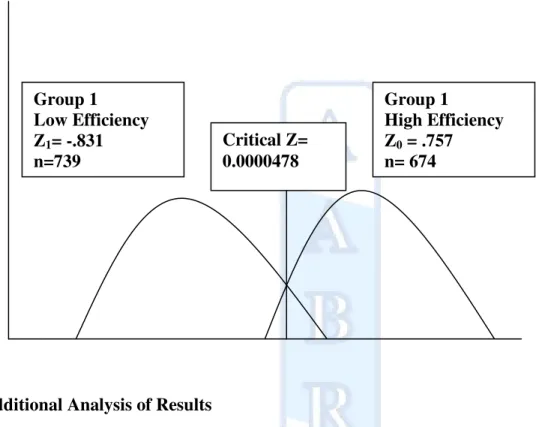
The critical Z value or optimal cutting score for the discriminant function represents the dividing line separating the two groups. A Z score can be calculated for every bank in the study based on information on its values for all six discriminant variables. This individual score can then be compared to the critical Z value to determine into which group the bank belongs. The formula for the critical Z score for unequal group sizes is Zcu = (nAZB+nBZA)/(nA + nB) which ZA
and ZB are the group centroids and nA and nB are the number of banks in each group.1 The critical
Z score for our model is .0000478. [(-.831*674 + .757*739)/1413] The separation between groups can be seen in Exhibit 1 using 2006 data which displays a plot of group centroids.
Efficiency Ratios, Page 10 Exhibit 1
Plot of Group Centroids 2006 Data
Additional Analysis of Results
Table 3 contains results of tests of equality of group means for variables related to high vs. low efficiency banks for 2006-2008. The top three ranked variables are respectively 1) Return on Average Assets (ROAA), 2) Salary and Benefit Expense to Average Assets (SalAA) and 3) Equity to Average Assets (E2TA) as indicated by the structure matrix in Table 4.
The one year GAP measure was not statistically significant in any of the periods. Moreover, the GAP ratio was ranked fifth or sixth in each period based on the structure matrix data in Table 4. The equity to asset ratio (E2A) shows a statistically significant difference between low and high efficiency banks for 2006 and 2007. For 2008, however, the differences are not significant. The liquidity ratio (LR) is statistically different in 2006 but not in 2007 or 2008.
Wilks’ Lambda and χ2 test statistics contained in Table 5 indicate the overall model is highly significant at the ρ=.000 level in all three periods from 2006-2008.
Conclusion
This study uses a commonly used measure of bank performance, the efficiency ratio, as a basis for identifying low versus high efficiency banks. It utilizes a linear multivariate
Group 1 Low Efficiency Z1= -.831 n=739 Group 1 High Efficiency Z0 = .757 n= 674 Critical Z= 0.0000478
Efficiency Ratios, Page 11 discriminant model to identify variables that differentiate between these two groups. In addition to profitability as measured by return on average assets, other important variables include salaries to average assets, the liquidity ratio, the equity capital to asset ratio, loan charge-offs to loans and a one year GAP measure.
Community banks that desire to survive and thrive should pay attention to these variables. Most of these are strategic variables over which management and the board of directors have considerable control. Staffing issues, decisions about deposit mix, credit standards, and quality and branching decisions are within the scope of managerial decision-making. While the liquidity ratio is partly determined by exogenous factors such as market loan demand, competition and the stage of the business cycle, it is controllable within limits. The future for community banks favors those that are sufficiently adept at understanding operating efficiency. The ability to compete with larger institutions with greater resources depends on it. As the banking industry recovers from the current economic and financial crisis, attention must be paid to efficiency as a potential strategic advantage.
References
Avery, R. B. & Samolyk, K. A. (2003). “Bank Consolidation and Small Business Lending: The Role of Community Banks”, Federal Deposit Insurance Corporation Working Paper 2003-05, 1-45.
Bassett, W. F. & Brady, T. F. (2001). “The Economic Performance of Small Banks, 1985-2000,” Federal Reserve Bulletin, Board of Governors of the Federal Reserve System, 719-728. Bassett, W. F. & Brady, T. F. (2002), “What Drives Persistent Competitiveness of Small
Banks?” Working Paper, Board of Governors of the Federal Reserve System, 2002-2002-28, 1-43.
Critchfield, T., Davis, T., Davison, L., Gratton, H., Hanc, G., & Samolyk, K. (2005).
“Community Banks: Their Recent Past, Current Performance, and Future Prospects”, FDIC Banking Review,
http://www.fdic.gov/bank/analytical/banking/2005jan/article1.html
Deyoung, R., Hunter, W.C. & Udell, G.F. (2003). “The Past, Present and Probable Future for Community Banks”, Federal Reserve Bank of Chicago, WP-2003-14.
Deyoung, R., & Rice, T. (2004). “Non-interest Income and Financial Performance in U.S. Commercial Banks”, The Financial Review, vol. 39.
Edwards, F. (1977). “Managerial Objectives in Regulated Industries: Expense-Preference Behavior in Banking”, Journal of Political Economy, Vol. 85, 147-162.
Federal Deposit Insurance Corporation (2008), Quarterly Banking Report, Fourth Quarter. Fraser, D.R., Gup, B.E., & Kolari, J.W. (2001). Commercial Banking: The Management of Risk,
2e, THOMSON: Southwestern.
Gilbert, R.A., Meyer, A.P., & Vaughan, M.D. (2003). “CanFeedback from the Jumbo-CD Market Improve Bank Surveillance?”, Working Paper 2003-041A, Federal Reserve Bank of St. Louis.
Gilbert, R.A., & Sierra, G.F. (2003). “The Financial Condition of U.S. Banks: How Different Are Community Banks?”, Federal Reserve Bank of St. Louis Review, 43-56.
Gup, B.E., & Walter, J.R. (1989). “Top Performing Small Banks: Making Money the Old-fashioned Way”, Economic Review, Federal Reserve Bank of Richmond, 23-35.
Efficiency Ratios, Page 12 Hair, J.E., Jr., Anderson, R.E., Tatham, R.L., & Black, W.C. (1998). Multivariate Data Analysis
with Readings, 5th ed. (Saddle River NJ: Prentice-Hall).
Hannan, T. (1980). “Expense-Preference Theory in Banking: A Reexamination” Journal of Political Economy, Vol. 87, 891-895.
Hannan, T. & Mavinga, F. (1980). “Expense Preference and Managerial Control: The Case of the Banking Firm”, The Bell Journal of Economics, Vol. 11, No.2, 671-682.
Koch, T., & MacDonald, S.S. (2003). Bank Management, 5e, THOMSON: Southwestern. Lopez, Jose (1999), “Using CAMELS Ratings to Monitor Bank Conditions”, FRBSF Economic
Letter.
Myers, F., & Spong, K. (2003). “Community Bank Performance in Slower Growing Markets: Finding Sound Strategies for Successs”. Federal Reserve Bank of Kansas City Financial Industry Perspectives, 15-30.
Olson, M. (2003). “Community Bank Performance in the Twenty-first Century” . Speech at the Conference on “Whither the Community Bank?” Federal Reserve Bank of Chicago, March 13, 2003.
http://www.federalreserve.gov/boarddocs/speeches/2003/20030313/default.htm Rose, P. & Hudgins, S. (2010), Bank Management and Financial Services, 8e,
McGraw-Hill/Irwin.
Williamson, O. (1963). “Managerial Discretion and Business Behavior”, American Economic Review, Vol. 53, 1032-1057.
Zimmerman, G. C. (1996). “Factors Influencing Community Bank Performance in California”, Economic Review, Federal Reserve Bank of San Francisco, 26-42.
Table 1
Descriptive Statistics
ROAA SalAA E2TA NCO2L LiqR 1yrGap
Low
Efficiency 06
Efficiency Ratios, Page 13 High Efficiency 06 1.726 1.291 12.003 .230 24.316 -23.735 Low Efficiency 07 .004 2.361 10.953 .447 24.136 -25.029 High Efficiency 07 1.600 1.295 12.062 .335 23.714 -24.360 Low Efficiency 08 -.286 1.748 10.400 .650 22.657 -29.301 High Efficiency 08 1.100 1.480 11.703 .620 23.937 -29.202 Table 2 Classification Results 2006-2008 Predicted Membership
2006 (year-end) Low Efficiency High Efficiency Total Actual Membership Low Efficiency 697 42 739 (94.3%) (5.7%) High Efficiency 61 613 674 ( 9.1%) (90.9%) Ungrouped 6 1 7 (94.3%) (5.7%)
Original group correctly classified ( 92.7%) Cross-validated Data Low Efficiency 697 42 739 (96.3%) (3.7%) High Efficiency 26 648 674 Total (0.4%) (99.6%) 1413 Cross validated group
correctly classified
(92.6%)
Predicted Membership
2007 (year-end) Low Efficiency High Efficiency Total Actual Membership
Low Efficiency 712 27 739
(96.3%) (3.7%)
High Efficiency 26 648 674
Efficiency Ratios, Page 14 Ungrouped 7 0 7 (100.0%) (0.00%) Original correctly classified (96.2%) Cross-validated Data Low Efficiency 711 28 739 (96.8%) (3.2%) High Efficiency 27 647 674 Total (4.0%) (96%) 1156
Cross validated group correctly classified
(96.1%)
Table 3
Tests of Equality of Group Means
Variable Wilks’ Λ06
F06 Sig06 Wilks’Λ07 F07 Sig07 Wilks’ Λ08
F08 Sig08
ROAA06 .71 574.75 .00 .73 535.32 .00 .88 191.30 .00
NCO2L06 1.00 5.18 .02 1.00 3.65 .06 1.00 .15 .70
Predicted Membership
2008 (year-end) Low Efficiency High Efficiency Total Actual Membership Low Efficiency 682 57 739 (92.3%) (7.7%) High Efficiency 111 563 674 (16.5%) (83.5%) Ungrouped 7 0 7 (100.0%) (0.00%) Original correctly classified ( 88.1%) Cross-validated Data Low Efficiency 682 57 739 (92.3%) (7.7%) High Efficiency 112 562 674 Total (16.6% ) (83.4%) 1413
Cross validated group correctly classified
Efficiency Ratios, Page 15 SalAA06 .93 99.48 .00 .94 94.77 .00 .92 130.63 .00 E2TA06 .99 14.87 .00 .99 19.87 .00 .98 28.93 .00 LiqR06 1.00 4.58 .03 1.00 .23 .63 1.00 1.929 .17 1yrGap06 1.00 .003 .96 1.00 .54 .46 1.00 .013 .91 Table 4 Structure Matrix 2006-2008 Variable 2006 2007 2008 ROAA06 .804 .771 .582 SalAA06 -.335 -.324 -.481 E2TA06 .129 .148 .226 NCO2L06 -.076 -.064 - .016 LiqR06 -.072 -.016 .058 1yrGap06 -.002 .024 .024 Table 5 Wilks’ Lambda 2006-2008 Year Wilks’ Λ Chi-square Degrees of Freedom Significance 2006 .613 687.6 6 .000 2007 .610 695.4 6 .000 2008 .714 474.2 6 .000 Table 6 Functions at Group Centroids 2006-2008 Code 2006 2007 2008
High Efficiency Ratio (0) .757 .763 .605