DOI: 10.5897/AJBM11.1853
ISSN 1993-8233 © 2013 Academic Journals http://www.academicjournals.org/AJBM
African Journal of Business Management
Review
How to get correct result from weighted average cost of
capital (WACC) formula and avoid a common pitfall in
calculating WACC: An analysis of Miller (2009) and
Pierru’s (2009) articles
Farid Habibi Tanha
1* and Morteza Foroutan
21
Graduate School of Business, Universiti Kebangsaan Malaysia (UKM), 43600 Bangi Selongor, Malaysia.
2Industrial and Systems Engineering, San Jose State University, California, USA.
Accepted 4 October, 2011
Calculating the cost of capital has been always a key issue in financial management. One way to calculate cost of capital is using the weighted average cost of capital (WACC) formula which has been presented by Modigliani and Miller. Recently, validity and correctness of WACC have been questioned by an article titled “The weighted average cost of capital is not quite right” (Miller, 2009), so that some researchers such as Axel PierruandBenjamin Bade tried to revalidate and defend the correctness of WACC by their articles. In this article, at first, we criticize the Miller’s article then demonstrate the weaknesses of Axel’s method for proving WACC; and finally, we show the correct conclusion of WACC by employing the correct assumptions.
Key words: Weighted average cost of capital (WACC), cost of capital, cash flow, discount rate.
INTRODUCTION
Sequential relation between financial terms has made it essential for researchers and experts to calculate each item in this sequence precisely and correctly. For correctness of each term is achieved if and only if previous terms have been calculated correctly. Therefore, miscalculating each term can result in wrong decision making by financial managers. To have correct calculations, one has to know the distinctions between different descriptions presented for financial terms. Based upon the assumptions of the question, one must employ the formula that is resulted from the description that matches the implicit and explicit assumptions of the question. In this article, we will show that some efforts, for and against the standard weighted average cost of capital (WACC), failed to present a correct conclusion due to the lack of knowing the distinctions between
different formulas representing WACC.
A CRITIC ON MILLRE’S ARTICLE
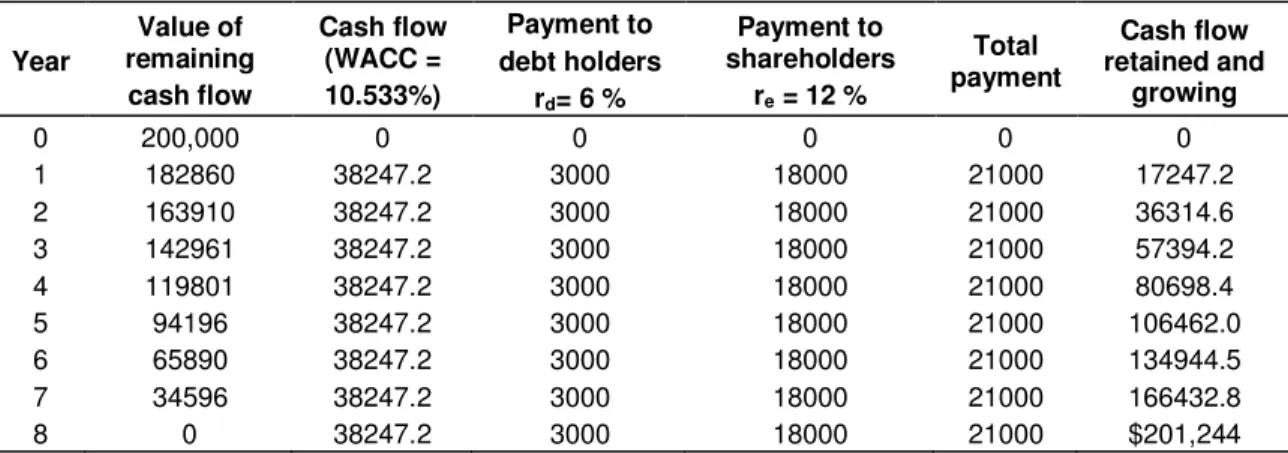
In his article, Miller (2009) tries to question the adequacy of the amount of cash flow calculated by WACC formula. As a result, he tries to correct the formula and finishes his article by presenting a modified formula. By investigating project’s cash flows during its life-cycle, it can be obviously proved that revised WACC formula presented by Miller is not valid. For summing up cash flows, the results were retained. As a result, the suggested WACC do not show the project’s minimum rate of return which has always been the start point to make a decision, whether or not to accept a project. In Table 1, the effect
Table 1. Project’s life cycle. Year Value of remaining cash flow Cash flow (WACC = 10.533%) Payment to debt holders rd= 6 % Payment to shareholders re = 12 % Total payment Cash flow retained and growing 0 200,000 0 0 0 0 0 1 182860 38247.2 3000 18000 21000 17247.2 2 163910 38247.2 3000 18000 21000 36314.6 3 142961 38247.2 3000 18000 21000 57394.2 4 119801 38247.2 3000 18000 21000 80698.4 5 94196 38247.2 3000 18000 21000 106462.0 6 65890 38247.2 3000 18000 21000 134944.5 7 34596 38247.2 3000 18000 21000 166432.8 8 0 38247.2 3000 18000 21000 $201,244
of expanding the project’s life-cycle, while keeping the other assumptions expressed in Miller’s article un-changed, is shown.
The second column shows the economic value of the project based upon the project’s future cash flows and can be calculated using the following formula:
For instance, for T=0 : ,
for T=1: . The third
column shows the cash flows needed as payments to shareholders and debt holders. It is equal to the amount calculated by Miller’s method and has been calculated as follows:
The forth column shows the annual payments to debt holders. Regarding to the investment of $ 50000 and the rate of return of 6% we have:
50,000 × 0.06 = 3000
The fifth column shows the annual payments to shareholders. Regarding to the investment of $ 150000 and the rate of return of 12% we have:
150,000 × 0.12 = 18000
The sixth column is calculated by adding columns 4 and 5. The seventh column shows the remaining cash flows after subtracting the project’s total payments (share-holders and debt (share-holders) which have an annual growth of 10.533%. For instance: For T=1; 38,247.23 – 21,000 = 17,247.2 For T=2; 38,247.23 – 21,000 + (17,247.2) × (1+0.10533) = 36,314.6 For T=3; 38,247.23 – 21,000 + (36,314.6) × (1+0.10533)2 = 57394.2
Regarding the assumptions presented in the question, we know that the company has to have annual payments of 6 and 12% to its debt holders and shareholders based upon their investments. At the end of the project, the company must return their total amount of investment which is $ 200000. Using Table 1, we can find out that the remaining amount in the 8th year, after subtracting payments to shareholders and debt holders, according to the seventh column is equal to $ 201244which is more than the first investment.
Since WACC is a rate of return which makes the NPV=0, we understand that WACC =10.533% shows an unreal rate of return. It has to be noted that this example has been applied in order to show that Miller’s suggested modified WACC formula does not yield correct results, but still, his correct question is laid without answer, which we will deal with comprehensively after we criticize Pierru’s article in the next part.
A CRITIC ON PIERRU’S ARTICLE
In his article titled “The weighted average cost of capital is not quite right: A comment”, Pierru (2009a) discovers that Miller’s suggested formula is wrong. Using two alternative assumptions, he tried to answer Miller’s challenging question. In his first alternative, he assumes that the project has a constant WACC during its life-cycle and in his second alternative, he assumes that the project
Table 2. Debt holders and shareholders' return. wd (weight of debt) ($) we (weight of equity) ($) rd (rate of return to debt holders) (%) re (rate of return to equity holders) (%) Tax 50,000 150,000 6 12 0
Table 3. Payment to debt holders and residual cash flow. Year Payment to debt
holders NPV of (payment to debt holders) Equity residual cash flow NPV of (equity residual cash flow) 1 7293.5 6880.7 30880.4 27571.8 2 7486.7 6663.1 30687.2 24463.6 3 7700.2 6465.2 30473.7 21690.6 4 7936.1 6286.1 30237.8 19216.7 5 8196.8 6125.1 29977.1 17009.8 6 8484.8 5981.4 29689.1 15041.4 7 8803.1 5854.6 29370.8 13285.9 8 9154.8 5743.8 29019 11720.3 50000 150000
Table 4. Project life-cycle of investors in the firm, debt, and equity holders based on Pierru’s article at constant WACC.
Year Value of remaining
cash flow Cash flow (WACC = 10%) Amount of outstanding debt Payment to debt holders Equity residual cash flow Equity value 0 200,000.0 0.0 50,000.0 0.0 0.0 150,000.0 1 182,511.2 37488.8 45,627.8 7,372.2 30,116.6 136,883.4 2 163,273.5 37488.8 40,818.4 7,547.1 29,941.7 122,455.1 3 142,112.0 37488.8 35,528.0 7,739.5 29,749.3 106,584.0 4 118,834.5 37488.8 29,708.6 7,951.1 29,537.7 89,125.8 5 93,229.1 37488.8 23,307.3 8,183.9 29,304.9 69,921.8 6 65,063.2 37488.8 16,265.8 8,439.9 29,048.9 48,797.4 7 34,080.7 37488.8 8,520.2 8,721.6 28,767.2 25,560.5 8 0.0 37488.8 0.0 9,031.4 28,457.4 0.0
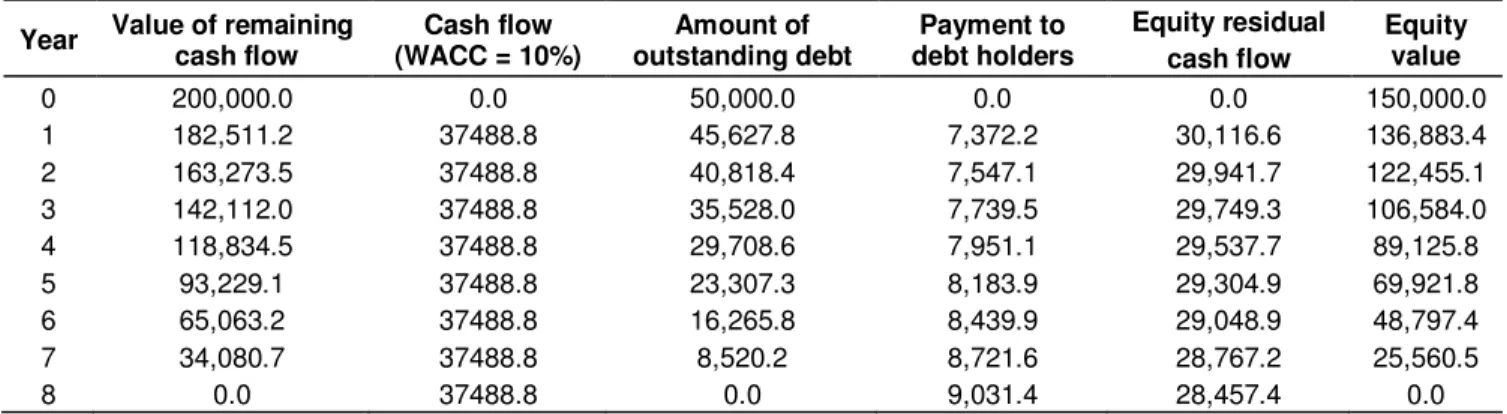
has constant equity and debt cash flows. It should be noted that we do not consider the second assumption as it is not practically applicable.
On one hand, as it is shown before, the nonlinear WACC suggested by Miller is not correct and on the other hand, Pierru’s method to answer Miller’s question is completely wrong. The reason is hidden in the first table presented in the Pierru’s article which has the assumptions that WACC formula presents 10.5%, based upon it, the cash flow will be equal to $ 38173.86. This amount can provide needed money as payment to shareholders and debt holders after the project is finished. In fact, during the project’s life-cycle, debt holders and shareholders annually receive the amounts of $ 3000 and 18000 (according to 6 and 12%) and also receive a portion of their invested money annually (Table 2). The sum of annual payments during the project’s life-cycle is exactly equal to original investments plus
investments’ profit (based on predetermined rates of 6 and 12% for debt holders and shareholders).
Therefore, in columns 4 and 5 of Pierru’s first table (payment to debt holders and equity residual cash flow) total value of payments in t=0 is $ 50000 for debt holders with the discount rate of 6% and $ 150000 for shareholders with the discount rate of 12%. According to Table 3, Pierru concluded that standard WACC is always valid while generalizing one example without considering other conditions and assumptions cannot be used in order to support or deny a theory. To show that Pierru's method is wrong, we assume that there is a non-zero tax. According to Miller's example, if we assume tax=1/3, then, project's WACC will be equal to 10% and will have a cash flow of 38488.8 accordingly. Now, according to Pierru's first table, we present Table 4. The second column has been calculated in the same way stated for Table 1.
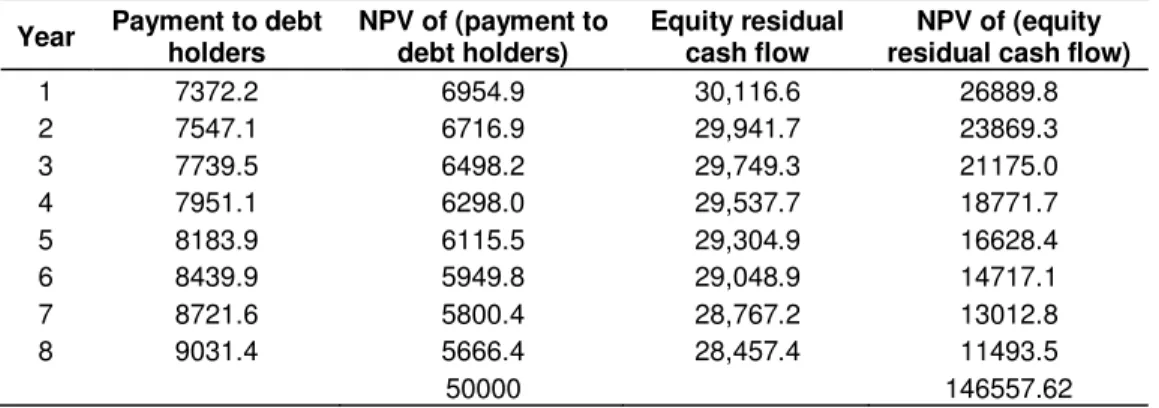
Table 5. NPV for debt holders and shareholders based on return.
Year Payment to debt
holders NPV of (payment to debt holders) Equity residual cash flow NPV of (equity residual cash flow)
1 7372.2 6954.9 30,116.6 26889.8 2 7547.1 6716.9 29,941.7 23869.3 3 7739.5 6498.2 29,749.3 21175.0 4 7951.1 6298.0 29,537.7 18771.7 5 8183.9 6115.5 29,304.9 16628.4 6 8439.9 5949.8 29,048.9 14717.1 7 8721.6 5800.4 28,767.2 13012.8 8 9031.4 5666.4 28,457.4 11493.5 50000 146557.62
As it is assumed that debt ratio is 1/4, and this ratio is constant all over the project, the forth column is calculated by multiplying the second column by 1/4 (debt ratio). The fifth column is equal to annual profit plus original investment minus the needed amount of money to maintain the debt ratio for the next year. (1/4 of needed capital) for instance:
For t=1; 5000 × (1.06) 445706.3 For t=2; 45706.5 × (1.06) 40962.3
The sixth column shows the remaining cash flow of the project after discounting payments to debt holders (third column minus fifth column). Since debt ratio is 1/4, then rate of property is 3/4, and as debt ratio, it is constant all over the project. The seventh column is calculated by multiplying the second column by 3/4 rate of property.
According to what is presented in Table 2, Table 5 shows the NPV for debt holders and shareholders (based on their respected rate of return). As it is shown in the table, NPV for shareholders is less than expected value at the end of the project. Therefore, it can be claimed that rate of return calculated by WACC cannot provide the minimum expected value. This example can be applied as a counter example for Pierru's method used in his article and can also support Miller's theory by which he has challenged the correctness of WACC in his article.
PROVING STANDARD WACC’S CORRECTNESS AND ANSWERING TO MILLER’S QUESTION
Earlier, we contradict the claims presented in Miller and Pierru’s articles but we have not presented an obvious answer to Miller’s question yet. Here, we try to deal with it. The primary reason for ambiguity of WACC is the different descriptions presented for cash flow. Consi-dering different texts and discussions on the subject, we come to two distinct descriptions of cash flow and consequently two different formulas for WACC.
To enter the subject, it is better to have a common
understanding of cost of capital. According to Modigliani and Miller (1958), cost of capital is “the discount rate that equates the capitalized value of a firm's expected future cash flows to the firm's value”. To have a better understanding of aforesaid description, it is necessary to define the terms, “firm’s cash flow” and “firm’s value”:
There is a general agreement on the description of “firm’s value” which is: “the sum of the market value of the firm's debt and equity”. But there is no unanimous description of the term “cash flow”. Still, we can adopt two descriptions of the term which has had the most usage among all descriptions:
1. It is the after-tax net operating income.
2. It is the alternate concept identifies cash flows in terms of the ultimate flow of funds to the investors in the firm, debt, and equity holders.
The mathematical statement of the first description is:
The mathematical statement of the first description is:
Regardless of aforesaid descriptions, the cost of capital for a firm or a project is:
Using the afore formula, it is possible to calculate a firm or project’s cost of capital based on cash flow’s descriptions. Based upon the first description of cash flow -which considers the operating income of the firm as the firm’s cash flow- firm’s cost of capital is:
Table 6. Cash flow to the investors in the firm, debt, and equity holders based on Miller’s article. wd (Weight of
debt) ($)
we (Weight of equity) ($)
rd (Rate of return to debt holders) (%)
re (Rate of return to equity
holders) (%) Tax
50,000 150,000 6 12 1/3
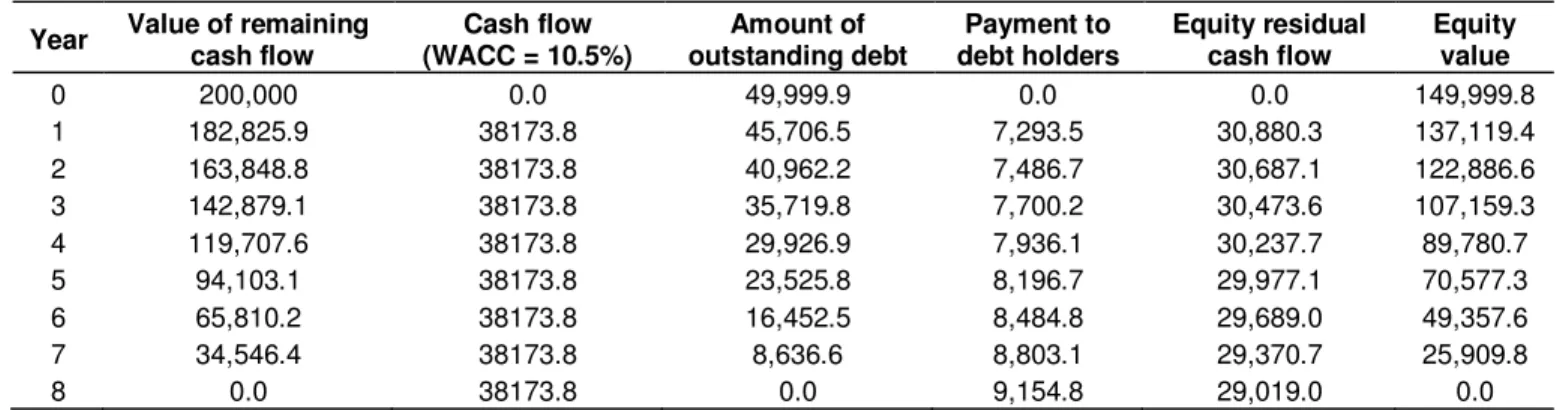
Table 7. Cash flow, equity value and debt holder’s return rate.
Year Value of remaining
cash flow Cash flow (WACC = 10.5%) Amount of outstanding debt Payment to debt holders Equity residual cash flow Equity value 0 200,000 0.0 49,999.9 0.0 0.0 149,999.8 1 182,825.9 38173.8 45,706.5 7,293.5 30,880.3 137,119.4 2 163,848.8 38173.8 40,962.2 7,486.7 30,687.1 122,886.6 3 142,879.1 38173.8 35,719.8 7,700.2 30,473.6 107,159.3 4 119,707.6 38173.8 29,926.9 7,936.1 30,237.7 89,780.7 5 94,103.1 38173.8 23,525.8 8,196.7 29,977.1 70,577.3 6 65,810.2 38173.8 16,452.5 8,484.8 29,689.0 49,357.6 7 34,546.4 38173.8 8,636.6 8,803.1 29,370.7 25,909.8 8 0.0 38173.8 0.0 9,154.8 29,019.0 0.0
Adding to the right side of the
above equation and subtracting it from the same side and
also we consider we have:
= = + (1 − t)
The afore formula is the famous WACC that has been widely used. Now, if we apply the second description of firm’s cash flow, firm’s cost of capital is:
= = +
Now, considering the two presented formulas interpreted from different cash flow’s descriptions, we are able to answer Miller’s question completely.
Miller’s Question: “if the firm earns in cash flow exactly the cost of capital (as figured by the WACC), is that cash flow, when divided between the bondholders (as suppliers of debt) and the stockholders (as suppliers of equity), sufficient to pay each group its individual necessary cash flow?”
The premier point to answer this question is hidden behind choosing the correct WACC formula. In fact, it is
always necessary to have only one description of cash flow as a premise. Since Miller considers cash flow as the amount of money to be paid to bondholders and stockholders annually, it can be concluded that Miller considers cash flow based on the second description presented in this article. Based on assumptions in the Miller’s article, Table 6 is presented. Using the second formula for WACC, we have:
= +
And using the formula NPV = 0 we are able to find the respective cash flow:
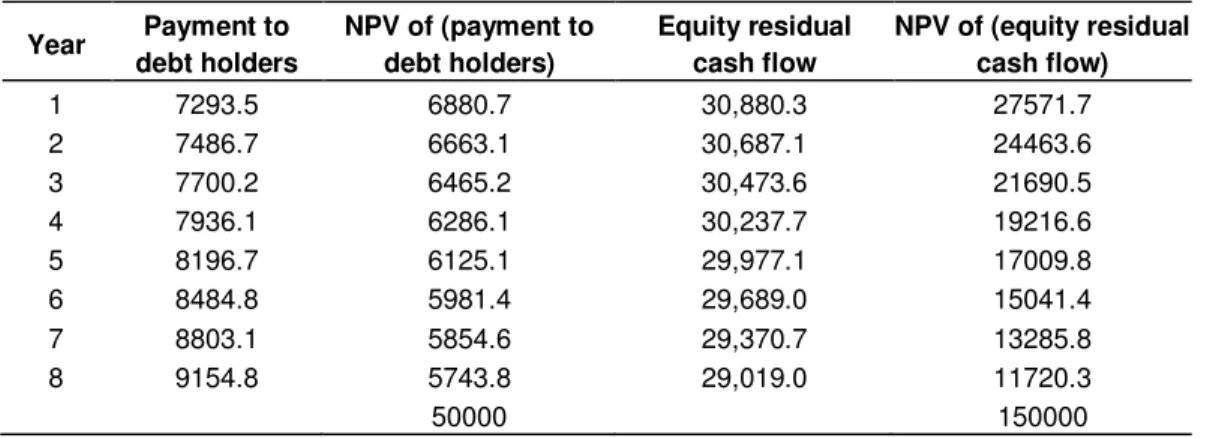
Now, it is the time to complete Table 7. According to what we have done before, we calculate the amounts of money that must be paid to shareholders and debt holders using their respective rate of return of 12 and 6%. Table 8 shows that the proposed WACC exactly concludes the expected cash flow. But to complete the table, Miller applied the second description of cash flow while the respective WACC has been calculated using the first description of cash flow, that is why he came to contradictory answers. The noticeable point is that four articles (Pierru, 2009a, b; Bade, 2009; Miller, 2009) failed to answer Miller’s question correctly because they did not consider this fact that they were assuming one description of cash flow while using another formula for WACC which assumes the other description of cash flow.
Table 8. Descriptionof expected cash flow. Year Payment to debt holders NPV of (payment to debt holders) Equity residual cash flow NPV of (equity residual cash flow) 1 7293.5 6880.7 30,880.3 27571.7 2 7486.7 6663.1 30,687.1 24463.6 3 7700.2 6465.2 30,473.6 21690.5 4 7936.1 6286.1 30,237.7 19216.6 5 8196.7 6125.1 29,977.1 17009.8 6 8484.8 5981.4 29,689.0 15041.4 7 8803.1 5854.6 29,370.7 13285.8 8 9154.8 5743.8 29,019.0 11720.3 50000 150000
The very last point in our discussion is about the role of tax in the formula concluded from the second description of cash flow. As it is obvious, there is no tax term in the formula; therefore, it seems that changes in tax do not have any effect on the answer (Nantell and Carlson, 1975). But, is it really reasonable that changes in tax would not have any effect on the capital costs?
To answer this question, another time, we consider the assumptions in the Miller’s article that is shown in Table 6. Using this information, it is necessary to have a closer consideration to two formulas of WACC. Based upon the first description of cash flow, we have:
= + (1 − t) =
0.1 or 10% We know that:
S0 EBIT = 30,000
And based upon the second description of WACC we have:
= +
We know that:
S0 EBIT = 30,000
As it is obvious, both formulas come to the same EBIT.
The difference between and is the term
D t:
+ t =
t = (D t)/ V
In other words, the difference between two descriptions of cash flow can be mathematically stated as follows: Cash flow2 = Cash flow1 + D t
Therefore, it can be concluded that the reason we do not see the term (D t )/V in the is that this term is incorporated in the respective cash flow so that repeating it creates a redundancy that makes
formula lead to wrong answers.
CONCLUSION
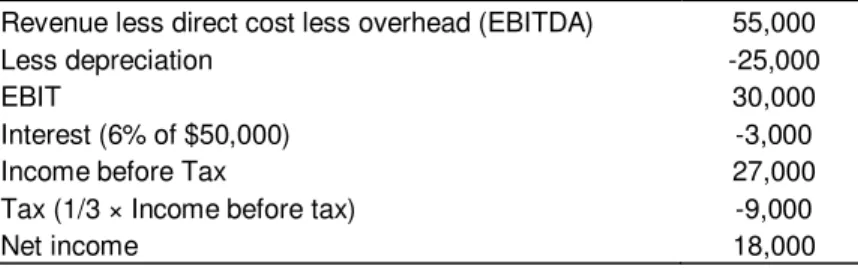
At the end, income statement concluded from the above example is presented in Table 9. As the table shows, for the common assumptions, using both WACC formulas correctly, leads to one single answer which is able to suggest the proper profit that shareholders and debt holders’ investment yields. It is to be noted that to have a correct calculation of WACC, one has to detect which description of cash flow is the assumed premise of the question and based upon it, he/she will be able to adopt the respective WACC formula which leads to correct WACC calculation.
ACKNOWLEDGEMENTS
The authors would like to express deepest gratitude to Prof. Dr. Fauzias Bt. Mat Nor for her guidance. Special
Table 9. Income statement reflecting zero economic profit, debt and equity.
Revenue less direct cost less overhead (EBITDA) 55,000
Less depreciation -25,000
EBIT 30,000
Interest (6% of $50,000) -3,000
Income before Tax 27,000
Tax (1/3 × Income before tax) -9,000
Net income 18,000
thanks also to Mrs.Samira Mahroozadeh for her friendship and support.
REFERENCES
Bade B (2009). Comment on: The weighted average cost of capital is not quite right. Q. Rev. Econ. Financ. 49:1476-1480.
Modigliani F, Miller MH (1958). The Cost of Capital, Corporate Finance and the Theory of Investment.Am. Econ. Rev. 48(3):261-297 Miller RA (2009). The weighted average cost of capital is not quite right.
Quarterly Rev. Econ. Financ. 49:128-138.
Nantell TJ, Carlson CR (1975). The Cost of Capital as a Weighted Average. J. Financ. 30(5):1343-1355.
Pierru A (2009a). The weighted average cost of capital is not quite right: A comment. Q. Rev. Econ. Financ. 49:1219-1223.
Pierru A (2009b). The weighted average cost of capital is not quite right: A rejoinder. Q. Rev.Econ. Financ. 49:1481-1484.