differentiation to definitive endoderm
The Harvard community has made this
article openly available.
Please share
how
this access benefits you. Your story matters
Citation
Chu, Li-Fang, Ning Leng, Jue Zhang, Zhonggang Hou, Daniel
Mamott, David T. Vereide, Jeea Choi, Christina Kendziorski,
Ron Stewart, and James A. Thomson. 2016. “Single-cell
RNA-seq reveals novel regulators of human embryonic stem cell
differentiation to definitive endoderm.” Genome Biology 17 (1):
173. doi:10.1186/s13059-016-1033-x. http://dx.doi.org/10.1186/
s13059-016-1033-x.
Published Version
doi:10.1186/s13059-016-1033-x
Citable link
http://nrs.harvard.edu/urn-3:HUL.InstRepos:29002559
Terms of Use
This article was downloaded from Harvard University’s DASH
repository, and is made available under the terms and conditions
applicable to Other Posted Material, as set forth at
http://
nrs.harvard.edu/urn-3:HUL.InstRepos:dash.current.terms-of-use#LAA
R E S E A R C H
Open Access
Single-cell RNA-seq reveals novel
regulators of human embryonic stem cell
differentiation to definitive endoderm
Li-Fang Chu
1*†, Ning Leng
1,6†, Jue Zhang
1, Zhonggang Hou
1,7, Daniel Mamott
1, David T. Vereide
1, Jeea Choi
4,
Christina Kendziorski
5, Ron Stewart
1and James A. Thomson
1,2,3*Abstract
Background:Human pluripotent stem cells offer the best available model to study the underlying cellular and molecular mechanisms of human embryonic lineage specification. However, it is not fully understood how individual stem cells exit the pluripotent state and transition towards their respective progenitor states.
Results:Here, we analyze the transcriptomes of human embryonic stem cell-derived lineage-specific progenitors by single-cell RNA-sequencing (scRNA-seq). We identify a definitive endoderm (DE) transcriptomic signature that leads us to pinpoint a critical time window when DE differentiation is enhanced by hypoxia. The molecular mechanisms governing the emergence of DE are further examined by time course scRNA-seq experiments, employing two new statistical tools to identify stage-specific genes over time (SCPattern) and to reconstruct the differentiation trajectory from the pluripotent state through mesendoderm to DE (Wave-Crest). Importantly, presumptive DE cells can be detected during the transitory phase fromBrachyury (T)+mesendoderm toward aCXCR4+DE state. Novel regulators are identified within this time window and are functionally validated on a screening platform with aT-2A-EGFP knock-in reporter engineered by CRISPR/Cas9. Through loss-of-function and gain-of-function experiments, we demonstrate thatKLF8plays a pivotal role modulating mesendoderm to DE differentiation.
Conclusions:We report the analysis of 1776 cells by scRNA-seq covering distinct human embryonic stem cell-derived progenitor states. By reconstructing a differentiation trajectory at single-cell resolution, novel regulators of the
mesendoderm transition to DE are elucidated and validated. Our strategy of combining single-cell analysis and genetic approaches can be applied to uncover novel regulators governing cell fate decisions in a variety of systems.
Keywords:Single-cell RNA-seq, Embryonic stem cells, Mesendoderm,Brachyury, Definitive endoderm, Wave-Crest, SCPattern,KLF8, CRISPR/Cas9
Background
The three primary germ layers composed of lineage-specific progenitors are critical for the establishment of the embryonic body plan [1–4]. Directional differenti-ation protocols have efficiently driven human pluripotent stem cells into progenitor populations mimicking those of the embryonic ectoderm, mesoderm, endoderm, and ex-traembryonic lineages [5–18]. However, it is not fully understood how individual embryonic stem (ES) cells exit
the pluripotent state and give rise to lineage-specific progenitors.
Among the three primary germ layers, the definitive endoderm (DE) is the internal layer of the embryonic gut, formed by the recruitment of epiblast cells through the primitive streak. The DE cells give rise to a variety of functional specialized epithelial cell types that line the developing gut tube and contribute to vital organs or tissues such as the lungs, trachea, esophagus, liver, stomach, intestine, thyroid, thymus, and pancreas [1–3]. These endoderm-derived organs support indispensible functions in adults, such as gas exchange in respiration, mechanical and chemical digestion, and blood glucose * Correspondence:lchu@morgridge.org;jthomson@morgridge.org
†Equal contributors
1Morgridge Institute for Research, Madison, WI, USA
Full list of author information is available at the end of the article
© 2016 The Author(s).Open AccessThis article is distributed under the terms of the Creative Commons Attribution 4.0 International License (http://creativecommons.org/licenses/by/4.0/), which permits unrestricted use, distribution, and reproduction in any medium, provided you give appropriate credit to the original author(s) and the source, provide a link to the Creative Commons license, and indicate if changes were made. The Creative Commons Public Domain Dedication waiver (http://creativecommons.org/publicdomain/zero/1.0/) applies to the data made available in this article, unless otherwise stated.
homeostasis and detoxification. Therefore, human pluri-potent stem cell-derived DE cells are an instrumental resource for regenerative medicine [7, 9, 10, 15, 18, 19]. However, the factors governing the transition from epiblast-derived precursors to the DE state is not fully understood.
Mesendoderm represents a transient state, composed of a migratory cell population emerging from the primitive streak. Its emergence is accompanied by the activation of the transcription factor Brachyury (T), which marks the onset of gastrulation [2, 11, 20]. As gastrulation continues, mesendoderm contributes to mesoderm or DE. Once the lineage decision is segregated,Texpression appears to be continually associated with certain mesodermal derivatives but not DE derivatives [11, 21, 22]. This represents a key developmental juncture when cell fate decisions have been made from a broad multi-potent state (mesendoderm) to-wards a more restricted state (definitive endoderm). Therefore, we designed our scRNA-seq experiments to detect signals that could promote DE differentiation and then followed up these experiments with a detailed time course to identify the critical time window in which mesendoderm transitions to the DE state.
Standard methods for transcriptome-wide profiling of dif-ferentiation involves the collection of thousands to millions of cells for deep sequencing (bulk RNA-seq) at one or sev-eral time points. With this approach, cellular heterogeneity cannot be resolved since variably expressed genes will be av-eraged or–if exclusively expressed in rare cells–completely missed. Single-cell RNA-seq (scRNA-seq), on the other hand, is able to characterize cell-to-cell variation and reveal transcriptomic signatures unique to individual cells [23–25]. Such analyses can provide novel insights into the responses to extrinsic signals and reveal intrinsic factors that control cell fate decisions. These insights can then guide the genesis of more sophisticated dif-ferentiation protocols and quality control assays.
To understand the distinctions between DE cells and the other lineage-specific progenitors, we examined their tran-scriptomes by scRNA-seq. Our analysis revealed a DE-specific signature that is enriched for NODAL and WNT signaling pathways as well as metabolism-related gene ex-pression. The latter category of genes led us to define a time window in which hypoxia could enhance DE marker expression. Based on this observation, we hypothesized that the emergence of nascent DE cells occurs as soon as two days post differentiation from the pluripotent state.
Compared to single time point experiments, time course scRNA-seq has the potential to reveal detailed cell state transitions [26–28]. To pinpoint the exact timing of DE cell emergence, we profiled the transition of single human ES cells to mesendoderm then to the DE state over four days of differentiation. To analyze the transition at the single-cell level, we developed two novel statistical tools.
First, SCPattern [29] is used to identify stage-specific genes over time; and second, Wave-Crest is used to recon-struct the differentiation trajectory from the pluripotent state through mesendoderm to DE. Based on this high-resolution temporal reconstruction, we detected presump-tive DE cells characterized with CXCR4 and SOX17 ex-pression as early as 36 h post differentiation. Focusing on this time point, Wave-Crest identified candidate genes that could function as pioneer regulators governing the transition from mesendoderm to the DE state.
Owing to known technical variability and stochastic expression in single-cell gene expression measurements [30–33], rigorous functional validation of scRNA-seq analyses is essential. In order to specifically validate our analysis, we engineered aT-2A-EGFPreporter ES cell line by CRISPR/Cas9-mediated knock-in. Of all the candidate genes tested, we found that siRNA knockdown of KLF8 rendered one of the most overt delays in differentiation. A converse gain-of-function experiment demonstrated that
KLF8 plays a previously unrecognized role during the transition from aT+state to aCXCR4+DE state. Our re-sults reveal that elevated levels ofKLF8enhance expres-sion of DE markers but not mesodermal genes, suggesting thatKLF8acts specifically on the transition from mesen-doderm to DE but not to mesoderm. Altogether, our study reinforces the importance of combining single-cell analysis and genetic approaches. We believe this strategy could be directly applied to other lineages during any differenti-ation paradigm to examine cell fate decisions.
Results
scRNA-seq reveals a unique endoderm progenitor signature
To begin investigating lineage-specific transcriptomic fea-tures at single-cell resolution, we performed a cohort of scRNA-seq experiments profiling snapshots of lineage-specific progenitor cells differentiated from H1 human ES cells using our established differentiation proto-cols, all adapted to chemically-defined culture condi-tions [17, 20, 34, 35]. In order to obtain a high purity of lineage-specific progenitors, cells were enriched by fluorescence-activated cell sorting (FACS) with their respective markers (see details in“Methods”and Additional file 1: Figure S1). Progenitors differentiated from human ES cells included neuronal progenitor cells (NPCs, ectoderm derivatives, n = 173), DE cells (endoderm derivatives, n = 138), endothelial cells (ECs, mesoderm derivatives, n = 105), and trophoblast-like cells (TBs, extraembryonic derivatives, n = 69). Single undifferen-tiated H1 (n = 212) and H9 (n = 162) human ES cells and human foreskin fibroblasts (HFFs, n = 159) were also included as controls. In total, 1018 single cells were analyzed in this cohort of experiments (Fig. 1a and Additional file 1: Figure S1).
0 2 4 6 Glycogen metabolic process
Energy reserve metabolic process Negative regulation of mitochondrial fusionGlycogen biosynthetic process Negative regulation of autophagy Beta-catenin binding Wnt receptor signaling pathway Nodal signaling pathway SMAD protein signal transduction Respiratory tube developmentDigestive system process Organ morphogenesisGastrulation Endoderm development
e
d
a
c
H1 ES cells C1 system & scRNA-seq DECs (endoderm) ECs (mesoderm) TBs (extra-embryonic) NPCs (ectoderm) H9 ES cells fibroblastsb
PC1 PC4 PC4 PC2 PC5 PC6 z score 4 2 Endoderm NODAL /TGFB WNT Metabolism -4 -2 0 Global Z Score H1 DEC TB EC NPC CER1 EOMES CXCR4 LEFTY1 GATA6 PECAM1 CD34 HAND1 GATA3 NANOG POU5F1 MAP2 PAX6 SOX2 ZFP42 DNMT3B GATA2 EPAS1 IFI16 H1 H9 EC NPC DEC HFF TB DE cellsTo elucidate the distinctions between different line-ages, we conducted bulk-projected principal component analysis (PCA), which projects individual cells on bulk RNA-seq defined principal component (PC) axes (see details in “Methods”). The majority of the single cells cluster according to their respective developmental line-ages (Fig. 1b). The tight clusters of overlapped H1 and H9 single cells indicated the relative homogeneity of hu-man ES cells compared to the rest of the progenitors. NPCs (ectoderm), TBs (extraembryonic), and HFFs (fibroblasts) were distantly positioned on the PCA plot while ECs and DE cells showed some overlapped domains, suggesting a closer lineage relationship. This result is con-sistent with the notion that mesoderm and DE cells may arise from a common progenitor pool during development and differentiation [20, 36, 37]. Hierarchical clustering analysis of key lineage markers further demonstrates dis-tinct but rather uniform expression within each progenitor state (Fig. 1c). Specifically, all of the single undifferentiated H1 cells uniformly expressed high levels of pluripotency
markers including POU5F1, NANOG, DNMT3B, and
ZFP42 (REX1). By contrast, NPCs are enriched for the ex-pression ofSOX2,PAX6, andMAP2; ECs are enriched for
PECAM1 and CD34; TBs are enriched for GATA3 and
HAND1; and DE cells are enriched for CER1, EOMES,
GATA6,LEFTY1, andCXCR4(Additional file 2: Table S1). These analyses indicate that scRNA-seq of the pro-genitors is competent to reveal lineage-specific tran-scriptomic features.
The bulk-projected PCA shows that the majority of variation could be captured by the first five PCs (Additional file 1: Figure S2). Interestingly, PC5 clearly separates DE cells from all the other progenitors (Fig. 1d). This result suggests that PC5 gene loadings are a signature exclusively exhibited by differentiating DE cells. We also observed single DE cells distributed along the PC5 axis, indicating that this gene loading captured a heterogeneous or asynchronous pool of DE cells. Moreover, DE cells showed the greatest heterogeneity compared to the other three types of progenitors by cor-relation analysis (Additional file 1: Figure S2). To deter-mine the signaling pathways associated with the DE signature, we performed Gene Ontology (GO) analysis utilizing the Allez algorithm, which used absolute gene loadings to weight gene-specific contribution to PC5
(see“Methods”) [38]. Allez enrichment analysis identified endoderm development, organ morphogenesis, NODAL signaling pathway, regulation of WNT receptor signaling pathway, and energy reserve metabolic processes among the significantly enriched GO terms (Fig. 1e and Additional file 3: Table S2). While it is well estab-lished that both NODAL and WNT signaling are crucial for endoderm development [1–3, 11], little is known about how the metabolic state could influ-ence DE differentiation. Based on these analyses, we
investigated whether manipulating the metabolic
conditions could impact DE differentiation.
Acute hypoxic treatment enhanced DE differentiation
It has been previously shown that lowering oxygen tension can reduce oxidative stress, shifting metabolic fueling pathways from oxidative phosphorylation to glycolysis to aid in maintaining pluripotency and re-programming [39, 40]. We therefore set out to meas-ure the impact of lowering oxygen concentration in the cell culture microenvironment during the differ-entiation toward DE (see “Methods”). We chose to monitor the expression of Chemokine (C-X-C Motif ) receptor 4 (CXCR4) in live cells as a surrogate marker for DE differentiation because: (1) CXCR4 ex-pression is specific to DE but absent in the visceral endoderm compartment at the late primitive streak stage (~E7.5) mouse embryo [41]; and (2) human ES-derived CXCR4+ cells have been shown to display hallmarks of DE [7, 15, 42].
At three days of differentiation, H1 or H9 ES cells cultured in severe hypoxia (1.5 % O2) significantly
in-creased the percentage of CXCR4+cells by FACS analysis compared to hypoxia (5 % O2) or normoxia (20 % O2)
conditions (Fig. 2a and b). The percentages of cells co-expressing CXCR4 and SOX17 also increased in 1.5 % O2
condition (Additional file 1: Figure S3). Marker studies by quantitative real-time PCR (qPCR) analysis confirmed that the expression of pluripotency genes POU5F1, NANOG, andSOX2were effectively downregulated in all conditions (Fig. 2c). Importantly, key DE markers CXCR4, SOX17,
HNF1B,KIT, andKRT19were all significantly upregulated in 1.5 % O2 but not in 5 % O2, compared with
nor-moxic conditions. Interestingly, hypoxic conditions also significantly suppressed T expression, which is a
(See figure on previous page.)
Fig. 1Snapshot scRNA-seq analysis of human ES-derived progenitors.aSchematics of experimental strategy. Human ES-derived lineage-specific progenitors were profiled at the single-cell resolution.bPrincipal component analysis (PCA) of all the cell types profiled. Shown are PC4 vs. PC1 and PC2 vs. PC4.cHierarchical clustering analysis of progenitors differentiated from H1 cells with selected lineage-specific markers shown on the
right.dPCA of all the cell types profiled, shown are PC5 vs. PC6. Thelight green shadehighlights all the single DE cells.eEnrichment analysis of PC5 shown in (d). Bar graph shows the significant z scores of selected GO terms. Summary on collections of GO terms are shown on theright. Dashed lineindicates statistical significant threshold at z score = 1.62 (one tailedpvalue <0.05).NPCneuronal progenitor cell,DECdefinitive endoderm cell,ECendothelial cell,TBtrophoblast-like cell,HFFhuman foreskin fibroblasts
pan-mesendoderm marker whose expression precedes DE marker expression (Fig. 2c).
While differentiating human ES cells with 1.5 % O2
has a profound effect on the induction of DE markers, we also observed that proliferation decreased and cell death increased after prolonged hypoxic differentiation (Additional file 1: Figure S3). Thus, we speculate that 1.5 % O2treatment stimulates the emergence of nascent
DE cells but may not be beneficial for long-term prolif-eration and maturation. To determine the critical timing when the effects of severe hypoxia could take place, we performed acute-hypoxia treatment in our differenti-ation protocols (Fig. 2d). In this set of experiments, H1 or H9 ES cells were first differentiated in 1.5 % O2
envir-onment for various lengths (zero, one, two, three, or four days of differentiation) and then switched back to normoxic conditions for up to four days of differenti-ation (Fig. 2d). Consistently, qPCR analysis showed that continuous hypoxic treatment throughout the first three days of differentiation resulted in substantially enhanced expression of key DE markers, such as CXCR4,FOXA2,
SOX17, HNF1B, and KIT (Fig. 2d). Remarkably, the marker expression showed significant upregulation within just two days of hypoxic treatment. Immuno-fluorescence staining of SOX17 and FOXA2 confirmed areas with an increased number of SOX17+and FOXA2+ cells within two days of severe hypoxic differentiation con-dition compared to normoxia control (Fig. 2e). These re-sults corroborate a recent mouse ES cell study in which hypoxia culture facilitated DE differentiation [43]. Most importantly, this observation suggests that the birth of nascent DE cells is a well-timed event. Intervention of this process by enhancing factors (in this case, with severe hypoxia) allows us to close in on the key moments in which DE cells become specified from their mesendoderm precursors. These results motivated us to closely examine the transition from mesendoderm to DE state at a higher temporal resolution.
Reconstruction of temporal single-cell states identifies regulators for nascent DE cell differentiation
To precisely pinpoint the staging and timing during DE emergence, we performed scRNA-seq at time points
along the differentiation protocol to produce DE cells from human ES cells (see“Methods”). A total of 758 sin-gle cells were captured and profiled by scRNA-seq at 0, 12, 24, 36, 72, and 96 h of differentiation (Fig. 3a). PCA revealed that single cells from each time point along the differentiation course occupied a unique dimensional space, indicating a robust directional differentiation (Fig. 3a and Additional file 1: Figure S4). However, we noticed overlapping domains between single cells col-lected from 72 and 96 h of differentiation, indicating a similar transcriptome profile (see“Discussion”).
To further characterize the genes participating in each stage of differentiation, we performed differential expression analysis by SCPattern, which identifies signifi-cantly upregulated or downregulated genes between each pair of adjacent sampling time points (see “Methods”). SCPattern is a novel algorithm developed for differential expression analysis on time course scRNA-seq data [29]. Existing differential expression tools developed for bulk RNA-seq make distributional assumptions that are in-appropriate for scRNA-seq data. In general, for a given gene, the bulk RNA-seq methods usually assume expres-sion values within a biological condition follow a uni-modal distribution such as negative binomial distribution [44–48] or Poisson distribution [49]. However, such as-sumptions are often violated in scRNA-seq data due to the present of sub-populations and technical dropouts [50, 51]. SCPattern makes no parametrical assumptions on the dis-tribution of the single-cell gene expression values; instead, it performs non-parametric tests based on a Kolmogorov– Smirnov statistic and is able to detect various types of changes over multiple ordered conditions [29].
At 12 h of differentiation, the majority of the cells responded to BMP4, Activin A, and CHIR 99021 (small molecule used as a WNT signaling agonist) treatment by robustly expressing NODAL, EOMES, and ID1. At 24 h of differentiation, a second wave of genes exhibited high levels of expression such asT, MSX2, andCDX1, all in-dicating a transition of the cells towards a primitive streak state. At 36 h of differentiation, the level of T transcripts rapidly decreased, characterized by upregula-tion of early DE-specific genes, such as CER1 and
GATA4. At 72 h of differentiation, the majority of the
(See figure on previous page.)
Fig. 2Acute hypoxic treatment enhanced DE formation.aFACS analysis of anti-CXCR4 staining of H1 cells differentiated for three days towards (blue population) under various hypoxia conditions. Undifferentiated H1 cells were gated as negative controls (gray populations). Thex-axis
indicates the APC channel.bSummary of the percentages of CXCR4+cells (with various oxygen concentrations) from H1 or H9 differentiation for three days toward DE cells.cQPCR analysis of experiments performed in (b). All expression levels were first normalized to endogenous GAPDH. For pluripotency markers (upper panels), samples were normalized to undifferentiated H1 or H9 samples, which were arbitrarily set to 1. For other markers (midandlower panels), samples were normalized to the 20 % O2samples, which were arbitrarily set to 1.dLeft panel, schematics of
various lengths of hypoxic treatment.Right panel, qPCR analysis at day four of differentiation for H1 or H9 cells. Thex-axisindicates the number of days treated with 1.5 % O2as indicated in theleft panel. Samples were normalized to those from normoxia, which were arbitrarily set to 1.e
Con-focal images of OCT4, FOXA2, and SOX17 immunofluorescence staining at day two of differentiation under 20 % or 1.5 % O2. Scale bars = 50μm. All
cells expressed endogenousDKK4 and MYCT1. Key DE markers continue to be expressed at high levels among single cells at the 96-h time point, including EOMES,
CER1, GATA4, PRDM1, and POU2AF1, indicating that cells progressed toward the DE state [52, 53] (Fig. 3b and Additional file 4: Table S3).
At any time point during a differentiation protocol, each sampled cell is not necessarily identical to the others; likely a result of differences in the cell cycle and the local microenvironment of the differentiating cells. We capitalized on the asynchronous nature of the cells to reconstruct a single-cell order following the differenti-ation trajectory toward DE. By reconstructing this single-cell transcriptomic order, we hoped to identify novel regulators whose expression could mediate the transition from mesendoderm toward a DE state. We devised a novel statistical tool, Wave-Crest, to re-order single cells according to the expression of key gene markers. The cell order reconstruction step of Wave-Crest takes a group of genes of interest and aims to recover a smooth expression profile along time for each of the genes in consideration. To do so, Wave-Crest implements a constrained extended nearest-insertion (ENI) algorithm to reorder cells within each time point utilizing boundary informa-tion from other time points. In particular, if a cell’s expression profile is closer to the cells from the pre-vious (next) time point, the cell will be placed in an earlier (later) position in the reconstructed order. The reordering is under the constraint that cells from different collection times are not allowed to be mixed in the recovered order. After ENI, Wave-Crest utilizes the 2-opt algorithm to further refine the cell order (see “Methods”) [54]. When applied Wave-Crest to the scRNA-seq DE differentiation time course data, we selected the genes of interest by combining empirical results from SCPattern and prior knowledge [1, 2, 5, 7, 9, 20]. Our reconstruc-tion focus on markers representing the pluripotent, mesendodermal, and DE states to build a directional reordering of single cells without characterizing the branching structure of single cells (Additional file 1: Figure S5). In particular, pluripotency marker POU5F1 gradually decreased over the course of 96 h of differenti-ation, whereas mesendoderm marker T expression first
peaked at 24 h and gradually decreased at 36–72 h of dif-ferentiation (Fig. 3c, left panel). Remarkably, in the recon-structed order,CXCR4 and SOX17both showed a subtle but significant upregulation as early as 36 h of differenti-ation and continued to increase in later time points (Fig. 3c, right panel). Importantly, in the recovered cell order at the 36-h time point,CXCR4+and SOX17+single cells appear later and are almost mutually exclusive to the
POU5F1high
and Thigh cells, indicating our reconstructed cell order is indeed aligned with the differentiation trajectory toward a DE fate (Additional file 1: Figure S5). These results also suggest that the presumptive DE transcriptional program begins between 24 and 36 h, which is surprisingly early considering most estab-lished human pluripotent stem cell protocols typically consider DE cells to emerge around days 4 or 5 of differentiation [7, 11, 15, 42, 52].
The second step of Wave-Crest involves application of polynomial regression models to identify genes whose expression profile best fits this reconstructed differen-tiation trajectory, a strategy we call “fishing” (see “Methods”). We focused on fishing genes at 36 h of differentiation because this appears to be the transi-tion time characterized with a steep downregulatransi-tion of POU5F1 and T as well as upregulation of CXCR4 and SOX17 (Fig. 3c and Additional file 1: Figure S5). Wave-Crest extracted the reconstructed cell order from the 172 cells collected at 36 h of differentiation and then fished against a curated list of transcrip-tional regulators (Additranscrip-tional file 5: Table S4). The top-fished genes were defined as the genes which had small fitting error in the polynomial regressions. Per-mutation tests were applied to infer the significance. These top-fished genes were then classified into up-regulated and downup-regulated groups by the coefficient sign of gene-specific slope fitting. The top-fished gene list included known markers for mesendoderm or
mesoderm (downregulated genes), such as GATA3
(No. 3),HAND1(No. 4),FOXF1(No. 11),LEF1(No. 15), and markers for DE specification (upregulated genes), such asSOX4(No. 3) andOTX2(No. 18), further demon-strating the power of Wave-Crest reconstruction (Fig. 3d and Additional file 6: Table S5).We reasoned that the top upregulated genes are likely to promote the transition from mesendoderm to DE (Fig. 3d). To test these genes, a
(See figure on previous page.)
Fig. 3Time course scRNA-seq data analysis and reconstructing DE differentiation trajectory.aUpper panel, schematics of experimental strategy illustrating time points of scRNA-seq sampling along the differentiation from pluripotent state though mesendoderm to DE cells.Lower panel, PCA of scRNA-seq data, shown is PC1 vs. PC2.bViolin plots of selected stage-specific markers identified by SCPattern analysis. They-axisindicates normalized expression value, Log2(expected count + 1). Thex-axisindicates time points of sampling.cReconstructed single-cell order by Wave-Crest. Shown are four of the eight genes used for temporal reconstruction. Thex-axisindicates cells following Wave-Crest recovered cell order. They-axisindicates normalized expression value. Fitted lines of gene-specific expression are shown inblack.dTop 25 upregulated or downregulated genes identified by Wave-Crest at 36 h of differentiation. Thex-axisindicates gene symbol, they-axisindicates the significance value, -Log (pvalue) of each gene
reporter was devised to measure the effect of manipula-tion of candidate genes during the transimanipula-tion from aT+ state to aCXCR4+state in live cells.
H9-T-2A-EGFPreporter line is a robust tool to monitor the mesendoderm to DE transition
In order to measure the levels of real-time endogenous
T protein expression, we inserted a 2A-EGFP-PGK-Puro cassette into the endogenousT locus via CRISPR/Cas9-mediated gene targeting (Fig. 4a) [55, 56]. Collective
analyses from copy number qPCR, junction PCR, and southern blotting confirmed that clone 39 was a cor-rectly targeted clone with only one copy of the EGFP andPurocassette knock-in into the endogenousTlocus. (Fig. 4b and Additional file 1: Figure S6). Upon removal of the PGK-Purocassette with transient Cre expression, thisT-2A-EGFPline (clone 39) was used in all the subse-quent experiments. Cytogenetic test also verified a nor-mal karyotype after gene targeting and clonal expansion (Additional file 1: Figure S6). Importantly, qPCR analysis
Fig. 4Generation ofT-2A-EGFPknock-in reporter cell line.aGene targeting strategy of knock-inT-2A-EGFP-PGK-Purocassette to replace the endogenousTstop codon, facilitated by the CRISPR/Cas9.Gray boxesindicate the exons of the endogenous gene. The arrow indicates the position of the Cas9/sgRNA cut site. The position of the probe for southern blot is indicated.E EcoRIsites. The lengths for each EcoRI-digested genomic DNA fragments are indicated.bSouthern blot shows the targeted allele shifted from 4.2 (wild type genomic fragment, WT) to 4.8 kb (knock-in genomic fragment, KI).cConfocal images of SOX2, T, and EGFP immunofluorescence staining over three days of differentiation. Hours of differentiation are indicated. Scale bars = 50μm.dFACS analysis monitoring the dynamics of the percentage of CXCR4+and T-2A-EGFP+cells over three days
on EGFP-sorted cells and immunofluorescence staining confirmed that the dynamics of EGFP expression is highly correlated with both the endogenousT transcript and protein expression, respectively, making the
T-2A-EGFP reporter a robust readout for T+ state in the course of our DE differentiation (Fig. 4c and Additional file 1: Figure S6).
Simultaneously measuring bothTand CXCR4 protein levels by FACS provided both the precision and reso-lution required to detect cell state transitions. After just 24 h of differentiation, more than 70 % of the cells be-came T-2A-EGFP+. The percentage of T-2A-EGFP+cells reached a zenith (approximately 90 %) between 28 and 32 h of differentiation and then gradually decreased over time (20 % at 48 h and below 10 % at 72 h of differenti-ation, Fig. 4d). Co-staining cells with CXCR4 anti-bodies revealed that less than 1 % of the cells were CXCR4+ at 24 h of differentiation. After 48 h, approxi-mately 25 % of the cells became CXCR4+, increasing to above 40 % after 72 h of differentiation (Fig. 4d). There-fore, while T expression transiently peaked around 32 h, CXCR4 expression continually increased, starting as early as 36–40 h of differentiation, a dynamic expression pattern mirroring the temporal profiling by scRNA-seq described above (Fig. 3c). Thus, monitoring the expres-sion of T-2A-EGFP and CXCR4 over time presented a tractable means to screen candidate genes identified in the Wave-Crest analysis.
KLF8mediates the mesendoderm to DE transition
We hypothesized that if a regulator plays a promotional role during the transition from mesendoderm toward DE, then knocking down its expression would delay this progression. On the other hand, overexpression of such regulators should accelerate this progression. We con-ducted a siRNA knockdown screen focused on the top 25 upregulated genes identified by Wave-Crest (Fig. 3d). We accounted for both the percentages of EGFP+ and CXCR4+of each gene knockdown at day two of differen-tiation (between 45 and 48 h), defined as a “ Differenti-ation Score”for each gene tested (see“Methods”). When compared with non-target siRNA controls (Differenti-ation Score arbitrarily set to 1), knockdown of CXCR4 reduced the percentage of CXCR4+ cells from greater than 30 % to approximately 10 %; whereas knockdown ofTsubstantially reduced the percentage of EGFP+cells and increased percentage of CXCR4+cells, validating the efficacy of siRNA knockdown protocols (Fig. 5a). Among all the genes tested, TERF1, SPEN, and KLF8 knock-downs displayed the lowest Differentiation Score (i.e. the most potent blockade of differentiation) (Fig. 5b). Be-tween the top three genes,KLF8knockdown showed the smallest increase of T-2A-EGFP expression, indicating a more specific blockade of DE differentiation rather than
enhancing mesendoderm or mesoderm differentiation (Fig. 5a and Additional file 1: Figure S7). KLF8 is expressed at a much lower level in undifferentiated hu-man ES cells than TERF1 or SPEN (Additional file 1: Figure S7). KLF8 was also detected as a differentially expressed gene in our SCPattern analysis (Additional file 4: Table S3). Collectively, these data support the idea that KLF8 may play a specific role during the transition from mesendoderm toward DE cells.
To further examine this possibility, we generated a doxycycline (DOX)-inducible KLF8 transgene integrated by the PiggyBac system [57] into theT-2A-EGFPreporter cell line. Upon differentiation, induction of KLF8 (DOX treatment from 20 to 40 h of differentiation) robustly in-creased the percentage of CXCR4+ cells from ~5 % to above 40 % in a dosage-dependent manner (Fig. 5c), ac-companied by the loss of T-2A-EGFP+cells (Fig. 5c). This result was confirmed by examining a total of three inde-pendent KLF8overexpression clones. Furthermore, DOX induction of KLF8 led to significant activation of DE markers including CXCR4, HNF1B, SOX17, and KIT, as judged by qPCR analysis from all three clones (Fig. 5d). Importantly,KLF8overexpression did not induce the ex-pression of mesendoderm or mesoderm markers such as
T,EOMES,GSC, MSX2, andPDGFRA(Fig. 5d). We also observed that overexpressingKLF8increased cell mobility as evident by the upregulation ofTWIST1, an epithelial-to-mesenchymal transition (EMT) marker (Fig. 5d). These results indicate thatKLF8plays a specific role promoting the transition fromT+mesendoderm toCXCR4+DE fate, perhaps through the suppression ofTor by enhancing the EMT during DE differentiation. These results also suggest that the cell state transition from mesendoderm to DE is a complex and dynamic process, coupling the expression of specific transcriptional regulators with changes in cell migratory behavior. Altogether, our single-cell analysis identified KLF8 as a previously unrecognized positive regulator of the transition from mesendoderm to nascent DE (Fig. 6). Other genes identified by the single-cell ana-lysis are additional candidates for being regulators of this transition as well. We anticipate that the strategy used in this study–using scRNA-seq analysis to form hypotheses that can be tested by more conventional techniques – may be further applied to uncover novel regulators in other lineages during cell fate decisions both in vitro and in vivo.
Discussion
scRNA-seq from lineage progenitors and the role of hypoxia on DE differentiation
Our scRNA-seq analysis of distinct progenitors derived from human ES cells revealed that one of the principal components (PC5) discriminated the DE cells from all other progenitors (Fig. 1d). Allez enrichment analysis on
t-B
A
C
D
0 0.5 1.0 1.5 10 20 POU5F1T AKAP9 NOTCH2 Non-TargetKLHL6 TRIM35SOX17 NFE2L2GTF2I EP300BPTF MYSM1ATRX ZNF708 ZNF273 GTF2E1 SMARCC2ZIC2 PCM1 SNAPC1 POU2AF1ZNF264 SOX4 ZNF093OTX2 KLF8 SPEN CXCR4TERF1 Undifferentiated Non-Target siRNAT siRNA CXCR4 siRNA KLF8 siRNA
Dox(ng/ml): 0 20 200 2000 T-2A-EGFP T-2A-EGFP siRNA against candidate genes BMP4 CHIR ACTIVIN A T-2A-EGFP TetO-KLF8 T-2A-EGFP TetO-KLF8 BMP4 CHIR ACTIVIN A +Dox ESCs Mesendoderm ESCs Mesendoderm 20 200 2000 Dox(ng/ml): Relative Expression OCT4
NANOG SOX17 FOXA2 CXCR4 KIT HNF1B TWIST1 T EOMES GSC MSX2PDGFRAKLF8 1 10 100 1000 10000 ** *** ** *** * * * * * * *** *** *** *** * *** **
he gene loadings from PC5 revealed a role for metabol-ism in the genesis of DE cells (Figs. 1e and 2). Among the human ES cells tested, culture conditions of 1.5 % O2, but not 5 % O2, consistently increased the
per-centage of CXCR4+ cells (Fig. 2b). Most importantly, the impact of hypoxia is pronounced in the first two days of differentiation (Fig. 2d and e). Interestingly, only one recent report thus far described a positive effect of hypoxia on differentiating mouse ES cells to DE [43]. However, given that mouse and human ES cells are maintained by distinct signaling pathways [58, 59], it was not entirely clear if the hypoxia-enhanced DE differentiation may or may not directly translate to human ES system. To the best of our knowledge, our study is the first to investigate the ef-fects of hypoxia during early definitive endoderm dif-ferentiation from human ES cells.
Most importantly, the implications from these re-sults are twofold. First, there is a critical time window when the precursors of DE are responsive to hypoxic conditions, causing the initial upregulation of DE markers (Fig. 6). Second, it is plausible that cells des-tined to become DE cells, experience a lower oxygen concentration that prompts their specification to DE fate. Future whole embryo culture experiments will determine if a hypoxic microenvironment can en-hance DE formation/specification.
Temporal scRNA-seq analysis highlights the transcriptomic transitions from pluripotent to mesendoderm to DE states
We compared scRNA-seq profiles between each pair of neighboring time points over four days of differentiation (Fig. 3a) and found that the number of differentially expressed genes generally decreased over time (2224
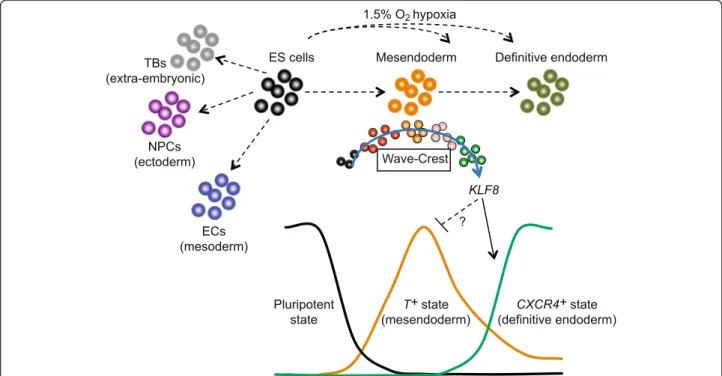
Fig. 6Snapshot and temporal scRNA-seq profiling on progenitor cell states. scRNA-seq from snapshots of lineage-specific progenitors revealed that hypoxia enhances DE differentiation in a time-sensitive manner, likely acting on the mesendodermal progenitors. The differentiation trajectory was reconstructed by Wave-Crest (blue arrow) using time course scRNA-seq along the differentiation towards DE cells. Results from loss-of-function and gain-of-function experiments demonstrated thatKLF8function as a positive regulator mediating cell states transitions fromT+mesendoderm
toCXCR4+DE cells. We hypothesize thatKLF8can suppressT+state and in turn enhance the activation ofCXCR4+state. The molecular
mechanisms of howKLF8directly or indirectly suppressT+state require future investigation
(See figure on previous page.)
Fig. 5KLF8mediates mesendoderm to DE differentiation.aSchematics of siRNA knockdown strategy. FACS analysis of CXCR4 and T-2A-EGFP expression at day two of differentiation with representative gene-specific siRNA transfection results.bSummary Differentiation Scores of siRNA knockdown experiments of the top 25 genes tested. Thedashed lineindicates a Differentiation Score of 1, set by the non-target siRNA control. Genes inblue fontindicate control experiments.cUpper panel, schematics ofKLF8overexpression strategy during differentiation.Lower panel, FACS analysis shows CXCR4 and T-2A-EGFP expression at day two of differentiation.DOXDoxycycline.dQPCR analysis of three independentKLF8
overexpression clones tested at day two of differentiation. All data are shown as mean ± S.D. ***p<0.001; **p<0.01; *p<0.05, all by one-tailed t-test. In all FACS plots, thex-axisindicates GFP/FITC channel, they-axisindicates APC channel
genes [0–12 h], 830 genes [12–24 h], 1317 genes [24–36 h], 466 genes [36–72 h], and 11 genes (72-96 h)]. This observation suggests that transcriptional changes gradually decrease with continual BMP4 and Activin A signaling. Interestingly, our PCA plot (Fig. 3a) shows over-lapped individual cells collected between 72 h and 96 h, suggesting that cells could gradually transition into a rela-tively“stable”state at 72 h of differentiation.
When focusing on the 36 h time point of differenti-ation, the reconstructed cell order provides a glimpse of how the cells progress over time (Fig. 3c and Additional file 1: Figure S5). This analysis reveals that DE markers
SOX17 and CXCR4 are activated surprisingly early in a small number of cells with low or no expression of T (Fig. 3c and Figure S5). This trend, consistent with pre-vious findings, confirmed the reconstructed trajectory from mesendoderm toward DE and provided a measure of confidence in the subsequent fishing step. While we only tested upregulated genes from the Wave-Crest ana-lysis, it is possible that our top downregulated genes are playing regulatory roles for mesendoderm or mesoderm fate differentiation (Fig. 3d). Given the high quantity of reconstructed single-cell information, follow-up experi-ments are needed to investigate the full set of regulators governing the decision to bifurcate from mesendoderm to either mesoderm or DE.
It is not surprising that scRNA-seq data revealed cell state asynchrony during differentiation as the phenomenon has been reported in other cell types subjected to scRNA-seq analysis [26–28]. However, what factors contribute to the cell-to-cell delay or ad-vancement of transcriptomic progression is still un-clear. One possible factor is the cell cycle, which is unsynchronized across the population of cells [25] ei-ther at the initiation of differentiation and/or when single cells were collected for RNA-seq. For example, recent reports suggest that the cell cycle status can influence signaling pathways directing exit from the pluripotent state [60–62]. To resolve this, future ef-forts will need to monitor real-time expression of lineage specification markers while simultaneously tra-cing cell division.
Two new statistical tools to characterize our temporal scRNA-seq data are reported in this study. The first is SCPattern, an empirical Bayes model to identify genes with expression changes over time, specifically designed to tackle the analytical challenges of scRNA-seq data. The statistical power and simulations of SCPattern are detailed in a companion study [29]. The second tool, Wave-Crest, is composed of a first step to reconstruct temporal cell order and a second step focused on identi-fying novel regulators (fishing) (see “Methods”). Evaluat-ing the performance of Wave-Crest by simulation studies can be found in Additional file 1: Supplementary
Results and Figure S8 with Additional file 7. Wave-Crest attempts to reorder cells along their differentiation pro-gression based on known markers expression and fo-cused on identifying novel regulators at transition state (particularly from mesendoderm to DE). Wave-Crest also uses known temporal information to improve its performance. While the development of Wave-Crest was not intended to perform pseudo-temporal reconstruc-tion, its reconstructed single-cell order could represent a particular differentiation trajectory guided by preselected markers. While comparing the performance between Wave-Crest and other pseudo-temporal approaches is beyond the scope of this study, a preliminary compari-son of using known markers to guide single-cell reorder-ing between Wave-Crest and Monocle [63] could be found in Additional file 1: Supplementary Results and Figure S9. It is important to note that this comparison only used our preselected markers. A graphical user interface implementation of Wave-Crest is also available; details may be found in Additional file 1: Supplementary Methods and Figure S10. To decide candidate genes to use for reordering, the algorithm currently utilizes differ-ential expression results from SCPattern combined with prior knowledge of markers (Additional file 1: Figure S5). Although supervised or semi-supervised learning plays a role in most of the single-cell analyses [27, 64–66], it would be ideal to extract markers from high dimensional data in an unsupervised fashion. The fishing step is per-formed primarily for transcriptional regulators in this study. It will be of great interest to perform fishing for other categories of gene families, such as post-translational regulators or regulatory RNA species shown to be critical for cell fate transitions. Finally, control of cell-to-cell variabilities by spike-ins was not applied in our scRNA-seq data due to technical challenges in our initial in-house trial experiments. Future efforts to employ novel computational ap-proaches to access scRNA-seq variability should greatly improve our ability to identify additional novel regulators [30, 32, 50, 66–68].
T-2A-EGFPreporter line as a robust platform to define the role ofKLF8in mediating DE differentiation
In order to directly test the candidate genes identified from scRNA-seq analysis, we generated the firstT -knock-in reporter human ES cell l-knock-ine that faithfully reflects the endogenousT protein expression level, rather than at the transcriptional level [69, 70]. As T activation marks the onset of gastrulation, this reporter line will be useful for future studies involving the earliest molecular events dur-ing the formation of the primitive streak state in human pluripotent stem cells. While CXCR4 antibody staining provided a robust readout for DE state, combining our
of transcription factor whose expression is important for DE cell fate would be beneficial.
Our siRNA screen resulted in mostly delayed differen-tiation phenotypes among the candidate genes (top up-regulated genes) tested (Fig. 5b), consistent with the hypothesis that this group of genes is mostly positive regulators of the DE fate. Specifically,TERF1,SPEN, and
KLF8stand out as the strongest candidates to reduce the percentage of CXCR4+ cells (Fig. 5b and Additional file 1: Figure S7). We concentrated on KLF8 because it displayed a dynamic expression pattern over the course of four days of differentiation (Additional file 1: Figure S7). The knockdown ofTERF1andSPENare likely reflecting a pleiotropic rather than specific effect on DE differenti-ation. Interestingly, our data also indicate thatKLF8could negatively regulate T expression since KLF8 knockdown increasedTexpression (Fig. 5a) andKLF8overexpression decreased T expression (Fig. 5c). Whether T is a direct target ofKLF8requires further examination (Fig. 6). The positive regulation role of KLF8 in DE differentiation is best demonstrated by overexpression of KLF8 alone (which is sufficient to induce DE markers) suggesting an acceleration of the transition from mesendoderm to DE (Figs. 5d and 6).
While the exact role(s) ofKLF8during early embryogen-esis has not been examined in detail, a hemizygous gene-trappedKLF8allele exhibits developmental delay at mid-gestation; although with variable penetrance in the gene-trapped embryos examined [71]. Furthermore, recent studies indicate that KLF8 mediates a number of onco-genic processes including transformation and metastasis in ovarian, breast, bladder, and colorectal cancers [72–74]. It is plausible that KLF8 may regulate the EMT that is coupled with DE specification (Fig. 6). Future efforts may elucidate the molecular mechanisms by examining the dir-ect targets ofKLF8during DE cell fate specification. Conclusions
In this study, we reported the analysis of scRNA-seq data from a total of 1776 single cells generated from various lineage-specific progenitors and from time course profiling along mesendoderm toward DE lineage. To our knowledge, this is one of the most complete scRNA-seq studies characterizing human ES cells and their progenies to date. We describe new algorithms for scRNA-seq analysis: Wave-Crest and SCPattern. Our scRNA-seq analyses uncovered a cohort of novel regula-tors potentially responsible for the transitioning phase from mesendoderm toward endodermal progenitors. We have demonstrated that KLF8plays a pivotal role in ac-celerating the differentiation of DE cells. Altogether, we believe that the combination of scRNA-seq analysis and genetic approaches will shed light on novel molecular mechanisms governing cell fate decisions.
Methods
Cell culture and differentiation
H1 and H9 human ES cells were routinely maintained at the undifferentiated state in E8 medium on Matrigel (BD Bioscience) coated tissue culture plates with daily medium feeding [34]. Human ES cells were passaged every 3–4 days with 0.5 mM EDTA in PBS at 1:10 to 1:15 ratio for maintenance. H1 were differentiated ac-cording to previously established protocols [6, 17, 35]. In brief, H1 cells were individualized with Accutase (Life Technologies), washed once, and then seeded onto Matrigel coated plates at a density of 1–2.0 × 10⁴ cells/ cm2and cultured in various differentiation medium. For TBs, H1 were seeded in E7 (E8 minus FGF2) with 50 ng/mL BMP4 and SB431542 (5 μM). For ECs, H1 were seeded in E8 with 5 ng/mL BMP4 and 25 ng/mL Activin A for the first two days, then switched to supple-ment with VEGF and WNT for three days. For DE cells, H1 cells were seeded in E8 with BMP4 (5 ng/mL), Acti-vin A (25 ng/mL), and CHIR99021 (1 μM) for the first two days, then withdraw CHIR99021 for the remaining period of differentiation. This differentiation protocol is used in all RNA-seq, hypoxic, siRNA knockdown and
KLF8overexpression experiments. For NPCs, the undif-ferentiated H1-SOX2-mCherry reporter line was treated with 0.5 mM EDTA in PBS for 3–5 min and seeded in NPC differentiation medium (1–2 × 10⁴ cells/cm2). The NPC differentiation medium consists of E6 (E8 minus FGF2, minus TGFβ1), with 2.5μg/mL insulin, SB431542 (10μM) and 100 ng/mL Noggin [35]. DE cells, ECs, and TBs were harvested at the end of day 5 for antibody staining and subsequent FACS sorting. Specifically, ECs were enriched from the PECAM1+/CD34+ double posi-tive sorted population; DE cells were enriched from the CXCR4+ sorted population; TBs were enriched from the TROP2+ sorted population; and NPCs were enriched from sorting for the Cherry + population from a SOX2-Cherry+ knock-in line at the end of day 7 of differenti-ation. For the time course scRNA-seq experiments, no cell sorting or marker enrichment was performed prior to capture single cells. All differentiation media were changed daily. HFFs were cultured in DMEM/F12 sup-plemented with 10 % FBS. All 1.5 % O2hypoxia
experi-ments were conducted in a hypoxic glove box (Coy Labs). All 5 % O2 hypoxia experiments or normoxia
20 % O2are conducted in standard cell culture
incuba-tors with [N2] regulators. All the cell cultures performed
in our laboratory have been routinely tested as negative for mycoplasma contamination and authenticated by cytogenetic tests.
Single-cell capture and single-cell cDNA library preparation
Single-cell loading, capture, and library preparations were performed using the Fluidigm C1 system as described
previously [25]. 5000–8000 cells were loaded onto a medium-sized (10–17μm) C1 Single-Cell Auto Prep IFC (Fluidigm) and the cell-loading script was used according to the manufacturer’s instructions. The capture efficiency was inspected using EVOS FL Auto Cell Imaging system (Life Technologies) to perform an automated area scan-ning of the 96 capture sites on the IFC. Empty capture sites or sites having more than one cell captured were first noted, and those samples were later excluded from further library processing for RNA-seq. Immediately after capture and imaging, reverse transcription and cDNA amplifica-tion were performed in the C1 system using the SMARTer PCR cDNA Synthesis Kit (Clontech) and the Advantage 2 PCR Kit (Clontech) according to the instructions in the Fluidigm user manual. Full-length, single-cell cDNA li-braries were harvested the next day from the C1 chip and diluted to a range of 0.1–0.3 ng/μL. Diluted single-cell cDNA libraries were fragmented and amplified using the Nextera XT DNA Sample Preparation Kit and the Nextera XT DNA Sample Preparation Index Kit (Illumina). Librar-ies were multiplexed at 24 or 48 librarLibrar-ies per lane, and single-end reads of 67 bp were sequenced on an Illumina HiSeq 2500 system.
Immunofluorescence staining and confocal image analysis
Cells were seeded and cultured on Matrigel coated glass-bottom culture dishes (MatTek, 12- or 24-well dishes) for differentiation or treatments. Cultured cells were then washed with PBS and with BD Perm/wash buffer and then fixed with BD Cytofix at 4 °C for 15 min. Cells were then permeablized with 0.2 % TritonX-100 (in PBS) at room temperature for 30 min. Cells were then blocked with blocking buffer (2 % BSA and 1 % FBS in PBS) for 1 h at room temperature followed by staining with primary antibody diluted in blocking buffer at 4 °C overnight. The next day, cells were washed three times with blocking buffer before in-cubated with AlexaFluor secondary antibodies (Invitro-gen, 1:1000 dilutions in blocking buffer) and DAPI for 1 h at room temperature. Cells were then washed three times with blocking buffer and mounted on glass slides (Vectors Labs) for imaging. All the primary antibodies used in this study can be found in Additional file 8: Table S7. Immunofluorescence images were collected using a Nikon A1R laser scanning confocal microscope with Plan Apo 10x, Plan Fluor 20x Ph1 DLL, or Plan Apo 20x DIC M objectives. Images were processed using NIS Elements or ImageJ. Some z-stacks were presented as maximum intensity projection images.
Gene targeting and plasmids construction
Brachyury (T)-2A-EGFP reporter
T-2A-EGFP-PGK-Puro targeting vector (donor vector) with ~480 bp homology arms on each side of the stop
codon was cloned into the targeting vector backbone (modified from Addgene 31938) [75]. FseI and SacI linearized T-2A-EGFP-PGK-Purocassettes were used for gene targeting experiments. All the DNA oligos used in this study are listed in Additional file 9: Table S8. CRISPR/Cas9 mediated gene targeting experiments were performed as previously described [55]. Briefly, H9 cells were individualized with Accutase, washed once with E8 medium, and resuspended in E8 medium with 10 mM HEPES buffer (pH 7.2–7.5) (Life Technologies). For elec-troporation, 2.5 × 10⁶ cell were mixed with 7.5 μg of
pCMV-hCas9 plasmid (Addgene 41815) [56], 7.5 μg of sgRNA construct, and 10 μg of linearized donor DNA template in a total of 500 μL of cell/DNA suspension, transferred to a 4-mm cuvette (Bio-Rad) and electropo-rated with a Bio-Rad Gene Pulser Xcell. Electroporation parameters were 250 V, 500 μF, and infinite resistance. Cells were then plated into Matrigel-coated culture dishes in E8 medium supplied with 10μM ROCK inhibi-tor Y-27632 (Tocris). Medium was changed daily. Puromycin selection was started three to four days after electroporation. Puromycin-resistant colonies were picked five to seven days after drug selection was applied. In the
T-2A-EGFP targeting experiments, clone 39 was verified as correctly targeted clone with normal karyotype and is used for all the subsequent experiments in this study (Additional file 1: Figure S6). For the SOX2-Cherry re-porter, a Cherry-2A-Puro cassette (donor vector) with ~480 bp homology arms on each side of the stop codon was cloned into the targeting vector backbone (modified from Addgene 31939) [75]. FseI and SacI linearized
SOX2-Cherry-2A-Puro cassettes were used for gene targeting performed in the same manner as described above. Cor-rected targeted clones were confirmed by PCR and south-ern blot analysis. Details about the SOX2 gene targeting will be reported elsewhere (Chu et al., in preparation). All vectors and their sequences are available upon request.
The Wave-Crest method
Wave-Crest extends the nearest-insertion algorithm to recover single-cell order following the expression of pre-selected markers in time course scRNA-seq data. Prior to the analyses, we scaled expression within each gene to values with mean 0 and variance 1 to ensure the values across different genes are comparable. Wave-Crest reor-ders cells within each time point by utilizing information from its other time points. Similar to Leng et al. [25], the Wave-Crest algorithm implements an extended nearest insertion (ENI) algorithm to reorder the cells, but with a constraint that cells from different collection time are not allowed to be mixed in the recovered order. The Wave-Crest ENI starts with τ randomly selected cells, one from each time point. These τcells are sorted by the time course order. A τ+ 1 th cell is chosen at
random and inserted into the series of cells. Suppose that this cell is from time pointt1, this forms two candi-date orders–insert this cell between thet1−1 th andt1
th cell in the original order, or between t1th and t1+ 1 th. We evaluate each order using the aggregated mean squared error (MSE) of a polynomial regression. For a given order, the polynomial regression is fitted to the rescaled expression of each gene. For each order, the ag-gregated MSE of a candidate gene group is defined as the summation of the MSEs among all genes of interest. The optimal order of the firstτ+ 1 cells is then selected as the one that minimizes the aggregated MSE. This process is repeated to insert the τ+ 2 th cell and so on, until all cells are considered. A 2-opt algorithm is then applied to avoid finding local maxima and to refine the global expression profile [54]. Evaluation of the ENI al-gorithm and the 2-opt alal-gorithm may be found in Additional file 1: Supplementary Results and Figure S8e. Wave-Crest also incorporates a detection step to further identify genes with a smooth profile following the recon-structed pseudo-time, which we called “fishing”. This detection (fishing) step again utilizes polynomial regres-sion. For a gene g, we reorder its rescaled expression fol-lowing the recovered order, fit a polynomial curve, and calculate its gene-specific MSE (observed MSE). A per-mutation test is then conducted to determine the good-ness of the fit by comparing the observed MSE to a large group of simulated genes. To generate a permuted gene, we randomly pick a gene from the full set of genes under consideration and permute its cell order, fit a polynomial regression as above and calculate the MSE of the permuted gene. The MSE distribution of the per-muted genes is then used to make inference about the MSE distribution under the null hypothesis (no expres-sion change associated with the reconstructed cell order). An empirical gene’s permutation p value is then calculated as #permuted MSE≤#permuted MSEobserved MSE, where the ob-served MSE indicates the g’s MSE based on the recon-structed order. Genes with small permutation p values are considered detected. Wave-Crest is available as an R package, freely available at (https://github.com/lengning/ WaveCrest). The softwares are licensed under the terms of the Apache License 2.0. A graphical user interface is also provided (Additional file 1: Figure S10), which al-lows users with little computational background to per-form the analysis.
In the DE differentiation time course analysis de-scribed in this manuscript, the ENI algorithm and 2-opt algorithm were applied on 758 cells across six time points (0 h, 12 h, 24 h, 36 h, 72 h, and 96 h). Genes whose median expression is less than 10 were omitted. The fishing step was applied on the 172 cells collected at 36 h of differentiation (following the ENI reconstructed
cell order). A total of 2178 transcriptional regulators were considered in this fishing step (Additional file 5: Table S4). We defined the top genes with expression trend within 36 h by taking the ones with small MSE in the polynomial fitting along these 172 cells. The genes were further classified into upregulated and downregu-lated groups by their expression trend along the recovered order of these 172 cells. The two groups were defined by the sign of the slope coefficient in gene-specific linear fit-ting. The genes with positive (negative) slope coefficient were defined as up- (down-) regulated from early-36 h cells to late-36 h cells. A total of 100,000 permutations were conducted in the permutation test.
Reverse transcription (RT) and qPCR analysis
All procedures were performed as described previously [76]. Total RNAs were purified using RNeasy kits (Qia-gen) with either on-column DNase treatment or gen-omic DNA removal columns. Between 100 ng to 500 ng of purified RNAs were reverse transcribed with SuScript VILO Master mix (Life Technologies). To per-form TaqMan qPCR reactions (10 μL total volumes), 1 μL of the cDNA was subsequently used in each of the triplicate qPCR reactions with individual 1× TaqMan Gene Expression assays and 1× TaqMan Universal PCR Master Mix II (Life Technologies). qPCR was performed using ViiA™ 7 System and data analysis was performed using ExpressionSuite™ (all from Life Technologies). All TaqMan Gene Expression assays are from Life Tech-nologies and are listed in Additional file 9: Table S8.
siRNA knockdown experiments
All the siRNA are from ON-TARGETplus siRNA
SMARTpool (Healthcare/Dharmacon), listed in Additional file 10: Table S9. siRNA were dissolved in 1 × siRNA buf-fer and stored as 16μM stock in –80 °C. One hour after cells were plated for differentiation, a final concentration of 50 nM of each siRNA pool was transfected with RNAi MAX with OPTIM-DMEM following manufacture’s proto-cols (Life Technologies). Each gene knockdown was per-formed with at least two replicates of experiments. FACS analysis was performed to measure the percentages of CXCR4+and EGFP+cells for each gene knockdown at 42– 48 h post differentiation. The Differentiation Score is calcu-lated as the (% of CXCR4+cells)/(% of T-2A-EGFP+cells). The score obtained from non-targeting control siRNA (as transfection control, arbitrarily set to 1), was used to normalize all the results obtained from individual gene-specific siRNA transfection experiments.
PiggyBac vector construction andKLF8overexpression clones
The cDNA of KLF8was obtained from GeneCopoeia as Gateway Entry vectors (GC-T1091), and was subsequently
cloned into a PiggyBac Gateway Destination vector using Gateway LR clonase (Life Technologies), placing KLF8 downstream of a DOX-inducible promoter (
pB-TetO-KLF8) as previously reported [57]. A separate PiggyBac vector encodingpEF1a-rtTA-IRES-Purocassette (DOX-re-sponsive transactivator along with puromycin resistance gene) was co-electroporated with pB-TetO-KLF8 and
CMV-hyPBase plasmids or hyPBase mRNA. For electro-poration, 2.5 × 10⁶of H9-T-2A-EGFP reporter cells were mixed with 30.0 μg ofpB-TetO-KLF8 plasmid, 1.5μg of
pEF1a-rtTA-IRES-Puroplasmid, and 1.5μg of
CMV-hyP-Basein a total of 500 μL of cell/DNA suspension, trans-ferred to a 4-mm cuvette (Bio-Rad), and electroporated with a Bio-Rad Gene Pulser Xcell. Electroporation param-eters were 250 V, 500 μF, and infinite resistance. Cells were then plated into Matrigel-coated culture dishes in E8 medium supplied with 10 μM ROCK inhibitor Y-27632 (Tocris). Medium was changed daily. Puromycin selection (1.0 μg/mL) was applied three days after electroporation. Puromycin-resistant colonies were picked approximately seven days after drug selection was applied. Three inde-pendent clones with the most uniformed expression of
KLF8upon DOX treatment (2.0μg/mL) were selected for subsequent experiments. The vectors and their sequences are available upon request.
Bulk RNA-seq library construction
Bulk RNA samples were collected at the time when the sin-gle-cell samples were processed. Cell pellets were lysed in Buffer RLT (Qiagen) and stored in–80 °C until RNA isola-tions. Total RNA of each cell type was purified using the RNeasy Kit (Qiagen). cDNA libraries were prepared and indexed with Illumina’s TruSeq RNA Sample Prep Kit v2 and sequenced on Illumina’s HiSeq 2500 system with 4–6 indexed samples per lane with 51 bp single-end reads.
Read processing and mapping
Reads were mapped via Bowtie 0.12.8 [77] against the hg19 RefSeq reference (“NM_” designated genes and mitochondrial genes from the Illumina iGenomes anno-tation). The mapping allows up to two mismatches and up to 20 multiple hits. The expected counts and TPMs were quantified via RSEM 1.2.3 [78].
Bulk data–snapshot of progenitor cell types
A total of 19 bulk samples from seven cell types were se-quenced: duplicates for DEC, NPC, and TB; triplicates for H9, EC, and HFF; and four replicates for H1. The bulk RNA-seq data were normalized by median-by-ratio normalization.
scRNA-seq data–snapshot of progenitor cell types
In total, seven cell types were considered. Cells hav-ing fewer than 5000 genes with TPM >1 were
removed in quality control. A total of 1018 cells passed the quality control. In more detail, 212, 162, 138, 105, 159, 173, and 69 cells were considered in H1, H9, DEC, EC, HFF, NPC, and TB, respectively. The scRNA-seq data were normalized by median-by-ratio normalization. Genes with potential ordering ef-fect (OE) were removed prior to downstream ana-lyses. The OE genes were detected using OEFinder [79]. A gene is called OE if it has an OEFinderpvalue
≤0.01 in at least one cell type. A total of 392 OE genes were removed in various cell type datasets.
Bulk data–time course experiment
Triplicates were sequenced from each of the six time points–0 h, 12 h, 24 h, 36 h, 72 h, and 96 h. The bulk RNA-seq data were normalized by median-by-ratio normalization.
scRNA-seq data–time course experiment
In total, six time points were considered. Cells having fewer than 5000 genes with TPM >1 were removed in quality control. A total of 758 cells passed the quality control. In more detail, 92, 102, 66, 172, 138, and 188 cells were considered in 0 h, 12 h, 24 h, 36 h, 72 h, and 96 h, respectively. The scRNA-seq data were normalized by median-by-ratio normalization. Genes with potential OE were removed prior to downstream analyses. A total of 536 OE genes were removed in the time course dataset.
Bulk-supervised PCA
Previous publications showed that directly perform-ing PCA on sperform-ingle-cell data may capture unwanted noise [80]. Therefore, bulk-supervised PCA were conducted to investigate differences between differ-ent cell types in the following manner. Denote the
normalized bulk RNA-seq expression of gene g in
sample s as Ygs. Prior to PCA analysis, for each gene
g, the bulk RNA-seq expression values were rescaled to values with mean 0 and standard deviation 1 (de-note as Ỹgs). Similarly, denote normalized scRNA-seq expression of gene g in cell j as Xgj and denote the rescaled data as X~jg. We applied PCA on the rescaled bulk RNA-seq data and obtain loadings of PCs. Denote loading of gene g in PC n as Wgn. The bulk-supervised PCA transformed data of cell j in PC n is then calculated as XgWngX~jg.
Differential expression analysis in scRNA-seq time course data by SCPattern
SCPattern was used to identify genes with expression changes in the scRNA-seq time course data. For each