Visualization of Software Architectures in Virtual
Reality and Augmented Reality
Andreas Schreiber German Aerospace Center (DLR)
Linder H¨ohe 51147 K¨oln, Germany [email protected]
Lisa Nafeie
German Aerospace Center (DLR) Linder H¨ohe
51147 K¨oln, Germany [email protected]
Artur Baranowski German Aerospace Center (DLR)
Linder H¨ohe 51147 K¨oln, Germany [email protected] Peter Seipel
German Aerospace Center (DLR) Linder H¨ohe
51147 K¨oln, Germany [email protected]
Martin Misiak
TH K¨oln—University of Applied Sciences Betzdorfer Straße 2 50679 K¨oln, Germany University of W ¨urzburg Sanderring 2 97070 W ¨urzburg, Germany [email protected]
Abstract—Software architecture is abstract and intangible. Tools for visualizing software architecture can help to comprehend the implemented architecture but they need an effective and feasible visual metaphor, which maps all relevant aspects of a software architecture and fits all types of software. We present the visualization of component-based software architectures in Virtual Reality (VR) and Augmented Reality (AR). We describe how to get all relevant data for the visualization by data mining on the whole source tree and on source code level of OSGi-based projects. The data is stored in a graph database for further analysis and visualization. The software visualization uses an island metaphor, which represents every module as a distinct island. The whole island is displayed in the confines of a virtual table, where users can explore the software visualization on multiple levels of granularity by performing navigational tasks. Our approach allows users to get a first overview about the complexity of an OSGi-based software system by interactively exploring its modules as well as the dependencies between them.
T
ABLE OFC
ONTENTS1. INTRODUCTION. . . .1
2. SOFTWAREVISUALIZATION. . . .2
3. DATAMINING . . . .2
4. VISUALMETAPHOR . . . .3
5. VISUALIZATION INVIRTUALREALITY. . . .6
6. VISUALIZATION INAUGMENTEDREALITY. . . .7
7. EXPLORATION OFSOFTWARESYSTEMS. . . .8
8. RELATEDWORK . . . .9 9. CONCLUSION. . . 10 ACKNOWLEDGMENTS. . . 10 REFERENCES. . . 10 BIOGRAPHY. . . 11
1. I
NTRODUCTIONSoftware is abstract and intangible but with increasing func-tionality, its hidden complexity grows and hinders its further development. Visualization techniques, that map intangible software aspects onto visually perceivable entities, help to
978-1-5386-6854-2/19/$31.002019 IEEEc
understand software systems and to reduce their costs of development [1].
Classic software architecture visualizations, such as UML diagrams, are widely used in practice but are not always the best solution. For example, to get an high level overview of large component-based software systems more abstract or more interactive visualizations might be feasible. We show how useful it is, to choose a suitable technology for soft-ware visualization in order to understand complex softsoft-ware architectures, how software visualization can help during the development, and what are the resulting benefits for software developers, maintainers, and project managers.
As an example, we describe the software ISLANDVIZ, which allows to visualize component-based software architectures in Virtual Reality (VR) and Augmented Reality (AR). IS
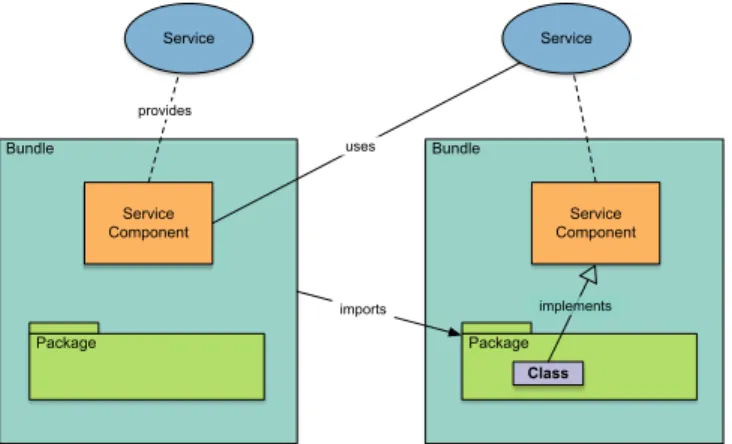
-LANDVIZvisualizes OSGi-based software systems (Figure 1) using an island metaphor, where islands on a virtual water level or the desk represents OSGi bundles, regions on the islands represents packages, and buildings represents classes. We describe how to get all relevant data for the visualiza-tion by repository mining on the whole source repository and data mining on source code level. We store all data in a graph database for further analysis and visualization. Through software visualization we are able to answer many questions, which already takes a lot of time in development and test-phases. In addition, it’s possible to make the software architecture tangible, which makes it easier to talk about tech-nical problems within teams formed by people with different technical knowledge, communications skills, and educational backgrounds.
The hardware platforms that we use for implementation and testing of ISLANDVIZ are standard consumer headsets (i.e, head-mounted displays). For VR, we use the devices OCU
-LUS RIFT and HTC VIVE, where we also use the stand-alone headset OCULUSGOto be able to use the visualization without any connected laptop and an eye-tracking-enabled version of HTC VIVE(Tobii eye-tracking) for our upcoming user studies. For AR, we use the MICROSOFT HOLOLENS
headset.
We use software visualization on real DLR software sys-tems from the aerospace domain: The distributed integration environment RCE (Remote Component Environment) [2],
Bundle Package Bundle Package Class imports Service Service Service Component Service Component provides uses implements
Figure 1. Bundles, services, service components, and their dependencies in OSGi.
[3], which is used for design, simulation, and evaluation of systems, and VIRSAT (Virtual Satellite) [4], [5] for model-based design and simulation of satellites.
In the remaining paper, we present our contributions on visualizing OSGi-based software systems as follows: 1) A brief overview about software visualization as back-ground information (Section 2).
2) Description of our data mining approach for extracting all relevant information from source code repositories and storing them in a graph database (Section 3).
3) Description of the visual metaphor of islands for visual-izing software architectures, which we introduced in earlier work [6], [7] (Section 4).
4) Some details on the particular implementations of the island metaphor for VR (Section 5) and AR (Section 6). 5) An example for exploring a large OSGi-based software from aerospace (Section 7).
2. S
OFTWAREV
ISUALIZATIONSoftware visualization is a very large research field. Existing work can be classified based on multiple categories. A dif-ferentiation between static and dynamic aspects of a software can be made. While dynamic aspects capture information of a particular program run, static aspects are valid for all execu-tion paths of a software. Addiexecu-tionally, they can be extended to capture the entire evolution of a software architecture. Software visualization can be made on roughly three different levels of abstraction [8]. While the lowest abstraction level deals with the source code, the highest abstraction level deals with the entirety of the software architecture and belongs to the most important in software visualization [9]. They convey the underlying hierarchical component structure, the relation-ships between these components and the visual representation usually contains some form of code quality metrics.
A software visualization can consist of one or more views. Each view can use its own visualization approach and can therefore focus on different aspects of the software. Multi-view, as opposed to single-view approaches, can represent a broad range of information of varying granularity levels,
however at the cost of imposing a significant cognitive burden and making a communication on common grounds between users more difficult [10].
Visualizations can be made in the two dimensional and three dimensional space. While 2D visualizations are easier to navigate and interact with, they do not scale particularly well for large data sets. To avoid a cluttered view, 2D visualizations rely on multiple views. 3D approaches resort to the added dimension to increase the information density of the visualization, without exposing the user to any additional cognitive load, as the task of processing 3D objects is com-pletely shifted to the perceptual system [11]. They are more effective at identifying substructures and relationships be-tween objects [12], [13] and represent real-world metaphors more closely.
Some examples of real world metaphors are:
1)Solar System Metaphor: A metaphor developed to visu-alize a Java based project [14]. Each package is mapped to a sun, which is being orbited by several planets at different or-bits. While the planets represent classes, the orbits represent the inheritance level within a package. The size of each planet is mapped to the number of lines of code in its underlying class and the color helps to differentiate between classes and interfaces.
2)City Metaphor: It is one of the most frequently used real-world metaphors for software visualization. The foremost reason for its popularity would be the familiarity of the city concept. Most users know that a city can be organized into districts, where each district can contain multiple buildings. These three hierarchical levels are the basis for most imple-mentations of the city metaphor.
3. D
ATAM
ININGWe analyze Java projects that are based on the OSGi frame-work. This framework modularize and manage software projects and their services (Figure 1). OSGi projects in-cludes bundles. Each bundle is a JAR archive with a
MANIFEST.MFfile, which describes different informations
such asdependenciesandservices.
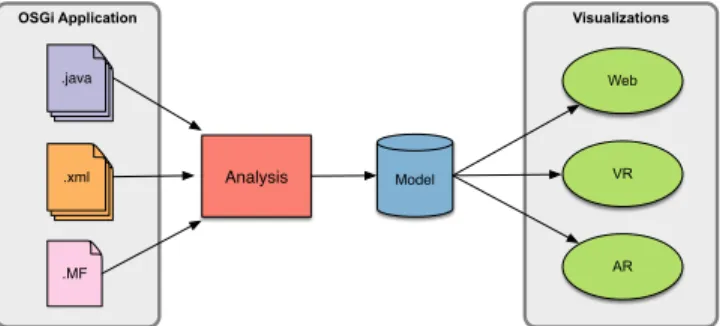
We analyze OSGi-based projects by extracting all relevant information from the source code repository. The information from all Java files, MANIFEST.MF files, and XML files are stored in an intermediate data model. The different visualization implementations retrieve the information from the data mode and transforms it into their respective visual representations for the Web (2D), VR, or AR (Figure 2 [15]). We used the open source quality assurance toolJQASSIS
-TANTas a basis for acquisition of all relevant data from the source code repository. JQASSISTANT relies on the graph database NEO4J.JQASSISTANTscans and analyzes software projects [16] as follows (Figure 3):
1)Scanning: JQASSISTANT scans software artifacts either by using the Maven plug-in or the command line tool. We use command line tool to scan the source tree, which includes archives of all compiled software fragments. We focus on scanning projects that are based on the OSGi framework, where XML files in OSGI-INF directories are important for declarative service dependencies. Therefore we use the
JQASSISTANT XML plug-in for all XML files at a specific directory (configuration filescan.properties) and
acti-OSGi Application Model .MF .java .xml Visualizations Analysis Web VR AR
Figure 2. General overview about the data mining and visualization process for OSGi-based applications.
Data Mining Repository git OSGi Application Graph Database Neo4j .MF Java XML Visualization VR IslandViz Unity3D / C# Devices Oculus Rift / HTC Vive Scanning and Analysis JQAssistant
Figure 3. Architecture of the software stack from repository mining to virtual reality visualization.
vated scans forpom.xmlfiles only.
2)Analyzing: After scanning the project,JQASSISTANT an-alyzes the data with plug-ins, which are implemented using the CYPHER graph query language. JQASSISTANT already provides different plug-ins, for example, for JSON, XML, or OSGi. We extended the OSGi plug-in and added addi-tional rules for OSGi structures, which creates nodes and relationships for OSGi elements in the graph database, and for analyzing if the scanned projects violates certain software structures.
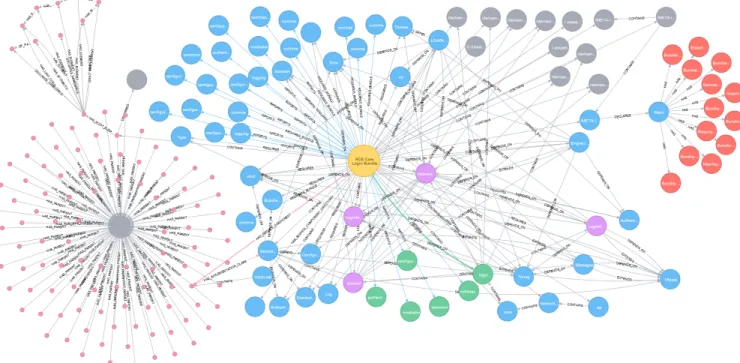
After scanning the repository and applying all rules, the soft-ware architecture information with all relevant elements of OSGi is stored in the graph database (Figure 4). With suitable graph queries using NEO4J’s query language CYPHER on the database, we can use this data to analyze the source code (e.g., for dependency analysis, hotspot analysis, test coverage analysis, or static code analysis). Our visualizations of OSGi elements in VR and AR (Sections 5 and 6) use spe-cific queries to extract all information, which are visualized. The following CYPHER query is the most straight forward approach to collect all data for the visualization:
MATCH
( p f : P a c k a g e F r a g m e n t )−[ c : CONTAINS]−>
( cu : C o m p i l a t i o n U n i t ) , ( )−[ e : EXPORTS]−>() , ( )−[ i : IMPORTS]−>() ,
( )−[ h s : HAS SERVICE COMPONENT]−>() , ( )−[ h i : HAS IMPLEMENTATION CLASS]−>() , ( )−[ p s : PROVIDES SERVICE ]−>() ,
( )−[ h f h : HAS FRAGMENT HOST]−>() , ( )−[ hba : HAS BUNDLE ACTIVATOR]−>() , ( )−[ r b : REQUIRES BUNDLE]−>()
RETURN p f , c , cu , e , i , hs , h i , ps , h f h , hba , r b
4. V
ISUALM
ETAPHORThe visualization metaphor has to be expressive enough to provide mappings for all relevant software artifacts [17]. In the case of OSGi-based software, the metaphor needs to account for the following artifacts: class types, packages,
bundles,service components, andservice interfaces. We are interested in the import and export relations of individual bun-dles, as well as the referencing and providing relationships between service components and their respective interfaces. The metaphor must enable a software inspection on multiple abstraction levels, however its main emphasize should be the bundle layer, as it forms a central aspect of OSGi.
We use an island metaphor for the visualization of OSGi-based software systems (Figure 5). The entire software sys-tem is represented as an ocean with many islands on it. Each island represents an OSGi bundle and is split into multiple regions. Each region represents a Java package and contains multiple buildings. The buildings are the representatives of the individual class types which reside inside of a package. Each region provides enough space to accommodate all of its buildings without overlapping, and hence the overall size of an island is proportional to the number of class types inside of a bundle.
The island metaphor provides a hierarchical structure with three different levels (island, region, and building). The navigation between these layers should be based on our natural understanding of spatial relationships and be therefore dependent on the relative size of the elements in the users view frustum. Hence, the transition between the levels happens implicitly, as the user moves closer or further away from an element, or the element itself is scaled. This avoids the introduction of additional complexity into the navigation. The metaphor is flexible enough to be extended for more than three abstraction levels. Individual island groups can form archipelagos, which would provide an additional abstraction level. In the opposite direction, each island region could be interpreted as a country, which would open up even more possible hierarchical subdivisions.
The islands metaphor has several advantages for software visualization. Islands express the aspect of decoupled enti-ties, coexisting in the same environment very clearly, which makes them a good candidate for representing software mod-ules. Additionally, islands can be relocated at run-time, while maintaining a certain plausibility. A software evolution visualization could benefit from this property, as the island movements would reflect the dependency changes within the system.
The islands of our visualization metaphor are aimed at having a high resemblance to their real-world counterparts and in thus, emphasizing the plausibility of the metaphor. Each region represents a package and has an irregular, rugged shape, similar to countries when seen on a map. These regions share borders, and together, they determine the shape of the island (Figures 6 and 7). The individual cells of a region are designed to provide enough accommodation area for buildings to be placed on top. To maximize their perceivability from afar a multi-storey building representation is chosen. For the implemented prototype, aLines of Code
metric was chosen, where for everynlines of code, a storey is added to the building.
Figure 4. Visualization of the graph data for one single OSGi bundle (“RCE Core Login Bundle”) and all dependent nodes.
Figure 5. Island metaphor: a) Bundles are represented as islands. b) Packages are represented as regions. c)
Class types are represented as buildings d) Package imports and exports are represented with the help of
ports.
Island Construction
The island construction is based on claiming cells in a Voronoi diagram (analogous to the work of Yang et al. [18], while we use a Voronoi diagram instead of a hexagonal grid as the underlying tile structure). Additionally, no hierarchi-cal claiming is performed, as all regions of an island are considered equivalent. This reflects the way packages are interpreted by Java, as the hierarchical naming convention is only relevant from a developers perspective.
Figure 6. (left) A minimal cohesion factor leads to very rugged islands with many holes. (middle) A very high
cohesion factor reduces holes greatly and creates compact islands. (right) Our dynamic cohesion factor,
combined with the claiming of large regions first, the island preserves some of the ruggedness, yet it minimizes
holes.
Figure 7. A range of different coast shapes, created with specific height profiles.
The first step in the construction is to create a Voronoi diagram from a point distribution. The most aesthetically pleasing islands were achieved with points exhibiting a blue noise characteristic. In the next step, each package claims multiple cells of the created Voronoi diagram, corresponding to the number of contained classes. Cells are claimed one at a time and only cells next to already existing entities can be claimed.
To create rugged and irregular shapes for the package repre-sentations, cells are selected probabilistically. To avoid non-continuous regions induced by a random selection mecha-nism, we use an estimating function as described by Yang et al. [18].
Before a new tile is selected, each eligible cell counts its already claimed neighbors. If a cell is surrounded with n
claimed neighbors, the probability of it being a hole grows withn. A scoreSnis calculated for each candidate, based on
Sn=bn (1)
wherebis a user definable cohesion factor. Once the scores are known, a new cell can be selected, where the probability of each candidate is directly proportional to its score Sn.
Higherbvalues result in less holes, but also more regular and compact shapes.
To preserve the rugged appearance of an island, we use a simple extension of the cohesion factor. Definingbmin and
bmax, the cohesion factor can be varied on a per region basis, depending on their size. While the smallest region is assignedbmin, the cohesion factor is interpolated towards
bmaxfor larger regions. Additionally, the regions are claimed in descending order, starting with the largest package first. This results in islands which contain smaller, irregular regions at their edge, while the larger, more regular regions reside in the interior (Figure 6 right). From an usability perspective, this layout is more advantageous for VR based interaction, as smaller regions are harder to select when surrounded by larger ones.
Once all packages have claimed their cells, the coast area can be added. This is done by claiming neighboring cells of the existing island boundary. Each time the boundary is expanded outwards a new height value is associated with its cells. A user defined height profile controls this process (Figure 7), where each entry expands the coast by one cell and assigns the stored height value. In the final construction step, a polygonal mesh is generated from all claimed cells in the Voronoi diagram using triangulation.
Visualization of Dependencies
Dependencies Between Modules—Due to the
architecture-oriented focus of our software visualization, dependencies between individual modules are important. Building on the island metaphor, animport portand anexport portis added to each island. These ports are situated along the coast line and manage the incoming and outgoing dependencies. We use the following two orthogonal types of visualization approaches: 1)Explicit Visualization Building on the simplicity of straight lines, we us import and export arrows (Figure 9) to explicitly visualize the package dependencies between bundles. In the geographic context, such arrows are en-countered in flow maps [19] and visualize the movement of various resources or entities, from one point to another, while the arrow width is proportional to the moved volume. The resulting dependency visualization resembles a discrete flow map, as implemented by Tobler [20]. To reduce the intersection problem of straight lines, the arrows follow a vertical arc. The start and end points are at the height of a port, while towards the middle segment the height increases, reaching its maximum halfway between the anchor points. The arrows maintain throughout a constant curvature. As a result, longer arrows also span a greater height range. A color gradient, together with the arrow head indicate the
Figure 8. Island placement based on a force-directed layout algorithm: Islands with the highest dependencies are accumulated in the middle, while independent islands
are pushed outwards.
Figure 9. Package dependencies are visualized via arced arrows. The island on the right imports packages from
the island on the left.
dependency direction. The width is mapped to the number of packages which are being imported or exported over the given connection.
2)Implicit Visualization We use the island adjacency to implicitly represent the dependency strength (Figure 8). The island layout is computed with an iterative, force-directed graph layout algorithm [21], where nodes are interpreted as particles that are influenced by attractive and repulsive forces from other particles. These forces are accumulated and applied to each particle at the end of the iteration. Attractive forces are exerted between nodes, which are connected by an edge. The force is dependent on the distance between the two nodes.
Visualization of Service Dependencies—The main entities
of the OSGi service layer areservice interfacesandservice
components. As these components are linked to Java class
types, we visualize them as special building types. We visualize the relationships between the service entities with
a service connection node. These nodes hover above the
service interface and service component buildings at a certain height and act as connection points for them. Each node has a visual downward connection to its parent building in order for the user to quickly locate its associated service entity (Figure 9 left). There are three distinct types of nodes:service interface nodes,service provider nodes, andservice reference nodes. They are assigned to different service slices, where each slice resides at a specific height (Figure 9 right).
Figure 10. Left: Service components (orange) and service interfaces (blue) are represented as different building types. The are connected with the help of service
interface/provide/reference nodes (blue sphere, green capsule, red cube). Right: Service groups are distributed
across individual height layers.
5. V
ISUALIZATION INV
IRTUALR
EALITYAlthough the entire software visualization is displayed in the compounds of the table, the enclosing room plays an important role. To maintain the plausibility of all “magic” interactions the table is capable of, a futuristic design is chosen, where the table is augmented with holographic func-tionality. With the software visualization interpreted as a hologram, the room for plausible interactions is very large. This functionality is implemented by simply discarding all rendered fragments of the software visualization, that ex-ceed the table radius. When designing the environment, we avoided introducing an excessive brightness contrast. This helps in minimizing the “godray” effect, attributed to the used Fresnel lenses.
Virtual Table
The software visualization is presented on top of a virtual table. The entire content of the visualization is confined to the extents of the table. In contrast to real-world scale visualiza-tions, which are more likely to cause a feeling of presence of being inside the data, the table metaphor allows a more strate-gic and analytic view of the data. Although the table size may vary based on user preference, the metaphor itself imposes a restriction on the size of the visualization space. However this limitation is not a disadvantage, since it enforces to show the visualization in a space saving representation. While it can be helpful to see the fine grained details of software artifacts, it is the higher abstraction levels which contribute mostly to program and architecture comprehension.
The virtual table metaphor provides a transparent transition between individual abstraction levels, as the user does not experience any relocation, since only the visualization in the confinements of the table has to be changed without altering the virtual room around it. This reduces user disorientation and motion sickness, as the room always provides a stable frame of reference [22], [23]. This is especially important for the usability of the system for software comprehension, as users can stay longer immersed in the virtual environment without interrupting their train of thought.
Interaction and Navigation
To enable the user to fully focus on software comprehension, the cognitive load introduced by navigating and interacting with the virtual environment must be minimal. This requires both activities to be intuitive and natural. We build upon the available positional information of the input devices and integrate all interaction possibilities into the environment
Figure 11. Interaction and navigation in VR: (top) Translation. (middle) Scale. (bottom) Rotation.
itself. This reduces the reliance on various button presses and keeps the user interface simple.
Due to the use of virtual reality and its inherent navigational advantages, the user can walk around the virtual table and inspect the visualization from different perspectives. How-ever this navigational freedom has its limits when inspecting elements up close, as the human visual system has a limit to the distance it can focus on and fuse a stereoscopic image. Therefore it is crucial to be able to additionally manipulate the visualization itself.
The displayed island system has great resemblance to a carto-graphic map. Similar to other digital maps, our navigational technique providestranslation,rotation, andscaling[23]. We constrain the rotation to one axis (Figure 11 bottom). The scaling operation is especially important, as zooming is di-rectly tied to the transition between the individual abstraction layers of the software architecture. This mode of navigation basically follows a level of detail scheme, where the elements belonging to a specific layer can be interacted with, as soon as they are large enough for the user to see and select. The visualization can be translated along the axis defined by the table plane. This usually results in left, right, forward, and backward panning, while the translation in the height dimension given by the table normal is prohibited. To apply the translation, the user grabs the visualization and drags it in the direction he wishes to translate, releasing it again when finished.
To perform rotation and scaling, the visualization needs to be grabbed with both controllers. To rotate the visualization, both controllers are moved in a circular motion around a pivot point.
Virtual Tablet
While world space anchored text labels are good for dis-playing object names, they are not suitable for the display of larger amounts of text. However such a functionality is
Figure 12. To activate the virtual tablet, the underside of the controller is rotated into the users field of view, providing access to additional textual information and
functionality.
greatly needed, as some information are best presented in their textual form.
A virtual tablet can be anchored somewhere in the
envi-ronment. When the user interacts with diverse elements, additional information is displayed on this tablet (Figure 12). We anchor the display to the virtual body of the user. The panel is attached to the non-dominant hand of the user, so it can be interacted with, by use of the dominant hand (i.e, a “double-dexterity” interface [24]). To avoid unnecessary occlusion and unintentional interactions, the virtual tablet is disabled per default and has to be explicitly activated by the user. This is done by turning the underside of the controller, or the palm of the hand, towards the user.
Implementation
The original implementation [25], [7] of the VR visualization uses UNITY3D and C# and reads the data from a JSON file [15]. We extended this implementation to use data directly from the NEO4Jgraph database (Figure 3).
6. V
ISUALIZATION INA
UGMENTEDR
EALITYIn context of software architecture visualization, AR [26] solutions can have advantages over comparable VR appli-cations. They usually provide see-through visors, which allow for an unobstructed view of the surrounding real-world environments. This way, classical desktop interfaces with text-based code-editing tools can be used in combination with immersive AR devices. Moreover, peers can commu-nicate seamlessly when exploring software visualizations in AR collaboratively, because verbal and non-verbal means of communication remain intact.
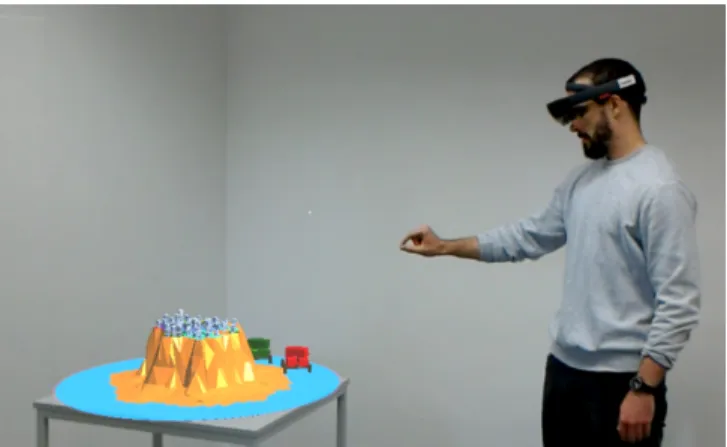
Our approach for AR employs the island metaphor (Sec-tion 4) for visualizing OSGi-based software architectures very similar to the VR visualization. Within the confines of a virtual tabletop, a software system is represented as an archipelago. Software artifacts can be explored at different levels of granularity (Figure 13). At the highest level, bundles are mapped to individual islands. Islands are divided into multiple regions, representing the packages within a bundle. Finally, each compilation unit contained in a package is represented as building within a corresponding region. The size of an island is proportional to the number of a bundle’s compilation units, ensuring all buildings can be accommo-dated without overlapping.
Figure 13. Levels of granularity in AR.
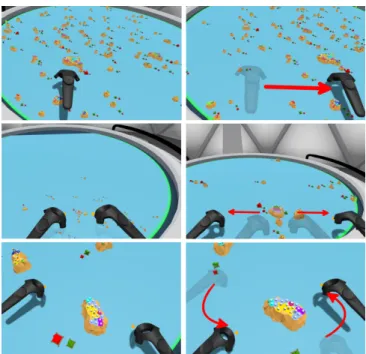
Figure 14. Interaction with gestures in AR: selecting a bundle with an “Air-Tap.”
Interaction and Navigation
We use a state machine, combining HoloLenses three main input modalities gesture, voice, and gaze, to provide a context-sensitive interface governing the possible interactions depending on the applications current state.
Gesture interaction—The gesture control component enables both one-handed and two-handed input. By performing an “Air-Tap”-Gesture2(Figure 14), a bundle can be selected. A selected bundle is enclosed by a green wire-frame, giving the user visual feedback about the selection (Figure 15(a)). An information panel appears, giving the user bundle-specific information (Figure 15(b)). By focusing the gaze-cursor on the virtual tabletop and performing a “Tap-and-Hold”-Gesture, the archipelago can be navigated. By performing a two-handed “Tap-and-Hold”-Gesture and dragging the hands apart, the visualization can be zoomed.
Voice Control—To enable voice control without using
com-mands based on keywords, we implemented a natural lan-guage understanding component consisting of two parts. The first parts task is to convert a natural language string into a user command [27]. This is implemented by using the RASAchatbot library [28]. First the natural language string is processed by RASA NLU, to extract the intent and the entities. Based on these detected values the RASA Core component creates a query for a graph database NEO4J. For simple intentions there is also the possibility to avoid building a query and returning a command name instead. To exonerate the HoloLens from additional processing overhead, this service is implemented as a web server application. The
2https://docs.microsoft.com/en-us/windows/
(a) (b)
Figure 15. Information for a selected bundle: (a) Selected bundle enclosed by a green wire-frame; (b)
Information panel with metrics about the bundle;
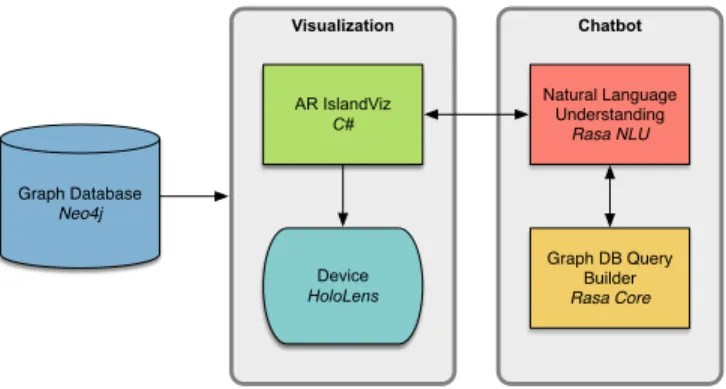
Chatbot Graph Database Neo4j Visualization AR IslandViz C# Device HoloLens Natural Language Understanding Rasa NLU Graph DB Query Builder Rasa Core
Figure 16. Software Stack for visualization in AR.
second part contains the speech-to-text process. It sends the converted string as a request to the server described above and processes the server’s response. This means a command is performed on the HoloLens. Depending on this command either the database is queried, or a basic function is triggered.
Collaboration
Using the Mixed Reality Toolkit’s sharing API, application states can be shared over multiple devices. Like this, we enable collaborative exploration of software architectures. Based on the visualizations, co-located peers can discuss design decisions or introduce new colleagues to the project. For the purpose of this demo, we use a simple collabora-tive technique, where only one user at a time can perform interactions. As long as a user performs an interaction, all other users are temporarily blocked from interacting with the system.
Implementation
The Microsoft HoloLens is an optical see-through head-mounted mobile system. As such, it features an array of sensors, enabling it to capture gesture and voice input. More-over, it is capable of tracking its position and orientation in 3D space. The standard runtime environment for HoloLens applications is the Universal Windows Platform (UWP). The Unity3D game engine provides specific tools for UWP devel-opment. Additionally, the Mixed Reality Toolkit3 (MRTK) for Unity offers a collection of scripts to help HoloLens application development in Unity3D.
First, we extract all relevant pieces of information regarding
3https://github.com/Microsoft/
MixedRealityToolkit-Unity
Figure 17. The DLR distributed integration and simulation environment RCE (Remote Component
Environment).
a particular software project into a JSON file [15]. On the HoloLens, this file is read into an in-memory data struc-ture. It can be queried hierarchically and used to retrieve and reconstruct the OSGi project. Subsequently, based on the number of packages and compilation units contained within each bundle, island structures and their positions are calculated. Each island is assigned an individual Voronoi diagram. Regions are formed by iteratively claiming cells from that diagram. Finally, based on the calculated island structures, we generate the island polygon meshes and all objects contained, such as buildings and regions.
7. E
XPLORATION OFS
OFTWARES
YSTEMSAt DLR, many software systems are developed [29]. Of these systems, some are developed in Java based on the Eclipse Rich Client Platform (RCP) and OSGi. For evaluation of our software visualization approaches we choose the integration and simulation environment RCE.
Remote Component Environment (RCE)
For the execution of multi-disciplinary design and optimiza-tion (MDAO) workflows, DLR develops the software system RCE (Remote Component Environment; [2], [3]). RCE is an open source, workflow-driven, distributed integration environment. It supports the design and execution of scien-tific and engineering workflows. RCE is especially designed and suited for multidisciplinary collaboration where different groups or organizations benefit from integrating their specific tools into larger simulation workflows. So far, it has been primarily used in preliminary aircraft design [3], but also for design of launcher vehicles [4] and the optimization of thermal management of spacecraft (Figure 17) [30].
Some basic metrics of RCE as of version 8.2.2 are: it has 255OSGi bundles and3126Java classes. These bundles and classes provide169 OSGi services. The software consists of 5588 files in 3292 folders. Applying the data mining with JQASSISTANT (Section 3) leads to 1749211 nodes
(MATCH (n) RETURN count(n)) and 6478780
rela-tions (MATCH ()-->() RETURN count(*);) in the NEO4Jgraph database.
To explore the software system, one can start the visualization and view the whole table with bundles (i.e., islands). The user then can zoom and pan through the islands and select bundles of interest by pointing or tapping on it. The information panel (virtual tablet) shows additional information or metrics for the
(a) (b)
(c) (d)
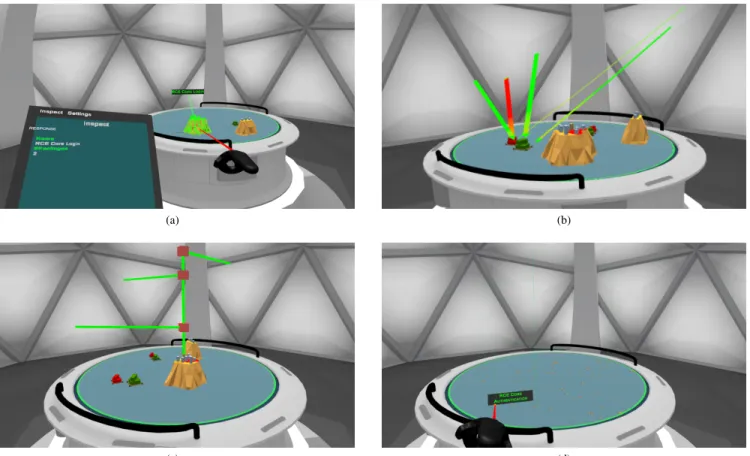
Figure 18. Exploring the software system RCE in VR: (a) Bundle selection; (b) Bundle dependencies; (c) Service dependencies; and, (d) Service dependency exploration.
selected bundle (Figure 18(a)).
For further inspections, one can view at dependencies to other bundles and classes. For that, one can display dependencies, which are shown as incoming and outgoing arcs from the island’s docks (Figure 18(b)).
An important information about OSGi bundles are the ser-vices they provide. For that, one can display all provided services as blocks above the islands (Figure 18(c)). By zooming out, one can easily see how these services are connected, which can be further explored by selected the according connecting bundles (Figure 18(d)).
8. R
ELATEDW
ORKMaletic et al. [31] presented a visualization of C++ code in a virtual environment. Classes are represented as floating platforms upon which additional geometric shapes are placed to visualize attributes and methods. While inheritance is implemented via platform adjacency, other dependency types use explicit connections. The presented system is displayed inside a CAVE environment and showcased only very simple software systems.
Fittkau et al. [32] proposed an approach for a live trace visualizations using a city metaphor in virtual reality. The vi-sualization is presented to the user in a head mounted display (Oculus DK1). Since the used hardware does not incorporate any positional tracking, the visualized content is additionally transformed via gesture based controls. In combination with
a gaze driven pointer, objects can be selected and interacted with.
Schreiber et al. [33] introduced an approach for visualizing software modules using the metaphor of electrical compo-nents. Modules are represented as blocks and the containing packages are stacked on top of each module. The stacked modules are visualized in virtual reality by various placement algorithms based on the relationship between modules. Mod-ules and packages can be selected an interactively explored by showing service modules, classes, and dependencies between modules and packages.
Merino et al. [34] and Vincur et al. [35], [36] presented a VR visualization for object oriented software (Java, C++) using a city metaphor. The approaches rely on VR hardware capable of positional tracking, as the main navigational mechanism is physical movement and interaction is based on the controller positions. In contrast, the main navigational mechanism in our work is the explicit transformation of the visualization itself and is therefore independent of the available physical tracking space. Additionally, we also support positional tracking.
For AR, Merino at al. [37] investigated, whether usability is-sues of 3D software visualization (e.g., navigation, selection, occlusion, and text readability issues) can be minimized by displaying 3D visualizations in immersive augmented reality.
9. C
ONCLUSIONWe presented our approaches for exploring intangible component-based software architectures in virtual reality and augmented reality. We used an island metaphor to represents the modules on different levels and their dependencies vi-sually. Currently, we are able to visualize the architecture of software systems that are developed based on the OSGi component model for Java. OSGi-based software systems are widely used for large applications, especially in embedded systems development or in the Eclipse ecosystem. The visual-izations at the current stage of development allows to visually explore the overall architecture and to discover dependencies at various modularity levels.
Future work will foremost focus on conducting user studies to evaluate the usefulness of our approach, which is somewhat missing for most software visualization approaches [38]. We started with a comparative user study between VR and Web-based 2D visualizations and a user study using eye-tracking in VR. Other future work aims to support other component models than OSGi and other programming languages than Java. Beside visualizing the current state of software projects, we plan to visualize the evolution of software, too.
A
CKNOWLEDGMENTSThe authors thank current and former members of the RCE team (Brigitte Boden, Jan Flink, Robert Mischke, and Sascha Zur) for discussions, support, and continuous help in eval-uating the visualizations and Doreen Seider, AWS, for ini-tiating the research on software visualization at DLR and continuously sharing her thoughts and recommendations on our work.
R
EFERENCES[1] R. Mili and R. Steiner, “Software engineering – introduction,” in Revised Lectures on Software
Visualization, International Seminar. London, UK,
UK: Springer-Verlag, 2002, pp. 129–137. [Online]. Available: http://dl.acm.org/citation.cfm?id=647382. 724792
[2] D. Seider, M. Litz, A. Schreiber, P. M. Fischer, and A. Gerndt, “Open source software framework for ap-plications in aeronautics and space,” in 2012 IEEE
Aerospace Conference, March 2012, pp. 1–11.
[3] S. Goertz, C. Ilic, J. Jepsen, M. Leitner, M. Schulze, A. Schuster, J. Scherer, R. Becker, S. Zur, and M. Petsch, 18th AIAA/ISSMO Multidisciplinary
Analysis and Optimization Conference. American
Institute of Aeronautics and Astronautics, 2017, ch. Multi-Level MDO of a Long-Range Transport Aircraft Using a Distributed Analysis Framework. [Online]. Available: https://doi.org/10.2514/6.2017-4326 [4] P. M. Fischer, M. Deshmukh, A. Koch, R. Mischke,
A. M. Gomez, A. Schreiber, and A. Gerndt, “Enabling a conceptual data model and workflow integration environment for concurrent launch vehicle analysis,”
in 69th International Astronautical Congress (IAC),
Oktober 2018. [Online]. Available: https://elib.dlr.de/ 122158/
[5] P. M. Fischer, D. L¨udtke, C. Lange, F.-C. Roshani, F. Dannemann, and A. Gerndt, “Implementing model-based system engineering for the whole lifecycle
of a spacecraft,” CEAS Space Journal, vol. 9, no. 3, pp. 351–365, Sep 2017. [Online]. Available: https://doi.org/10.1007/s12567-017-0166-4
[6] M. Misiak, D. Seider, S. Zur, A. Fuhrmann, and A. Schreiber, “Immersive exploration of OSGi-based software systems in virtual reality,” in Proceedings of the 25th IEEE Virtual Reality (VR) conference. IEEE, 2018.
[7] A. Schreiber and M. Misiak, “Visualizing software ar-chitectures in virtual reality with an island metaphor,” inVirtual, Augmented and Mixed Reality: Interaction, Navigation, Visualization, Embodiment, and Simula-tion, J. Y. Chen and G. Fragomeni, Eds. Cham: Springer International Publishing, 2018, pp. 168–182. [8] R. Koschke, “Software visualization in software
maintenance, reverse engineering, and re-engineering: A research survey,”Journal of Software Maintenance, vol. 15, no. 2, pp. 87–109, Mar. 2003. [Online]. Available: http://dx.doi.org/10.1002/smr.270
[9] P. Caserta and O. Zendra, “Visualization of the static aspects of software: A survey,” IEEE Transactions
on Visualization and Computer Graphics, vol. 17,
no. 7, pp. 913–933, Jul. 2011. [Online]. Available: http://dx.doi.org/10.1109/TVCG.2010.110
[10] M. A. D. Storey, K. Wong, and H. A. Muller, “How do program understanding tools affect how programmers understand programs?” in Proceedings of the Fourth Working Conference on Reverse Engineering, Oct 1997, pp. 12–21.
[11] G. G. Robertson, S. K. Card, and J. D. Mackinlay, “Information visualization using 3d interactive animation,” Commun. ACM, vol. 36, no. 4, pp. 57–71, Apr. 1993. [Online]. Available: http://doi.acm.org/10.1145/255950.153577
[12] P. Irani and C. Ware, “Diagramming information structures using 3d perceptual primitives,” ACM
Trans. Comput.-Hum. Interact., vol. 10, no. 1,
pp. 1–19, Mar. 2003. [Online]. Available: http: //doi.acm.org/10.1145/606658.606659
[13] C. Ware and G. Franck, “Evaluating stereo and motion cues for visualizing information nets in three dimensions,” ACM Trans. Graph., vol. 15, no. 2, pp. 121–140, Apr. 1996. [Online]. Available: http://doi.acm.org/10.1145/234972.234975
[14] H. Graham, H. Y. Yang, and R. Berrigan, “A solar system metaphor for 3d visualisation of object oriented software metrics,” inProceedings of the 2004 Australasian Symposium on Information Visualisation
-Volume 35, ser. APVis ’04. Darlinghurst, Australia,
Australia: Australian Computer Society, Inc., 2004, pp. 53–59. [Online]. Available: http://dl.acm.org/citation. cfm?id=1082101.1082108
[15] D. Seider, A. Schreiber, T. Marquardt, and M. Br¨uggemann, “Visualizing modules and dependencies of osgi-based applications,” inSoftware
Visualization (VISSOFT), 2016 IEEE Working
Conference on. IEEE, 2016, pp. 96–100.
[16] R. M¨uller, D. Mahler, M. Hunger, J. Nerche, and M. Harrer, “Towards an open source stack to create a unified data source for software analysis and visu-alization,” in The Sixth IEEE Working Conference on
Software Visualization (VISSOFT 2018). IEEE, 2018,
[17] V. L. Averbukh, “Visualization metaphors,”
Programming and Computer Software, vol. 27,
no. 5, pp. 227–237, Sep. 2001. [Online]. Available: http://dx.doi.org/10.1023/A:1012333025189
[18] M. Yang and R. P. Biuk-Aghai, “Enhanced hexagon-tiling algorithm for map-like information visualisation,”
in Proceedings of the 8th International Symposium
on Visual Information Communication and Interaction,
ser. VINCI ’15. New York, NY, USA: ACM, 2015, pp. 137–142. [Online]. Available: http://doi.acm.org/ 10.1145/2801040.2801056
[19] M. Parks, American Flow Mapping: A Survey of the Flow Maps Found in Twentieth Century Geography Textbooks, Including a Classification of the Various
Flow Map Designs. Georgia State University, 1987.
[Online]. Available: https://books.google.de/books?id= mgRENwAACAAJ
[20] W. Tobler, “Experiments in migration mapping by com-puter,” The American Cartographer, vol. 14, pp. 155– 163, Apr. 1987.
[21] P. Eades, “A heuristic for graph drawing,”Congressus numerantium, vol. 42, pp. 149–160, 1984.
[22] H. B.-L. Duh, D. E. Parker, and T. A. Furness, “An “independent visual background” reduced balance dis-turbance envoked by visual scene motion: implication for alleviating simulator sickness,” in Proceedings of the SIGCHI conference on human factors in computing
systems. ACM, 2001, pp. 85–89.
[23] J. Prothero, M. H Draper, T. Furness, D. Parker, and M. J Wells, “The use of an independent visual background to reduce simulator side-effects,”Aviation, space, and environmental medicine, vol. 70, pp. 277–83, Apr. 1999.
[24] J. Jerald, The VR Book: Human-Centered Design for
Virtual Reality. New York, NY, USA: Association for
Computing Machinery and Morgan & Claypool, 2016. [25] M. Misiak, Rawi85, and A. Schreiber,
“DLR-SC/island-viz: Islandviz 1.0,” Oct. 2018. [Online]. Available: https://doi.org/10.5281/zenodo.1464633
[26] J. Rekimoto and K. Nagao, “The world through the computer: Computer augmented interaction with real world environments,” in Proceedings of the 8th Annual ACM Symposium on User Interface and
Software Technology, ser. UIST ’95. New York, NY,
USA: ACM, 1995, pp. 29–36. [Online]. Available: http://doi.acm.org/10.1145/215585.215639
[27] G. Tur and L. Deng, Intent Determination
and Spoken Utterance Classification.
Wiley-Blackwell, 2011, ch. 4, pp. 93–118. [Online]. Available: https://onlinelibrary.wiley.com/doi/abs/10. 1002/9781119992691.ch4
[28] T. Bocklisch, J. Faulkner, N. Pawlowski, and A. Nichol, “Rasa: Open source language understanding and dialogue management,” CoRR, vol. abs/1712.05181, 2017. [Online]. Available: http://arxiv.org/abs/1712. 05181
[29] A. Schreiber, R. Galoppini, M. Meinel, and T. Schlauch, “An open source software directory for aeronautics and space,” in Proceedings of The International
Symposium on Open Collaboration, ser. OpenSym
’14. New York, NY, USA: ACM, 2014, pp. 46:1– 46:7. [Online]. Available: http://doi.acm.org/10.1145/ 2641580.2641630
[30] D. Seider, A. Basermann, R. Mischke, M. Siggel, A. Trltzsch, and S. Zur, Ad hoc Collaborative De-sign with Focus on Iterative Multidisciplinary Process Chain Development applied to Thermal Management of Spacecraft, 10 2013.
[31] J. I. Maletic, J. Leigh, A. Marcus, and G. Dunlap, “Visualizing object-oriented software in virtual reality,”
inProceedings 9th International Workshop on Program
Comprehension. IWPC 2001. Washington, DC, USA:
IEEE Computer Society, 2001, pp. 26–35.
[32] F. Fittkau, A. Krause, and W. Hasselbring, “Exploring software cities in virtual reality,” in 2015 IEEE 3rd Working Conference on Software Visualization
(VIS-SOFT), Sept 2015, pp. 130–134.
[33] A. Schreiber and M. Br¨uggemann, “Interactive visu-alization of software components with virtual reality headsets,” in2017 IEEE Working Conference on
Soft-ware Visualization (VISSOFT), 2017, Conference
Pro-ceedings.
[34] L. Merino, M. Ghafari, C. Anslow, and O. Nierstrasz, “CityVR: Gameful software visualization,” in
2017 IEEE International Conference on Software
Maintenance and Evolution (ICSME). IEEE,
2017, pp. 633–637. [Online]. Available: http: //scg.unibe.ch/archive/papers/Meri17c.pdf
[35] J. Vincur, I. Polasek, and P. Navrat, “Searching and exploring software repositories in virtual reality,”
in Proceedings of the 23rd ACM Symposium on
Virtual Reality Software and Technology, ser. VRST
’17. New York, NY, USA: ACM, 2017, pp. 75:1– 75:2. [Online]. Available: http://doi.acm.org/10.1145/ 3139131.3141209
[36] J. Vincur, P. Navrat, and I. Polasek, “VR city: Software analysis in virtual reality environment,” in 2017 IEEE International Conference on Software Quality,
Reliabil-ity and SecurReliabil-ity Companion (QRS-C), July 2017, pp.
509–516.
[37] L. Merino, A. Bergel, and O. Nierstrasz, “Overcoming issues of 3d software visualization through immersive augmented reality,” in VISSOFT’18: Proceedings of the 6th IEEE Working Conference on Software Visualization. IEEE, 2018. [Online]. Available: http: //scg.unibe.ch/archive/papers/Meri18c.pdf
[38] L. Merino, M. Ghafari, C. Anslow, and O. Nierstrasz, “A systematic literature review of software visualization evaluation,” Journal of Systems
and Software, vol. 144, pp. 165 – 180, 2018.
[Online]. Available: http://www.sciencedirect.com/ science/article/pii/S0164121218301237
Andreas Schreiberreceived a diploma in industrial mathematics from
Techni-cal University Clausthal. He worked
at the German Army (Bundeswehr) and Argonne National Laboratory. Now he is head of the Department for Intel-ligent and Distributed Systems of the German Aerospace Centers (DLR) Sim-ulation and Software Technology divi-sion. His research fields include repro-ducible science, distributed systems, data provenance, ma-chine learning, explainable AI, information visualization, and software analytics. He organizes events for Python in high-performance computing and data science.
Lisa Nafeie is a student of Com-puter Science and Engineering at TH K¨oln. She’s working as a student as-sistant at the Department for Intelligent and Distributed Systems of the German Aerospace Center (DLR). Her research fields include software systems and soft-ware visualization. She started to work in the software visualization team in Spring 2018. Before that she worked in the distributed software systems team at DLR, and helped to develop the distributed integration systemRCE, which is based on OSGi.
Artur Baranowskireceived a B.Eng. in Media Technology from the University
of Applied Sciences D¨usseldorf.
Cur-rently he is a masters student in Com-puter Science and Engineering at TH
K¨oln. Meanwhile, he is research
as-sistant at the Department for Intelligent and Distributed Systems of the German Aerospace Center (DLR), where he sup-ports research in the fields augmented reality, interactive visualization, and software visualization.
Peter Seipel received a B.A. in Phi-losophy from the University of Marburg (Philipps-Universit¨at Marburg) and a B.A. in Computer Science (Informa-tionsverarbeitung) form the University of Cologne. Currently he is a masters student in Computer Science with a
fo-cus on Computer Linguistics.
Mean-while, he is research assistant at the De-partment for Intelligent and Distributed Systems of the German Aerospace Center (DLR), where he supports research in the fields augmented reality, speech recognition, and natural language processing.
Martin Misiakreceived his M.S degree in Media Technology from the Univer-sity of Applied Sciences in Cologne (TH
K¨oln). He is a PhD student at the
University of W¨urzburg and TH K¨oln, where he also works as a research as-sociate. His research fields include real-time computer graphics, photo-realistic rendering, computer human interaction, virtual reality technologies, and infor-mation visualization.