Quantitative accuracy in mass spectrometry based
proteomics of complex samples: The impact of
labeling and precursor interference
AnnSofi Sandberg, Rui M.M. Branca, Janne Lehtiö, Jenny Forshed
⁎
Science for Life Laboratory Stockholm and Cancer Proteomics, Department of Oncology–Pathology, Karolinska Institutet, Sweden
A R T I C L E I N F O
A B S T R A C T
Article history: Received 19 June 2013 Accepted 24 October 2013 Available online 5 November 2013
Knowing the limit of quantification is important to accurately judge the results from proteomics studies. In order to investigate isobaric labels in combination with peptide pre-fractionation by high resolution isoelectric focusing in terms of limit of detection, quantitative accuracy and how to improve it, we used a human cell lysate spiked with 57 protein standards providing reference points across a wide concentration range. Specifi-cally, the impact of precursor mixing (isolation interferenceandreporter ion interference) on quantitative accuracy was investigated by co-analyzing iTRAQ (8-plex) and TMT (6-plex) labeled peptides. A label-free analysis was also performed. Peptides, labeled or label-free, were analyzed by LC–MS/MS (Orbitrap Velos). We identified 3386 proteins by the label-free approach, 4466 with iTRAQ and 5961 with TMT. A linear range of quantification down to 1 fmol was indicated for both isobaric and label-free analysis workflows, with an upper limit exceeding 60 fmol. Our results indicate that 6-plex TMT is more sensitive than 8-plex iTRAQ. For isobaric labels, quantitative accuracy was affected by precursor mixing. Based on our evaluation on precursor mixing and accuracy of isobaric label quantification, we propose a cut off of < 30%isolation interferencefor peptide spectrum matches (PSMs) used in the quantification.
Biological significance
Quantitative proteome analysis by mass spectrometry offers opportunities for biological research. However, knowing the limit of quantification in biological samples is important to accurately judge the results. By using a high-complexity sample spiked with protein standards of known concentrations, we investigated the quantification limits of label-free and label-based peptide quantification, including an evaluation of precursor mixing and its impact on quantification accuracy by isobaric labels. We suggest limits of allowed precursor interference and believe that this study contributes with information useful in proteome quantification by mass spectrometry.
© 2013 The Authors. Published by Elsevier B.V. Keywords: iTRAQ Label-free Precursor mixing Quantification TMT
⁎ Corresponding author at:Science for Life Laboratory, Box 1031, SE-17121 Solna, Sweden. E-mail address:[email protected](J. Forshed).
1874-3919 © 2013 The Authors. Published by Elsevier B.V. http://dx.doi.org/10.1016/j.jprot.2013.10.035
A v a i l a b l e o n l i n e a t w w w . s c i e n c e d i r e c t . c o m
ScienceDirect
w w w . e l s e v i e r . c o m / l o c a t e / j p r o tOpen access under CC BY-NC-ND license.
1.
Introduction
In proteomics analysis of biological samples, the statistical analysis is heavily reliant on technologies that are able to detect and accurately quantify low abundance proteins, because it is in this low concentration range that proteins indicative of distinct biological states are believed to be found. Further, as also small protein level changes can have phenotypic effects on a studied system, accurate quantification methods for measuring global protein alterations are important. Advances in mass spec-trometry (MS) instrumentation, computational data analysis, and the availability of nearly complete sequence databases for many species have made large-scale proteomics analyses possible[1–3]. By reaching the low abundant proteins, proteo-mics has become an important research approach for biomark-er discovbiomark-ery[4,5]. However, despite the many publications on mass spectrometry based clinical proteomics during the last decade; the translation of potential biomarkers and bio-marker panels into clinical practice has been occasional. One reason is false positives in early studies. With this study our aim was to evaluate the quantitative accuracy and linear range for quantification by isobaric labeling. Knowing the limits of accurate quantification will indicate the protein level ranges at which we achieve reliable quantitative protein measurements; and thereby reduce the risk of false positives.
The use of labels in proteomics experiments makes it possible to multiplex the analysis, which makes more efficient use of instrument time and further controls for technical variation. The isobaric labels TMT (tandem mass tagging)[6] and iTRAQ (isobaric tags for relative and absolute quantifica-tion)[7]are available in up to 8 tags that can be used for labeling practically any peptide or protein sample.
Quantification by isobaric labels is performed by measur-ing the intensities of fragment reporter ions released from the labels during peptide fragmentation in the tandem MS mode (MS2). Precursor ions to be fragmented are selected in the full scan mode (MS1). The ion selection step is advantageous as it reduces the noise levels. Ideally, during the precursor ion fragmentation only one selected precursor ion is fragmented. In practice however, it is a common occurrence that other precursor ions are caught within the specified m/z window (typically 2 Da around the isolation mass) and are fragmented together with the selected precursor. This is called precursor co-isolation or mixing, and is a significant limiting factor of identification rates in shotgun proteomics[8,9]. It is also negative for quantification based on isobaric labels as co-isolated peptides also create reporter tags which if superimposed on the reporter tags from the selected precursor ion, gives an inaccurate link between peptide quantity and identity. Because typically most of the proteins in a biological sample are unregulated, the co-isolated peptides often create reporter tags with equal relative intensity. Consequently, precursor co-isolation has in several studies been shown to influence the accuracy of iTRAQ quantification and to cause systematic underestima-tion in the ratio of protein changes and a bias of changes towards unity[10–14].
The risk of precursor co-isolation and hence erroneous identification and quantification is larger in complex samples,
and is consequently suggested to be reduced by pre-fractionation [11,15,16]. Precursor co-isolation is also reduced by fragmentation close to the apex of the chromatographic peak[17]. Accuracy in relation to precursor co-isolation has been discussed[18], and addressed by two technical developments in data acquisition [19,20]. These two suggested methods involve direct analysis of MS3 spectra and gas phase purification of precursors by ion transfer reactions and both improve the purity of origin of the reporter ions. However, both methods require specific instru-mentation and increase mass spectrometry cycle time which limits applicability. An algorithm for fold change correction of isobaric label data was recently published [21]. The algorithm uses the precursor interference levels to estimate the fraction of reporter ion abundance that originates from co-isolated precur-sor ions and corrects according to that. The method improves quantitative accuracy of isobaric data as evaluated on a medium complexity sample spiked with 2 proteins, and as compared with label-free data. In a recent study, the experimental setup of co-analysis of TMT and iTRAQ labeled samples to measure precursor co-fragmentation was described by Altelaar et al.[13]. The results show that only about 1/3 of all spectra are clean without interference, and a double isolation method (MS3) was suggested to address this. A disadvantage with the MS3 isolation is that it results in fewer proteins being quantified[13]. The aim of our study was to directly relate the percentage of co-isolated precursor ions to quantitative accuracy. We wanted to investigate how precursor co-isolation affects the quantification (of both low- and high abundant proteins) in a complex sample. For the investigation we used an experimental design with a human cell lysate as background, into which we spiked 57 protein standards ranging 5 orders of magnitude. This provided several reference points across a wide concentration range, and could be used to correlate measured amounts with theoretical (known spiked) amounts. We used a similar experimental design as Altelaar et al.[13]but with the differences of using isoelectric focusing for peptide pre-fractionation to reduce sample complexity, which has been shown to affect precursor co-isolation. The end purpose of investigating precursor co-isolation was to deter-mine a practical cutoff for maximum isolation interference allowed.
An alternative method without risk for introducing errors such as incomplete labeling or precursor mixing, is label-free peptide quantification. Label-free measurements offers a mea-sure of the mass spectrometric signals of the peptides that can be compared directly between different proteome measurements given that conditions remain identical between separate mea-surements. In principle, there are thus no restrictions in sample number due to limited number of labels. We were therefore interested in also investigating the limits of quantification using a label-free approach on the spike in samples. The label-free quantification was based on measuring precursor peptide ion intensities in the first MS dimension (MS1) by peak area/ height [22,23]. Given that multiplexing is not possible in a label-free analysis; the time for LC–MS analysis is longer. As many shotgun proteomics workflows, our workflow for in-depth protein quantification of complex samples employs pre-fractionation to increase protein identification rates and quantification accuracy. To restrict the LC–MS analysis time however, the label-free analysis was performed on non-fractionated samples.
1.1. Rationale of the study
The aim of this study was to investigate the quantitative accuracy of isobaric labeling in combination with peptide pre-fractionation by high resolution isoelectric focusing, as this is a key step in our proteomics workflow. Specifically, we wanted to investigate to which degree precursor mixing (both interfering co-isolated precursors in the isolation window and the consequential reporter ions in the fragment spectra) affects the quantitative accuracy.
To make the investigation valid for biological samples of high complexity, a human cell lysate was used as background. The cell lysate was spiked with 57 protein standards ranging 5 orders of magnitude, providing several reference points across a wide concentration range. This sample set was used both for the investigation of protein quantification by isobaric labels and in a label-free quantification analysis.
2.
Materials and methods
2.1. Experimental design
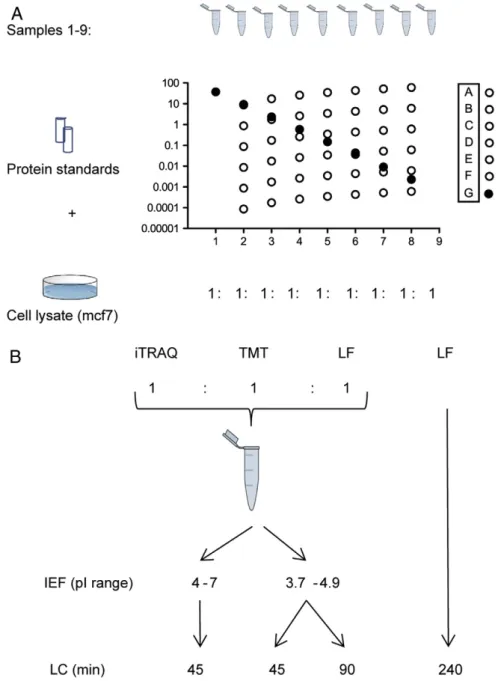
Whole cell lysate from a breast cancer cell line (MCF7) was used as proteome background. The protein extract was divided into 9 identical samples (samples 1–9; 400μg/sample). Approximating an average protein Mw of 50000 Da, this gives 8 nmol of protein background per sample. Two protein standard mixtures: 1) the Universal Proteomics Standard mix (UPS2, Sigma-Aldrich, St. Louis, MO) consisting of 48 proteins and 2) a set of 9 standard proteins (MSCAL 1, Sigma-Aldrich and P77305, New England Biolabs); were spiked to the samples (Fig. 1A).
Sample aliquots were assigned to peptide quantification either by label based quantification methods (iTRAQ or TMT) or by a label-free feature intensity approach (Fig. 1B). To evaluate precursor mixing, the iTRAQ and TMT labeled samples were pooled and co-analyzed by LC–MS/MS. For the co-analysis with iTRAQ and TMT labeled peptides; 140μg of label-free peptides was added as shown inFig. 1B. This label-free fraction was used in the evaluation of interference, as a search with label-free settings theoretically contains no iTRAQ or TMT reporter ions. The pooled peptide samples were pre-fractionated based on their isoelectric point (pI) in order to reduce sample complexity prior to LC–MS/MS. The aliquots used for label-free quantifica-tion were not pre-fracquantifica-tionated. Instead, to improve resoluquantifica-tion and the dynamic range of the analysis, the LC gradient was increased to 240 min (compared to 45 or 90 min gradients for each pI-fraction of the labeled samples). All label-free samples were run in technical triplicates.
2.2. Sample preparation
The cell lysate was dissolved in 25 mM HEPES, 4% SDS, 1 mM DTT (pH 7.6) to a total volume of 3.5 mL (protein concentra-tion 3.2μg/μL). The proteins were precipitated in acetone to remove lysis buffer. Briefly, 4 volumes of ice cold acetone were added and the samples were left on ice for 1 h. The samples were centrifuged for 10 min (4 °C, 12 000g). The supernatant was discarded and the resulting protein pellets allowed to air dry. The pellets were re-dissolved to a final concentration of
0.2% SDS and the protein concentration was determined using the DC protein assay (BioRad).
The standard proteins were added to samples 1–8 as described inFig. 1A. The UPS2 protein standard contains 48 human proteins in quantities prepared from 6 mixtures of 8 proteins ranging 5 orders of magnitude (50 pmol to 500 amol). We diluted the mixture in 8 linear steps, resulting in protein amounts ranging 0–25 000 fmol. The additional 9 proteins, of which 3 non-mammalian: P14R (synthetic), TPI and MBP B-Gal (Escherichia coli), were mixed in equimolar concentrations and added in 8 log4-dilution steps ranging 0–15 000 fmol. The protein accessions and molar amounts of the spiked standard proteins are found in Suppl. File S2.
After adding the protein standards to the cell lysate, the pH of the samples was adjusted with triethylammonium bicarbonate (TEAB) and reduced with tris(2-carboxyethyl)phosphine (TCEP) (both from AB Sciex). After alkylation with iodoacetamide (Sigma), digestion was performed using trypsin (sequencing grade, Promega), at 37 °C overnight with an enzyme:substrate ratio 1:66 (w:w). After tryptic digestion, the peptide samples were either labeled with isobaric tags or kept label-free.
For the label-free samples analyzed on a long LC gradient; 100μg of each sample to be analyzed was cleaned by strong cation exchange solid phase extraction as described for TMT and iTRAQ labeled samples. The samples were freeze dried and stored in−80 °C.
2.3. Peptide labeling by TMT and iTRAQ
For isobaric labeling, 160 and 120μg of peptides per sample for 8-plex iTRAQ and 6-plex TMT, respectively (20μg peptides/ channel), were labeled according to the manufacturers' instruc-tions. The labeling scheme is shown in Suppl. Table S1. After labeling, excess reagents and detergents were removed by strong cation exchange solid phase extraction (Strata X-C 33μm polymeric SCX, Phenomenex). The samples were freeze dried and resulting pellets stored in−80 °C.
2.4. Peptide pre-fractionation by isoelectric focusing Peptide pre-fractionation was performed on labeled samples by isoelectric focusing (IEF). The isoelectric focusing reduces sample complexity by limiting the MS analysis to peptides within a specified pI range. The gain is a reduced sample complexity, particularly when using narrow range IEF[24]. We investigated the impact of peptide pre-fractionation by IEF on precursor mixing using both acidic (pI 3.7–4.9) narrow range as well as normal range (pI 4–7); 24 cm linear gradient immobilized pH gradient (IPG) strips (GE Healthcare). The acidic pI range 3.7–4.9 contains peptides representing 96% of all proteins but the total peptide number is reduced to one third[24,25]. IPG-IEF is compatible with iTRAQ labeling[25], and from our experience also with TMT labeling[26]. In brief; peptide samples were dissolved in 225μL rehydration solu-tion containing 8 M urea, and applied to a gel bridge. For reswelling of the IPG strips overnight, 1% IPG pharmalyte pH 2.5–5.0 (GE Healthcare) in 8 M urea was used. Samples were applied to the IPG strips by the gel bridge (pH 3.7) at the cathode end and run as described in[24]. After focusing, the peptides were passively eluted into 72 contiguous fractions
with MilliQ water using an in-house constructed IPG extractor robotics (GE Healthcare Bio-Sciences AB, prototype instrument). The resulting fractions were freeze dried and kept at−20 °C. 2.5. Mass spectrometry analysis
The freeze dried peptide pellets for the label-free analysis were dissolved in 100μL of 3% acetonitrile 0.1% formic acid to 1μg/μL, from which 1μL was injected per run. For the labeled peptides, each peptide IPG fraction was re-dissolved in 8μL of
3% acetonitrile 0.1% formic acid by the autosampler of an Agilent HPLC 1200 system (Agilent Technologies, Santa Clara, CA, USA) prior to injection. From the 8μL each IPG fraction, a volume of 3μL was injected to online HPLC–MS (LTQ-Orbitrap Velos mass spectrometer, Thermo Fischer Scientific, San Jose, CA, USA). The HPLC 1200 system provided the gradient for online reversed-phase nano-LC at a flow of 0.4μL/min. Solvent A was 97% water, 3% ACN, 0.1% formic acid; and solvent B was 5% water, 95% ACN, 0.1% formic acid. The curved gradient (Eq.(1)) went from 2% B up to 40% B in 45/90/ Fig. 1–Samples and experimental design. (A) The samples were prepared using a mammalian cell line as background, into which 57 standard proteins in concentrations ranging 5 orders of magnitude were spiked. The 57 protein standards were grouped in mixes A–G (8–9 proteins per group) based on their added concentration range across samples. Mixes A–F were spiked in linear concentration steps across 8 samples (sample 9 blank). The G-mix was added in log4dilution steps across 8
samples. (B) Samples were analyzed using labels or a label-free approach. Labeled samples were co-analyzed and
pre-fractionated by isoelectric focusing using IPG-strips with either normal (4–7), or narrow pI range (3.7–4.9). The label-free samples were analyzed on a long LC-gradient. LC: liquid chromatography, iTRAQ & TMT: isobaric labels, LF: label-free, IEF: isoelectric focusing.
240 min (gradient length depending on sample, seeFig. 1B), followed by a steep increase to 100% B in 5 min. The sample was injected into a C-18 guard desalting column (Agilent Technol-ogies) prior to a 15 cm long C-18 picofrit column (100μm internal diameter, 5μm bead size, Nikkyo Technos Co., Tokyo, Japan) installed on the nano electrospray ionization (NSI) source of the mass spectrometer.
%Btime ið Þ¼%
Bgradient end−%Bgradient start
total gradient time1:5 time ið Þ
1:5þ%B
gradient startð1Þ
Equation used to define the curved gradients. Time expressed in minutes.
For TMT and iTRAQ labeled samples, data acquisition proceeded in ~3.5 second scan cycles, starting by a single full scan MS (300–2000 m/z, AGC target 10^6) at 30 000 resolution (profile mode), followed by two stages of data-dependent tandem MS (centroid mode): the top 5 ions from the full scan MS were selected firstly for collision induced dissociation (CID, 35% energy; max. injection time 200 ms, AGC target 20 000) with MS/MS detection in the ion trap, and finally for higher energy collision dissociation (HCD, 45% energy; max. injection time 500 ms, AGC target 50 000) with MS/MS detec-tion in the Orbitrap. Precursors with an intensity of at least 1000 were isolated with a 2 m/z width and dynamic exclusion 90 s. The intensity threshold to trigger acquisition of tandem mass spectra was 1000 counts. Un-assigned and charge state 1 were excluded. For iTRAQ and TMT reporter ion based quantification we used the combination of ion trap CID and collision cell based HCD described in[27].
For label-free samples, data acquisition proceeded with up to 3 s between each MS1 scan, starting by a single full MS scan at 60000 resolution (profile mode), followed by one stage (CID fragmentation) of data-dependent tandem MS (centroid mode). The top 10 ions from the full scan MS were selected for collision induced dissociation (CID, at 35% energy) with MS/MS detection in the ion trap. The ion injection time maximum for CID was set to 200 ms. Precursors were isolated with a 2 m/z width and dynamic exclusion was used with 90 s duration. The intensity threshold to trigger acquisition of tandem mass spectra was 1000 counts. Un-assigned and charge state 1 were excluded. At least 10 MS1 scans per peptide were used to define the MS1 features.
2.6. Data analysis
Raw MS (label-) data was identified and quantified under the software platform Proteome Discoverer 1.3.0.339 (Thermo Fisher Scientific Inc.) or MaxQuant software (version 1.2.0.18) (label-free data).
For both protein identification and quantification at least 1 unique (i.e. a peptide that occurs in not more than one database entry) peptide was required. The false discovery rate (FDR) for peptide identification was set to 5% in all analyses. For the iTRAQ and TMT labeled samples, all MS/MS spectra were searched by SEQUEST[28]combined with the Percolator algorithm (version 2.0) for PSM search optimization[29]. The Percolator algorithm uses semi-supervised machine learning to discriminate between correct and decoy spectrum identi-fications. Searches were performed against a custom made
database consisting of SwissProt human sequences (uniprot.org 2012-01-17, 20242 entries), and the spiked in protein standards (57 protein sequences). Peptide FDR was calculated by a target–decoy approach. A minimum precursor mass of 500 Da (corresponding to approximately 6 amino acids), and a maxi-mum precursor mass of 6000 Da was required. A precursor mass tolerance of 10 ppm and product mass tolerances of 20 mmu (0.02 Da) for HCD-FTMS and 0.5 Da for CID-ITMS were used. Enzyme specificity was set to trypsin, allowing 1 missed cleavage. Modifications included were cysteine carbamidometh-ylation (fixed), as well as protein phosphorcarbamidometh-ylation (of serine, threonine and tyrosine) and methionine oxidation (variable).
To obtain a measure of precursor mixing the data was searched with three distinct settings: with iTRAQ 8-plex on lysine and N-terminal as fixed modifications, with TMT 6-plex on lysine and N-terminal as fixed modifications, and finally without any label as fixed modification (label-free). In all three settings, we still quantified the reporter ions detected. Thus, with TMT as fixed modification, all iTRAQ reporter ions detected were classified as contaminants; and vice versa. For the search with label-free settings, all isobaric reporter ions detected were considered interfering. Quantification of 6-plex TMT and 8-plex iTRAQ reporter ions was performed on HCD-FTMS tandem mass spectra using an integration window tolerance of 20 ppm. The settings used were according to standard procedure. The peptide ratios were calculated from median PSMs. These peptide ratios were then assembled (median) to protein groups. The protein ratios were then normalized to the total intensity.
For analysis of the label-free samples, a time and mass dependent peptide recalibration algorithm included in MaxQuant [30–33]was used to improve the mass accuracy of the precursor ions prior to database search. The Andromeda search engine[34] was used to search the MS/MS spectra against the same customized database as for the labeled data, see above. For protein identification a minimum peptide length of 6 amino acids was required. Peptide and protein FDR was estimated by target–
decoy approach. Enzyme specificity was set to trypsin, allowing 1 missed cleavage. For initial peptide identification search, the mass tolerance was 20 ppm. After time and mass dependent peptide mass recalibration, a peptide mass tolerance in the main search of 6 ppm was used. For the MS/MS, a fragment mass tolerance was set to FTMS 20 ppm, and ITMS 0.5 Da. Modifica-tions included were cysteine carbamidomethylation (fixed), as well as protein phosphorylation (of serine, threonine and tyrosine) and methionine oxidation (variable). The MaxQuant software includes an algorithm that performs a second round of database search using co-fragmented peptides (=second pep-tides)[34]. This was employed to increase the number of protein identifications. Label-free quantification was performed by MS1 feature detection, using area under the chromatographic curve to assess peptide abundance. For each sample, the isotope pattern of each peptide was matched across different LC–MS/MS runs on the basis of mass and retention time, using the software option
“match between runs”and the default retention time window of 2 min. By using the“match between runs”option the software calculates the intensity ratios for the identified peptides and also for features not identified in their respective run, but with m/z and RT matching those of peptides identified in other runs. Normalization was performed against total run intensities, and
the obtained values were adjusted to the mean of the total intensities of the runs.
For quantitative data, graphs and correlation analyses were performed using the software GraphPad Prism (version 5). The area proportional Venn diagrams were obtained using the freely available online tool BioVenn[35].
3.
Results and discussion
The raw data used in the subsequent analyses will be publicly available and deposited at SweStore:http://webdav.swegrid. se/snic/bils/ki_scilife/pub/ and also on the public reposi-tory ProteomeXchange Consortium (http://proteomecentral. proteomexchange.org), with identifier PXD000578. All iden-tified proteins are listed in Suppl. File S2.
The 6-plex TMT, narrow range isoelectric focusing gave 5961 protein identifications based on 26 299 unique peptides. The 8-plex iTRAQ, narrow range isoelectric focusing had 4466 protein identifications (15 099 unique peptides) and the label-free analysis using long LC gradient 3368 protein identifications (16 484 unique peptides). The overlap between the protein identities is shown in Fig. 2. The experimental design with mixing of TMT and iTRAQ labeling is expected to increase the MS1 ion population, which may reduce the number of protein identifications. The increased complexity was however reduced by the pre-fractionation. The label-free analysis had a median protein sequence coverage of 11%, TMT 8% and iTRAQ 6%. By the label-free approach, 30 of the spiked proteins were detected. By the combined isobaric labeling/ pre-fractionation by isoelectric focusing approach 34 (TMT) and 33 (iTRAQ) of the spiked standard proteins were detected. All three methods had at least one protein accession represented from each of the standard protein mixes A–G, i.e. the standard proteins identified ranged across all spiked in amounts.
The lower number of protein identifications using 8-plex iTRAQ compared to 6-plex TMT is in contradiction to a comparative study on iTRAQ and TMT labeling showing that the two methods perform similarly in terms of protein identifications [36]. However, it is in agreement with a study by Pichler et al., which provides an explanation in that CID/HCD of 8-plex labeled peptides produces a larger number non-canonical fragments (corresponding to the gray vertical bars in Fig. S2B), which results in reduced search engine scores[37].
3.1. Precursor co-isolation and TMT/iTRAQ quantification Other studies have shown that iTRAQ based quantification produces high quality quantitative data, but that the measured iTRAQ ratios underestimate large protein changes [15]. One suggested reason for this is co-isolated precursor ions. We investigated the percentage of co-isolated precursor ions in the PSM (peptide-spectrum-match) population. The degree of co-isolated precursor ions was measured asisolation interference. This was calculated within the software Proteome Discoverer as the intensity fraction of ions other than the selected precursor in the ion selection window. Due to the pI pre-fractionation used in the current study, the interference from co-fragmented peptides can be expected to decrease. Theoretically, reduction of sample complexity by narrow range (3.7–4.9) compared to normal pI
range (4–7) isoelectric focusing would reduce the precursor interference. In the narrow range 3.7–4.9 (fractionated into 72 fractions), each fraction would in theory have a pI width of 1.2/72, while in pI range 4–7 each single fraction would have a pI width 3/72. In our study however, fractionation by narrow (3.7–4.9) or normal (4–7) range isoelectric focusing, as well as increasing the LC gradient length from 45 to 90 min showed little impact on the degree ofisolation interference(Suppl. Fig. S1). Slightly less isolation interference was observed with TMT in comparison to iTRAQ.
To further investigate the impact of precursor co-isolation in quantification by isobaric labeling, we analyzed samples combining the information from iTRAQ and TMT reporter ions. This was done by designing the experiment so that TMT and iTRAQ labeled peptides were mixed and analyzed simultaneously (Fig. 1B). The co-analysis makes it is possible Fig. 2–Area proportional Venn diagrams showing the number of protein identifications and identification overlap of labeled (iTRAQ, TMT) and label-free datasets. (A) Total protein identification numbers. (B) Number of spiked protein standards identified. The results shown are from the respective quantification approach giving the highest number of protein identifications. The labeled samples were pre-fractionated by IEF, while the label-free samples were not, hence no direct comparisons between the two
approaches can be made. The results from the other analysis settings are summarized in Suppl. Table S2.
to separate“true”reporter ions (originating from the selected precursor) from “contaminating” reporter ions (originating from co-fragmented ions in the same m/z window). We then looked at the degree of contaminating reporter ions in the MS2 fragment spectra. First, we looked at the contaminating TMT reporter ion (intensities) in the iTRAQ-searched data; and after that at the corresponding degree of contaminating iTRAQ reporter ion (intensities) in the TMT-searched data. We calculate this interference as: contaminating reporter ion intensity/total (TMT + iTRAQ) reporter ion intensity; and call itreporter ion interference. An example of a precursor isolation window containing ions other than the selected precursor and the corresponding fragment spectrum is shown in Suppl. Fig. S2. As seen in the precursor isolation window (Fig. S2A), other ions are within the range of the selected precursor. These are subsequently co-fragmented with the selected ion and thus produce peaks in the peptide fragment spectrum (Fig. S2B). By adding the TMT tags in the quantification module we could extract also the TMT reporter ion intensities (Fig. S2C) and hence use these“contamination”quantities in our calculations.
We looked at the correlation between theisolation interference (calculated as the relative amount of ion current in the precursor selection window that is not attributed to the precursor itself) and thereporter ion interference(calculated as the proportion of contaminating reporter ion intensity related to the total (TMT + iTRAQ) reporter ion intensity) and saw no correlation between the two measures of interference. Repre-sentative plots are shown in Suppl. Fig. S3A. For the co-analyzed label-free + TMT + iTRAQ samples, we also performed a search with identification aiming at label-free peptides; and correlated the software measuredisolation interference with the sum of interfering iTRAQ and TMT reporter ions (Suppl. Fig. S3, lower panel). Again, no correlation was observed.
The observed discrepancy betweenisolation interferenceand reporter ion interferenceis in line with the study by Altelaar et al. [13]. One explanation to the discrepancy could be that a significant proportion of the contaminating ions in the precursor selection window that contribute to the ion current are not giving rise to reporter ions. In addition, thereporter ion interference is an approximation as the different tags can generate different amounts of reporter ions due to the fragmentation properties of the tags. Further, the by chance co-fragmented precursor can equally likely be TMT or iTRAQ labeled meaning that thereporter ion interferenceas we define it can maximally be 50% correct. This may also explain the observed weak correlation betweenisolation interference(MS1 interference) andreporter ion interference(MS2 interference).
We further investigated the correlation between the main peptide identification score (XCorr) and the two types of interference. We saw a slight trend, but no clear correlation, of inverse relationship between the interference measures and the XCorr score (Suppl. Fig. S3B). This can be explained by XCorr being influenced by also other factors that are inde-pendent of the isolation interference (for example fragmen-tation efficiency).
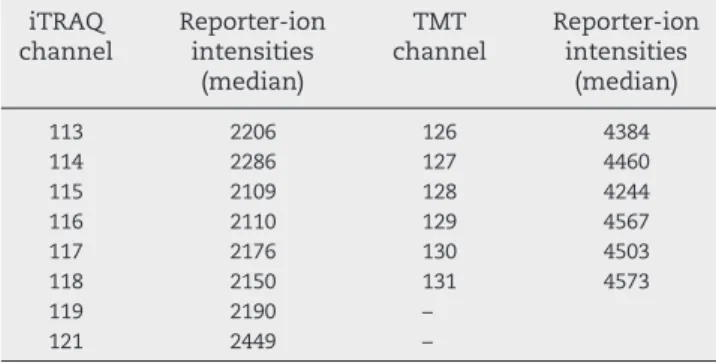
To see whether the reporter ion intensities from iTRAQ and TMT were comparable, we investigated the intensity distribu-tion of the reporter ions. The median of the TMT reporters was nearly twice the intensity of the median of iTRAQ reporters
(Table 1). The difference in intensity explains why reporter ion interference appears larger with iTRAQ as label and TMT as contaminant (Suppl. Fig. S3A). This difference may be the reason for the observed lower noise levels from TMT quantifi-cation compared to iTRAQ quantifiquantifi-cation (Suppl. Fig. S7).
There could be several reasons for the higher intensities of the TMT reporters. We rule out the alternative that the iTRAQ labeling was incomplete, as dynamic search of the raw data (wherein the isobaric tags were set as variable modifications) has shown complete labeling. Other explanations might be better fragmentation properties of the TMT reagent leading to larger reporter ion abundance, or superior ionization proper-ties. Differences in ionization properties have been evaluated and excluded as an explanation in other studies[37]. Superior fragmentation properties would explain the higher number of protein identifications using 6-plex TMT compared to 8-plex iTRAQ in our study (Fig. 2); and thus seem more plausible. Yet another reason for the difference in intensity between iTRAQ and TMT reporter ions could be that the TMT reporter ions, having a slightly higher m/z (Suppl. Fig. S2C), are detected in a mass range where the instrument performs better.
3.2. The effect of precursor co-isolation on quantitative accuracy
We next investigated the effect of precursorisolation interfer-ence and reporter ion interference on quantitative accuracy. Given the poor correlation between isolation interference and reporter ion interference(Suppl. Fig. S3), we wanted to investi-gate the effect of these measures on the quantitative accuracy separately. In Fig. 3 the molar amount of spiked protein standard is plotted versus the median measured reporter ratio for the corresponding peptide spectrum matches (PSMs). To visualize the impact of isolation interferenceon the accuracy, the PSMs were binned and plotted according to interference percentage (bin width 10%). As described, each raw file of the LC–MS/MS data was searched twice; once with TMT as fixed modification so iTRAQ reporters detected were classified as contaminants (Fig. 3A), and once with the reverse settings, i.e. iTRAQ as label (Fig. 3B). From the intensities of the contam-inating reporter ions,reporter ion interferencewas calculated.
Table 1–Intensity distribution of the iTRAQ and TMT reporter ions. Median reporter ion intensity of all unique peptide PSMs are listed. Median of the TMT reporter ion intensities was approximately 2 times higher than the iTRAQ reporter ions.
iTRAQ channel Reporter-ion intensities (median) TMT channel Reporter-ion intensities (median) 113 2206 126 4384 114 2286 127 4460 115 2109 128 4244 116 2110 129 4567 117 2176 130 4503 118 2150 131 4573 119 2190 – 121 2449 –
FromFig. 3we can see that in some instances where the spiked amount is 0, we may get a quantitative signal in the MS analysis. This could sometimes be explained by the presence of the protein in the cell line background. But, as we see in Fig. 3, it is also an effect of precursor mixing. From the graphs inFig. 3A and B we can further see that despite the poor correlation betweenisolation interferenceandreporter ion interference, both measures affect the quantitative accuracy. From the results it appears that theisolation interference(MS1 interference) has a smaller effect on the quantitative accuracy than thereporter ion interference(MS2 interference) percentage. Generally, we can state that an isolation interference up to approximately 30% yields a good accuracy. From our data we observed that, of the total number of PSMs, approximately 2/3 have anisolation interference percentage below 30%. Our observations are in line with a recent study [21] showing that TMT quantitative measurements deviate from label-free quantification of identical samples when the estimated isolation interference exceeds 20%. Looking at thereporter ion interference on the other hand, we observed that even very small changes (<30%) seem to correlate with erroneous quantification. A strong motivation for focusing our further evaluation on theisolation interferencewas the requirements for a specialized study design
to measure reporter ion interference and the above discussed approximate nature of thereporter ion interference.
Another observation from this analysis is that comparing iTRAQ and TMT; iTRAQ quantification appears less sensitive towardsisolation interference.
Comparing the graphs of the spiked protein standards ranging 8.7–60.8 fmol (A-mix) and 0.87–6.08 fmol (B-mix) in Fig. 3, we can also see that precursor mixing in terms of isolation interference has a bigger impact on the quantitative accuracy at lower protein levels. This is also clearly seen among the protein standards spiked in log4 steps (0.0023–37.5 fmol, G-mix), which consists of a wider range of protein levels. The low levels in the G-mix correspond to those in the C–F mixes (<0.6 fmol), which were below the quantification limit.
By looking at the proteins in the B-mix, it appears that the accuracy of the quantification is improved by accepting less isolation interference. Increasing the stringency by tolerating less isolation interferenceis a balance between keeping PSMs needed for a robust identification and removing those having a high percentage ofisolation interferencethat improves the accuracy. One compromise could be to employ a higher tolerance for identification purposes, while maintaining a more stringent isolation interferencelimit for quantification purpose.
Fig. 3–Spiked standard protein amount versus measured reporter ratio of the peptide spectrum matches. In (A) TMT was set as label, and iTRAQ as contaminant. In (B) iTRAQ was set as label, and TMT as contaminant. The PSMs are grouped graph-wise according to standard protein mix, assuming that all PSMs plotted together have the same expected amounts. Graph coloring is according to theisolation interferenceorreporter ion interferencepercentage of the PSMs used in the quantification. The median of the measured ratios of the PSMs are plotted in bins of 10%. When calculating the ratio, the sample with the highest amount was used as denominator. Bothisolation interferenceandreporter interferenceare defined as described in the text. The datasets shown were acquired using pI pre-fractionation 3.7–4.9, LC-gradient length 45 min. The samples were subject to three modes of fractionation prior to MS analysis as described in theMaterials and methodssection (also illustrated inFig. 1B). The corresponding plots for pI ranges 3.7–4.9 (90 min LC gradient) and IPG pI 4–7 (45 min LC gradient) are shown in Suppl. Fig. S4.
3.3. Linear range of quantification
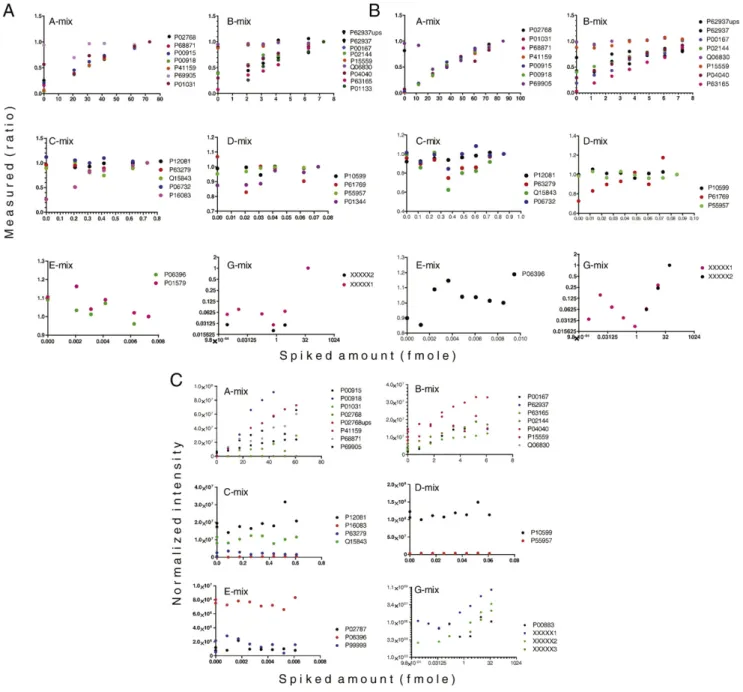
As described in theMaterials and methodssection (Fig. 1A), the 57 protein standards were divided into 7 protein sets;“A–G mixes”; based on amount. Protein mixes A–F were added in linear dilution steps across the samples, and the G-mix was added in log4 steps. To evaluate quantitative accuracy, the intensity measures were plotted versus the known added amounts of spiked proteins and the linearity of the relationship was studied. While inFig. 3 the protein levels in each mix were combined, in Fig. 4 the quantitative measurements of
individual proteins are plotted separately. The results from the quantification of the labeled peptides are shown inFig. 4A and B.
Based on our observations in Fig. 3regarding the effects of isolation interference on protein accuracy, we set limits of accepted isolation interference % of the PSMs used in the quantification to 30% for quantification of high abundance proteins (i.e. A-mix). For the quantification of lower protein amounts (B- to G-mixes), we increased the stringency to allow maximum 10%isolation interference. The corresponding plots withisolation interference< 30% are shown in Suppl. Fig. S5. We
Fig. 4–Correlation of theoretical molar amounts versus measured reporter ratios of the standard proteins by label-based and label-free quantification. Allowed upper limit ofisolation interferencefor PSMs used in the quantification was set to 30% for the A-mix and 10% for the lower level protein mixes B–G (data from F-mix, below the quantification limit, is not shown). Coloring is according to protein species. In (A) is shown the TMT quantification, and in (B) the iTRAQ quantification. Dataset: pI 3.7–4.9, LC 45 min. (C) label-free quantification, correlation between theoretical and measured amounts (normalized feature intensity) of spiked in proteins. The analysis was performed on 9 samples (analyzed in triplicates).
reasoned that as peptide quantification is based on median PSM intensity, low abundant protein accuracy will be more sensitive toisolation interference, hence the stricter limit.
Fig. 4A and B indicates that we have a linear range of quantification from approximately 1 fmol for both methods. For TMT, the calibration curves are linear from the measure point 2 fmol (Fig. 4A), and for iTRAQ from 1.2 fmol (Fig. 4B). The lower measure point of 1.2 fmol was not included in the TMT 6-plex. The calibration curves below 1 fmol are noisy, and below the quantification limit for both labeling methods. In general, there is linearity between 0.87 and 6 fmol (B-mix); while there is no linearity between 0.087 and 0.6 fmol (C-mix), with few exceptions. In the C-mix, at the lower end of the quantification limit, the linearity is true only for some proteins. InFig. 4A, from around 0.2 fmol, (TMT, C-mix); the signal from the proteinP16038correlates well with the spiked amount. Looking at the same graph, this is not the case for proteinQ15843. In the corresponding graph for iTRAQ (Fig. 4B, C-mix) we detected no protein for which the signal correlated linearly with the amount.
For both TMT and iTRAQ, the lower limit of the linear range of quantification judging from the G-mix which contains proteins in a wider range (0.002–40 fmol) also appears to be approximately 1 fmol.
From the graphs showing the A- and G-mixes we can also see that, with the maximum amounts spiked (85 and 52 fmol), we did not reach the upper limit of linear quantification. The dynamic range can therefore not be properly estimated, but is at least 1 order of magnitude for both iTRAQ and TMT, which is in line with other studies[37].
Precursor interference is known to increase false negative identifications [9]. As we see from our data (Fig. 3) it also affects the quantification accuracy of low level proteins. The main risk of a too tolerant limit for precursor interference is thus to miss picking up relevant biomarker candidates. By reducing the acceptance level ofisolation interference% among the PSMs in the dataset analyzed, the accuracy of measured protein alterations should increase, as seen in Fig. 3. The calibration curves shown inFig. 4A and B were plotted with 50, 30 and 10% limits for the PSMs. We studied the calibration curves but saw no obvious improvements of the lower limits of the quantitative linear range for individual proteins when changing from 30 to 10% maximum allowedisolation interference. This is probably because the majority of the PSMs haveisolation interferencebelow 20% (Suppl. Fig. S1), and the quantities on protein level are based on median PSMs for peptide ratio calculations. Although we saw no clear improvement of accuracy on individual protein level (Fig. 4), we set the limit for isolation interference on low-level proteins to 10% based on the results shown inFig. 3A and B (B-mix in particular).
For the un-fractionated samples analyzed by label-free quantification, normalized intensity measurements were plot-ted versus the known added amounts to evaluate quantitative accuracy,Fig. 4C. The label-free measurements correlated well across triplicates (Suppl. Fig. S6A and B), with a correlation coefficient of R2= 0.97–0.99. The technical triplicates were combined in the calculation of the feature intensities of the 9(×3) samples.
Proteins from the A-mix (range 8–60 fmol) were within the linear range of quantification (Fig. 4C). In the B-mix, for some
proteins (e.g. P04040), the quantification range was linear down to 0.8 fmol, while for other proteins there was no linear response at those levels (P15559). From the graphs showing the C- to E-mix proteins, we can see that these proteins were below the quantification limit in our study. Judging by the proteins in the G-mix on the other hand, with the non-mammalian proteins XXXX2 (TPIE. coli) andP00883, the linear range of quantification appeared to stretch from 0.15 fmol. Peptides from theE. coliprotein are not likely to be found in the cell lysate background, and are hence reliable in that sense. Like in the iTRAQ and TMT based quantification; the upper limit of linear quantification was not reached.
Further, 1 more spiked protein standard (G-mix) was identified in our label-free quantification approach compared to the label-based. pI calculations performed on the two peptides supporting its identification showed that they were basic peptides (pI 5.4 and 6.5), and hence not within the selected pI range (3.7–4.9) used in the pre-fractionation of the labeled samples.
3.4. Limit of detection
The limit of detection (LOD), defined as 3 times the standard deviation of the background level, was estimated for the different labeling methods. The calculation of the standard deviation was based on the quantities of all proteins in the cell line across the six (TMT), eight (iTRAQ) or nine (label-free) analyses; assuming equal background protein amount across samples (spiked protein standards excluded). For the isobaric labels, the limits were calculated from the relative quantifi-cation and from the label-free analysis the limits were calculated from the normalized raw intensities (absolute quantification). Values were log2transformed. For the iTRAQ and TMT based analyses, the limit of maximum 30%isolation interferencePSM level was used.
The LOD for the label-free was estimated and compared with the calibration curves calculated from the spiked in proteins, as shown in Fig. 4C, giving an indication of the quantification limits in amounts. This gave an LOD corre-sponding to approximately 1 fmol. For iTRAQ and TMT it is only possible to measure relative amounts. Hence the noise level calculations could not be translated back into peak intensities and further to corresponding amounts in the sample. We could however see that in our analysis, the noise level on relative amounts is lower in the 6-plex TMT analysis compared to 8-plex iTRAQ (Suppl. Fig. S7). This indicates that comparing the two isobaric methods used in this study, 6-plex TMT is more sensitive.
We also compared the LOD estimated from background signals with the readout from the calibration curves for the label-free analysis (Fig. 4C). In relation to the corresponding calibration curves for iTRAQ and TMT, we could observe linearity in approximately the same ranges (i.e. from 1 fmol) between all three quantification approaches. Other studies find isobaric labels more sensitive regarding the quantifica-tion of proteins with small changes[15,36], while less accurate to determine higher fold changes, presumably due to precur-sor mixing[12]. We did not observe such trend.
A lower detection limit of 1 fmol in an MS injection volume of 1μL corresponds to approximately 0.05 ng/μL (50μg/mL),
assuming an average protein size of 50 000 Da. Assuming zero protein loss in the sample preparation, the lower detection limit would thus be a protein concentration > 50 ng/mL in the original sample solution. To obtain the cellular protein copy number 1 fmol would correspond to; we calculated the number of proteins in 1 fmol by multiplying with Avogadro's constant. To get protein number per cell, we divided this with the cell number yielding 20μg, which was the protein amount labeled with each channel. Protein yield for the mcf-7 cell line was assumed 400μg/million cells. According to our estima-tions, 1 fmol corresponds to an approximated number of 12 000 copies per cell. Referring to the literature, proteins with cell copy number in this range are moderately abundant, and enriched of proteins involved in protein sorting and localiza-tion, for example GTP-binding nuclear protein Ran (UniProt accessionP62826). We could however not reach the detection limits of low abundant proteins, kinases and transcription factors involved in catalyzing post-translational modifica-tions or regulation of cellular processes[38].
3.5. Conclusions
We have shown that for individual proteins in high complexity samples such as a mammalian cell lysate, the linear range of quantification has a lower limit at approximately 1 fmol, for both the isobaric and label-free workflows used in this study. It is important to note however that due to the difference in pre-fractionation direct comparisons between the label-free and label-based approaches in this study are not possible. By a rough estimate, 1 femtomole amount corresponds to a cell copy number of 12000, which is in the range of moderately abundant proteins[38,39]. The upper limit of linear quantification was not reached in this study and hence exceeds 60 fmol.
The importance of protein quantification accuracy is underlined by studies showing that proteins tend to be ubiquitously expressed, with tissue specific characteristics influenced by protein levels rather than absence/presence [40,41]. Our investigation of protein quantification accuracy and isobaric labeling showed that the accuracy is affected by precursor mixing. Our results showed that reporter ion interferencein the fragmentation window was more linked to quantitative accuracy thanisolation interferencemeasured in the ion selection window. As measuring reporter ion interference is unpractical, we evaluated a cut off on accepted isolation interference to limit the impact of precursor mixing on quanti-tative accuracy. Accordingly, we propose an upper limit of 30% isolation interferencefor PSMs used in protein quantification.
Conflict of interest statement
The authors have declared no conflict of interest.
Acknowledgments
This study was supported by grants from Swedish Research Council, Swedish Cancer Society, EU FP7 GlycoHit project, Stockholm's Cancer Society and Karolinska Institute's PhD
funding (KID). The data deposition to the ProteomeXchange Consortium (http://proteomecentral.proteomexchange.org) via the PRIDE partner repository[42]was supported by the PRIDE Team. The authors would also like to thank BILS for the data publishing support to SweStore.
Appendix A. Supplementary data
Supplementary data to this article can be found online at http://dx.doi.org/10.1016/j.jprot.2013.10.035.
R E F E R E N C E S
[1]Nesvizhskii AI, Aebersold R. Interpretation of shotgun proteomic data: the protein inference problem. Mol Cell Proteomics 2005;4:1419–40.
[2]Aebersold R. A stress test for mass spectrometry-based proteomics. Nat Methods 2009;6:411–2.
[3]Nilsson T, Mann M, Aebersold R, Yates III JR, Bairoch A, Bergeron JJ. Mass spectrometry in high-throughput
proteomics: ready for the big time. Nat Methods 2010;7:681–5. [4]Hanash SM, Baik CS, Kallioniemi O. Emerging molecular
biomarkers—blood-based strategies to detect and monitor cancer. Nat Rev Clin Oncol 2011;8:142–50.
[5]Hanash S. Disease proteomics. Nature 2003;422:226–32. [6]Thompson A, Schafer J, Kuhn K, Kienle S, Schwarz J, Schmidt
G, et al. Tandem mass tags: a novel quantification strategy for comparative analysis of complex protein mixtures by MS/MS. Anal Chem 2003;75:1895–904.
[7]Ross PL, Huang YN, Marchese JN, Williamson B, Parker K, Hattan S, et al. Multiplexed protein quantitation in
Saccharomyces cerevisiaeusing amine-reactive isobaric tagging reagents. Mol Cell Proteomics 2004;3:1154–69.
[8]Michalski A, Cox J, Mann M. More than 100,000 detectable peptide species elute in single shotgun proteomics runs but the majority is inaccessible to data-dependent LC–MS/MS. J Proteome Res 2011;10:1785–93.
[9]Houel S, Abernathy R, Renganathan K, Meyer-Arendt K, Ahn NG, Old WM. Quantifying the impact of chimera MS/MS spectra on peptide identification in large-scale proteomics studies. J Proteome Res 2010;9:4152–60.
[10] Karp NA, Huber W, Sadowski PG, Charles PD, Hester SV, Lilley KS. Addressing accuracy and precision issues in iTRAQ quantitation. Mol Cell Proteomics 2010;9:1885–97. [11] Bantscheff M, Boesche M, Eberhard D, Matthieson T,
Sweetman G, Kuster B. Robust and sensitive iTRAQ quantification on an LTQ Orbitrap mass spectrometer. Mol Cell Proteomics 2008;7:1702–13.
[12] Ow SY, Salim M, Noirel J, Evans C, Rehman I, Wright PC. iTRAQ underestimation in simple and complex mixtures: “the good, the bad and the ugly”. J Proteome Res 2009;8:5347–55.
[13] Altelaar AF, Frese CK, Preisinger C, Hennrich ML, Schram AW, Timmers HT, et al. Benchmarking stable isotope labeling based quantitative proteomics. J Proteomics 2013;88:14–26. [14] Mertins P, Udeshi ND, Clauser KR, Mani DR, Patel J, Ong SE, et al. iTRAQ labeling is superior to mTRAQ for quantitative global proteomics and phosphoproteomics. Mol Cell Proteomics 2012;11 [M111 014423].
[15] Wang H, Alvarez S, Hicks LM. Comprehensive comparison of iTRAQ and label-free LC-based quantitative proteomics approaches using twoChlamydomonas reinhardtiistrains of interest for biofuels engineering. J Proteome Res
[16] Ow SY, Salim M, Noirel J, Evans C, Wright PC. Minimising iTRAQ ratio compression through understanding LC–MS elution dependence and high-resolution HILIC fractionation. Proteomics 2011;11:2341–6.
[17] Savitski MM, Sweetman G, Askenazi M, Marto JA, Lang M, Zinn N, et al. Delayed fragmentation and optimized isolation width settings for improvement of protein identification and accuracy of isobaric mass tag
quantification on Orbitrap-type mass spectrometers. Anal Chem 2011;83:8959–67.
[18] Christoforou A, Lilley KS. Taming the isobaric tagging elephant in the room in quantitative proteomics. Nat Methods 2011;8:911–3.
[19] Ting L, Rad R, Gygi SP, Haas W. MS3 eliminates ratio distortion in isobaric multiplexed quantitative proteomics. Nat Methods 2011;8:937–40.
[20] Wenger CD, Lee MV, Hebert AS, McAlister GC, Phanstiel DH, Westphall MS, et al. Gas-phase purification enables accurate, multiplexed proteome quantification with isobaric tagging. Nat Methods 2011;8:933–5.
[21] Savitski MM, Mathieson T, Zinn N, Sweetman G, Doce C, Becher I, et al. Measuring and managing ratio compression for accurate iTRAQ/TMT quantification. J Proteome Res 2013;12:3586–98.
[22] Chelius D, Bondarenko PV. Quantitative profiling of proteins in complex mixtures using liquid chromatography and mass spectrometry. J Proteome Res 2002;1:317–23.
[23] Wiener MC, Sachs JR, Deyanova EG, Yates NA. Differential mass spectrometry: a label-free LC–MS method for finding significant differences in complex peptide and protein mixtures. Anal Chem 2004;76:6085–96.
[24] Eriksson H, Lengqvist J, Hedlund J, Uhlen K, Orre LM, Bjellqvist B, et al. Quantitative membrane proteomics applying narrow range peptide isoelectric focusing for studies of small cell lung cancer resistance mechanisms. Proteomics 2008;8:3008–18.
[25] Lengqvist J, Uhlen K, Lehtio J. iTRAQ compatibility of peptide immobilized pH gradient isoelectric focusing. Proteomics 2007;7:1746–52.
[26] Arabi A, Ullah K, Branca RM, Johansson J, Bandarra D, Haneklaus M, et al. Proteomic screen reveals Fbw7 as a modulator of the NF-kappaB pathway. Nat Commun 2012;3:976.
[27] Kocher T, Pichler P, Schutzbier M, Stingl C, Kaul A, Teucher N, et al. High precision quantitative proteomics using iTRAQ on an LTQ Orbitrap: a new mass spectrometric method combining the benefits of all. J Proteome Res 2009;8:4743–52. [28] Eng JK, Mccormack AL, Yates JR. An approach to correlate
tandem mass-spectral data of peptides with
amino-acid-sequences in a protein database. J Am Soc Mass Spectrom 1994;5:976–89.
[29] Kall L, Canterbury JD, Weston J, Noble WS, MacCoss MJ. Semi-supervised learning for peptide identification from shotgun proteomics datasets. Nat Methods 2007;4:923–5. [30] Cox J, Mann M. MaxQuant enables high peptide identification
rates, individualized p.p.b.-range mass accuracies and proteome-wide protein quantification. Nat Biotechnol 2008;26:1367–72.
[31] Luber CA, Cox J, Lauterbach H, Fancke B, Selbach M, Tschopp J, et al. Quantitative proteomics reveals subset-specific viral recognition in dendritic cells. Immunity 2010;32:279–89. [32] Nagaraj N, Mann M. Quantitative analysis of the intra- and
inter-individual variability of the normal urinary proteome. J Proteome Res 2011;10:637–45.
[33] Papakostas S, Vasemagi A, Vaha JP, Himberg M, Peil L, Primmer CR. A proteomics approach reveals divergent molecular responses to salinity in populations of European whitefish (Coregonus lavaretus). Mol Ecol 2012;21:3516–30. [34] Cox J, Neuhauser N, Michalski A, Scheltema RA, Olsen JV, Mann
M. Andromeda: a peptide search engine integrated into the MaxQuant environment. J Proteome Res 2011;10:1794–805. [35] Hulsen T, de Vlieg J, Alkema W. BioVenn—a web application
for the comparison and visualization of biological lists using area-proportional Venn diagrams. BMC Genomics 2008;9:488.
[36] Li Z, Adams RM, Chourey K, Hurst GB, Hettich RL, Pan C. Systematic comparison of label-free, metabolic labeling, and isobaric chemical labeling for quantitative proteomics on LTQ Orbitrap Velos. J Proteome Res 2012;11:1582–90.
[37] Pichler P, Kocher T, Holzmann J, Mazanek M, Taus T, Ammerer G, et al. Peptide labeling with isobaric tags yields higher identification rates using iTRAQ 4-plex compared to TMT 6-plex and iTRAQ 8-plex on LTQ Orbitrap. Anal Chem 2010;82:6549–58.
[38] Beck M, Schmidt A, Malmstroem J, Claassen M, Ori A, Szymborska A, et al. The quantitative proteome of a human cell line. Mol Syst Biol 2011;7:549.
[39] Mann M, Kulak NA, Nagaraj N, Cox J. The coming age of complete, accurate, and ubiquitous proteomes. Mol Cell 2013;49:583–90.
[40] Geiger T, Wehner A, Schaab C, Cox J, Mann M. Comparative proteomic analysis of eleven common cell lines reveals ubiquitous but varying expression of most proteins. Mol Cell Proteomics 2012;11 [M111 014050].
[41] Lundberg E, Fagerberg L, Klevebring D, Matic I, Geiger T, Cox J, et al. Defining the transcriptome and proteome in three functionally different human cell lines. Mol Syst Biol 2010;6:450. [42] Vizcaino JA, Côté RG, Csordas A, Dianes JA, Fabregat A, Foster JM, et al. The Proteomics Identifications (PRIDE) database and associated tools: status in 2013. Nucleic Acids Res 2013;41: D1063–9.