MECHANICS OF LITHIUM-ION BATTERY ELECTRODES
BY
ELIZABETH M. C. JONES
DISSERTATION
Submitted in partial fulfillment of the requirements
for the degree of Doctor of Philosophy in Theoretical and Applied Mechanics in the Graduate College of the
University of Illinois at Urbana-Champaign, 2015
Urbana, Illinois
Doctoral Committee:
Professor Nancy R. Sottos, Chair and Director of Research Professor Scott R. White
Professor Andrew A. Gewirth Assistant Professor Sameh Tawfick
Abstract
Lithium-ion battery technology has improved tremendously since it was first commercialized in the 1990s, and today lithium-ion batteries are one of the lightest and smallest rechargeable batteries commercially available [1]. While lithium-ion batteries are ubiquitous in portable electronics, limited lifetime and reliability hinder widespread adoption of the batteries in large-scale energy storage devices such as in electric vehicles. Key areas of active research that offer potential to improve lithium-ion batteries include the development of new anode and cathode materials and new electrolytes, a more complete understanding of in situ and artificial interfacial stabilization processes at the electrode / electrolyte interface, and strate-gies to mitigate combined electro-chemo-mechanical degradation of the batteries resulting from extended electrochemical cycling.
The present work touches on all three of these areas by investigating the electrochemically-induced mechanical response of lithium-ion battery anodes. First, an experimental protocol was developed to measure the strains induced in free-standing battery electrodes (i.e. uncon-strained electrodes not adhered to a substrate) due to electrochemical processes. Graphite composite electrodes, similar to commercial battery anodes, were investigated first to garner baseline results. The electrodes were comprised of particles of graphite as the active mate-rial, carbon black for a conductive additive, and a polymer binder. Reversible macroscale electrode deformation was traced to nanoscale changes in graphite layer spacing as lithium was inserted into and removed from the electrodes. Irreversible electrode deformation was correlated with accumulation of electrolyte decomposition products on the surface of the elec-trode. Many parameters were varied, including the electrode composition (ratio of graphite
to carbon black as well as the choice of polymer binder), electrolyte composition, and cy-cling rate. The effect of the variation of these parameters on the strain response of graphite composite electrodes was investigated.
In situ strain measurements of free-standing graphite composite electrodes were combined with in situ stress measurements of electrodes adhered to a substrate. A new electro-chemo-mechanical property of the electrodes, the “electrochemical stiffness,” was defined as a measure of the relative effects of stress compared to strain at any point during electrochemical cycling. Changes in the electrochemical stiffness as a function of electrode potential or capacity provided new insights into the mechanisms governing electrochemically-induced stress and strain development in graphitic electrodes.
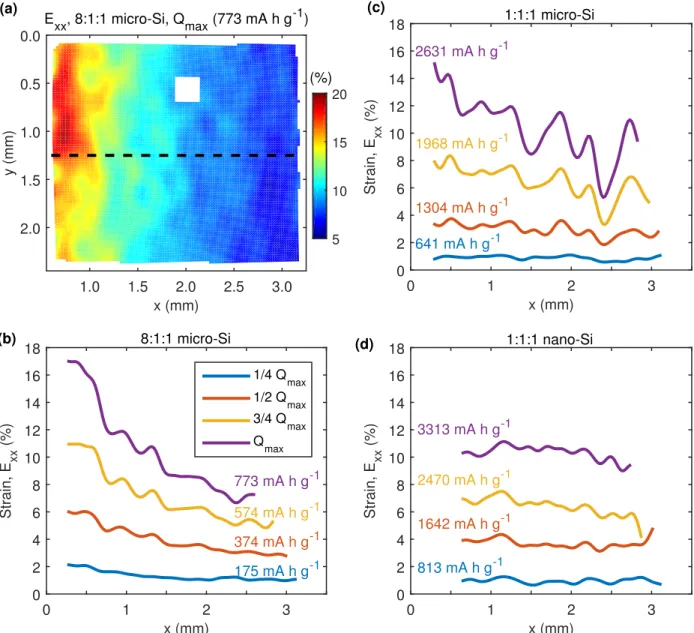
Finally, the strain response of high-capacity silicon composite electrodes was investigated and compared to the strain response of composite graphite electrodes. The large volumetric expansion of silicon during lithiation (ca. 300 - 400 %) caused the electrodes to fracture and pulverize where they were attached to a substrate, which frustrated in situ strain mea-surements. Therefore, strain was measured only during the initial, partial lithiation of silicon-based electrodes, before the electrodes fractured. The macroscopic strain developed in the electrodes was dominated by the total amount of lithium inserted into the electrode. The type of active material (either graphite or silicon) and the ratio of electrode compo-nents (active material, conductive additive, and polymer binder) were found to be secondary influences, while the size of the active material particles had insignificant influence on the average strain response of the electrodes.
Acknowledgments
When I was younger, I didn’t have a dream or a passion to be a scientist, an engineer, or a researcher. I liked school, and I was good at math (though often only with significant effort). Those characteristics alone formed the basis of a series of circuitous (though in hindsight, fortuitous) decisions that have culminated in this thesis. From here, the possibilities are endless, and I’m looking forward to following the trail as I go, excited to see what’s around the next corner. Looking back, however, I can say that there are innumerable people who have helped me get to this position, even if some of us didn’t see the end goal at the time:
My parents, Pamela and Marvin Cler, who supported me in everything I have done.
My husband, Mark Jones, who has patiently waited on me while I finish not one, not two, but three degrees, who supported me financially during part of my undergrad years (and who is still waiting for the return on his investment), and who has listened to me talk enthusiastically and gripe, in nearly equal measures, about my work.
My advisors, Professor Nancy Sottos and Professor Scott White. It goes without saying that without them, I would never have become the scientist and researcher that I am today.
My committee members, Prof. Andrew Gewirth and Prof. Sameh Tawfick, for offering fresh perspectives on my work and helpful suggestions.
My collaborators, Dr. Meredith Silberstein and Dr. Hadi Tavassol. Together, we achieved things I could not have done alone.
Dr. Amanda Jones, who initially “did not work with people,” but who eventually became both a great colleague and a great friend.
The battery team, for all of the useful brainstorming about the challenges that accompany working with batteries: Dr. Marta Elleby, Dr. Sen Kang, Taewook Lim, Dr. Oya Okman, and Dr. ¨O. ¨Ozg¨ur C¸ apraz.
My non-battery labmates, for their discussions, support, and help with all sorts of miscel-laneous tasks during grad school: Dr. Jason Patrick, Dr. Andrew Hamilton, Dr. Cassandra Degen, Dr. Brett Beiermann, Ryan Gergley, Brett Krull, Kevin Hart, Stephen Pety, and Ke Yang.
Colleagues at Caterpillar’s Champaign Simulation Center, especially Jeff Fullilove, Mike Henry, and Michael Lopez. These guys informally taught me as much during my internship as my professors taught me in the classroom.
All the people who selflessly helped me during my first year, when they knew they would probably get nothing useful back from a first year grad student: Dr. Brandon Long, Dr. David McIlroy, Dr. James Sobotka
All the educators who subtly and overtly influenced me to pursue a Ph.D. in engineering: Mrs. Sigler, my second grade teacher who let me build my marshmallow and toothpick tower taller than I was; Mrs. Akers and Mr. Herman, my high school math teachers; Professor Phillips, who convinced me to go to the U of I by giving me a personal tour of the 3 million pound crusher; Professor Weaver, who volunteered to advise a group of undergrads who wanted to build a non-linear spring-mass system just for fun.
And finally last, but in many ways not least, my pets, Cheech, Fitz, Hercules, and the Fool, who provided invaluable stress relief.
Table of Contents
List of Abbreviations . . . x
List of Symbols . . . xi
Chapter 1 Introduction . . . 1
1.1 Overview of Lithium-Ion Batteries. . . 1
1.2 Graphite-Lithium Intercalation Compounds . . . 2
1.3 Electrochemically-Induced Strain in Anodes . . . 4
1.4 Electrochemically-Induced Stress in Anodes . . . 5
1.5 Chemo-Mechanical Electrode Degradation at High Cycling Rates . . . 6
1.6 Solid-Electrolyte Interphase (SEI) . . . 6
1.7 Overview and Outline of Dissertation . . . 7
Chapter 2 In Situ Strain Measurements of Battery Electrodes . . . 10
2.1 Custom Battery Cell . . . 10
2.2 Speckle Pattern . . . 13
2.3 Analytical Prediction of Composite Electrode Expansion . . . 15
2.4 Materials and Methods . . . 21
2.5 Conclusions . . . 29
Chapter 3 Deformation of Graphite Electrodes . . . 30
3.1 Representative Electrode Response . . . 30
3.2 Reversible Behavior . . . 38
3.3 Irreversible Behavior . . . 42
3.4 Conclusions . . . 45
Chapter 4 Effect of Electrode Composition, Cycling Rate, and Electrolyte Composition . . . 46
4.1 Effect of Polymer Binder . . . 46
4.2 Effect of Carbon Black . . . 50
4.3 Effect of Cycling Rate and Cycling Time . . . 53
4.4 Effect of Electrolyte Composition . . . 57
Chapter 5 Electrochemical Stiffness Variations of Graphite Electrodes . 68
5.1 Electrochemical Stiffness . . . 68
5.2 Stress and Strain Development. . . 70
5.3 Potential Dependence of the Mechanical Response . . . 72
5.4 Capacity Dependence of the Mechanical Response . . . 75
5.5 Rate Dependence of the Mechanical Response . . . 78
5.6 Conclusions . . . 81
Chapter 6 Deformation of Silicon Electrodes . . . 82
6.1 Electrode Fabrication . . . 82
6.2 Electrode Attachment to Custom Battery Cell . . . 84
6.3 Strain Response of Silicon Composite Electrodes . . . 93
6.4 Conclusions . . . 98
Chapter 7 Summary and Directions for Future Work . . . 99
Appendices. . . 103
Appendix A Supplementary Information on the Solid-Electrolyte Inter-phase . . . 104
A.1 Electrolyte Solvent Decomposition Mechanisms . . . 104
A.2 Non-Recoverable Deformation of Electrodes . . . 108
Appendix B Effect of Carbon Black on Electrode Conductivity . . . 112
B.1 Electrical Conductivity Measurements . . . 112
B.2 Conductivity Results . . . 113
B.3 Effect of Electrode Conductivity on Electrochemical Response . . . 114
Appendix C Supplementary Information on Vinylene Carbonate Study 117 Appendix D Supplementary Information for Electrochemical Stiffness Study120 D.1 Electrode Fabrication . . . 121
D.2 Electrochemical Cycling . . . 121
D.3 Stress and Strain Measurements . . . 121
D.4 Synchronization of Stress and Strain Data . . . 122
D.5 Anodic Sweep of Cyclic Voltammetry . . . 125
D.6 Identification of G-LICs . . . 125
D.7 Absolute Magnitude of Electrode Stiffness . . . 126
Appendix E Mechanical Behavior of Silicon Electrodes with Dynamic Bonding . . . 127
Appendix F Documentation for Matlab-Based Digital Image Correlation Code. . . 130 F.1 Introduction . . . 130 F.2 Updates . . . 130 F.3 Configuration . . . 133 F.4 Code Structure . . . 135 F.5 Example Correlation . . . 139
F.6 Detailed Explanation of Main GUIs . . . 159
F.7 Performance of Code . . . 171
F.8 Concluding Remarks . . . 172
Appendix G Accuracy and Precision of Matlab-Based DIC Code . . . . 173
G.1 Introduction . . . 173
G.2 Results Summary . . . 174
Sample 1 (TexGen Shift in X, Y with varying contrast) . . . 178
Sample 2 (TexGen Shift in X, Y with low contrast) . . . 183
Sample 3 (FFT Shift in X, Y) . . . 187
Sample 4 (FFT Shift in X, Y with low contrast) . . . 190
Sample 5 (FFT Shift in X, Y with varying contrast) . . . 193
Sample 6 (Prosilica Bin Shift in X, Y) . . . 195
Sample 7 (Prosilica Bin Shift in X, Y) . . . 196
Sample 8 (TexGen Rotation). . . 197
Sample 9 (FFT Rotation) . . . 202
Sample 10 (Large Strain) . . . 204
Sample 11b (Strain Discontinuity) . . . 210
Sample 14 (Varying Strain, FFT) . . . 213
Sample 15 (Varying Strain, TexGen) . . . 217
Appendix H Synthesis of Fluorescent Silica Nanoparticles. . . 221
H.1 Materials . . . 221 H.2 Equipment . . . 221 H.3 Preparation . . . 221 H.4 Recipe . . . 222 H.5 Procedure . . . 223 H.6 Notes. . . 224 References . . . 225
List of Abbreviations
CB Carbon Black
CMC Carboxymethyl Cellulose
C/X Charging rate (X hours to fully charge the battery) CV Cyclic Voltammetry
DIC Digital Image Correlation DMC Dimethyl Carbonate EC Ethylene Carbonate
G Graphite
G-LIC Graphite-Lithium Intercalation Compound GS Galvanostatic
GUI Graphical User Interface PVdF Poly(Vinylidene Fluoride) SEI Solid-Electrolyte Interphase SEM Scanning Electron Microscope VC Vinylene Carbonate
List of Symbols
E Finite Strain I Current f Stress-thickness k Electrochemical Stiffness σ Stress Q Capacity V Potential or VoltageChapter 1
Introduction
1.1
Overview of Lithium-Ion Batteries
Lithium-ion batteries are ubiquitous in small, portable electronics such as laptops and cell phones. However, widespread adoption of lithium-ion batteries for large-scale energy storage applications, such as electric cars, requires a significant improvement in the longevity and reliability of batteries [2].
A schematic of a lithium-ion battery is presented in Fig. 1.1. Lithium-ion batteries contain an anode (negative electrode), a cathode (positive electrode), and a separator to prevent contact between the electrodes. The electrodes are comprised of a porous composite layer, 100 - 150 µm thick, on top of a metal foil current collector, 10 - 25 µm thick. The porous composite contains particles of active material ca. 5 - 20 µm diameter, a nano-size conductive additive such as carbon black, and a polymer binder. Metal oxides, such as LiCoO2, LiMnO2 and Li(Ni1/3Co1/3Mn1/3)O2, typically serve as the active material for
cathodes, while graphite, lithium titanate (Li4Ti5O12), or silicon are typical active materials
for anodes. A lithium salt (e.g. lithium hexafluorophosphate (LiPF6)) is dissolved into
carbonate-based solvents (e.g. ethylene carbonate (EC) and dimethyl carbonate (DMC)) to form the electrolyte, which resides in the pores of the electrodes and separator.
During the operation of lithium-ion batteries, lithium ions are shuttled between the two electrodes. The insertion of ions into and out of electrodes induces cyclic volumetric changes and displacements (strain) of the active material in the electrodes. Lithium interaction with electrodes also generates internal pressure (stress) within the electrode structure. These
Current collector Anode Solid-electrolyte interphase (SEI) Separator Cathode Current collector Lithium ions e -Discharge e -Charge
Figure 1.1: Schematic of a lithium-ion battery, depicting the main battery
com-ponents. During battery charge, lithium ions diffuse from the cathode through the
elec-trolyte and separator and insert into the anode. Electrons move in the same direction but through an external circuit. During battery discharge, or when the battery is used to power a device, lithium ions and electrons move in the opposite direction, from the anode to the cathode.
electrochemically-induced mechanical changes lead to power and capacity fade via changes in the electrode porosity and electrode fracture respectively [3]. Understanding the relationship between the electrochemically-induced mechanical response of battery electrodes and battery performance is critical for the development of high capacity electrodes and extended service life. This work focuses on characterizing the mechanical response of anodes, and specifically investigates graphite-based and silicon-based composite anodes.
1.2
Graphite-Lithium Intercalation Compounds
Graphite is currently the most common active material in commercial lithium-ion battery anodes. During battery charging, lithium ions intercalate between graphite layers, forming
a series of well-ordered graphite-lithium intercalation compounds (G-LICs): dilute stage I (LiCx, x>24), stage IV (LiC24), stage III (LiC18), dilute stage II (LiC18), stage II (LiC12), and
stage I (LiC6) [4, 5]. The structure of the intercalation compounds are shown schematically
in Fig. 1.2.
The preference for forming staged compounds instead of randomly organized compounds is due to a combination of attractive intraplanar interactions among the intercalated atoms and repulsive interplanar interactions between layers of intercalant [6]. The widely accepted model describing the mechanism of transitioning between intercalation compounds is the Daumas-H´erold intercalant-island model [7]. The model proposes that microscopic islands of intercalant form, leading to in-plane local domains of staged behavior. Neighboring domains
IVgIII III g
DIIgII IIgI
(c) Stage IV (LiC24) (d) Stage III (LiC18) (e) Stage II (LiC12) (f) Stage I (LiC6)
Side views (a) Top View
!"#$"% &'( )* +,-.% )"* /*0*12* 12*0*111* 111*0**!11*0*11* 11*0*1* 1* 34'/56* * 3/6* 34'/11*786* 111*9*!11* 34'/7:6* 12* 34'/8;6* 1(#$"%&'()*-'.<'=>*#,(."(.* (b)
Carbon atom (A-layer) Carbon atom (B-layer) Lithium atom
Figure 1.2: Structure of graphite-lithium intercalation compounds (G-LICs).
(a) Top view showing the in-plane spatial arrangement of lithium atoms in a fully intercalated (not dilute) stage, with one lithium atom per six carbon atoms. (b) The theoretical voltage of a graphite electrode as a function of lithium content. The voltage is constant during phase transitions and drops sharply once a stage is complete. (c) - (f) Side views showing the arrangement of layers of lithium atoms between graphite layers for stage IV, stage III, stage II, and stage I G-LICs. The roman numerals refer to the number of graphite layers associated with each layer of intercalated lithium. Adjacent graphite layers adopt AB stacking while graphite layers on either side of a layer of intercalated lithium adopt AA stacking.
are similarly staged, but within different graphite galleries. Transitions between different stages of intercalation compounds occur by sliding of intercalant islands within a gallery, along with the insertion of more intercalant (to increase the total intercalant concentration associated with the new stage).
1.3
Electrochemically-Induced Strain in Anodes
Each stage of G-LICs has a characteristic graphite layer spacing [4, 5, 8, 9], and changes in the layer spacing at the atomic scale are translated through multiple length scales. At the microscale, the volumetric expansion of fully intercalated (stage I) graphite particles has been calculated as ca. 10 % from density functional theory, with experimental x-ray diffraction measurements of ca. 13 % closely agreeing [8]. At the macroscale, we measured the dilation of free-standing composite graphite electrodes, i.e. electrodes that are not adhered to a current collector [10]. We found that fully lithiated electrodes develop approximately 1.5 -2.0 % linear strain, which corresponds to ca. 4.5 - 6.1 % volumetric expansion assuming isotropic expansion. These results are in good agreement with composite mechanics models. Constraining the electrodes on a current collector or substrate reduces the linear strain developed during lithiation to ca. 0.3 % strain [11, 12].
Silicon is a promising new anode material as it has more than 10 times the capacity as graphite. Concurrent with the high capacity, however, silicon expands more than 300 % by volume when it alloys with lithium [13], which leads to electrode fracture and even pulverization, as shown in Fig.1.3. Using a unique nano-battery cycled inside a transmission electron microscope, Liu et al. [14] studied the expansion of individual silicon nano-wires and nano-particles during lithiation and showed that particles smaller than a certain threshold (ca. 150 nm) do not crack. Beaulieu et al. [13] adapted an atomic force microscope to study the expansion and cracking of thin films of silicon during lithiation. Moving to composite electrodes, Timmons et al. [15] observed particle motion and expansion in a composite
Figure 1.3: Transmission electron micrographs of the lithiation-induced fracture
of a silicon particle. (a-d) As the particle is lithiated, a shell of lithiated silicon forms
on the outside while a core of unlithiated silicon remains in the interior of the particle. (e) Fractures initiate at the edge of the particle, marked by the red triangles. (f) The fractures grow upon further lithiation. (g) The particle pulverizes. Image reproduced from [14].
electrode qualitatively using optical microscopy. Expanding to 3D measurements, Gonzalez et al. [16] characterized the microstructural evolution of silicon composite electrodes during the initial lithiation using x-ray computed tomography.
1.4
Electrochemically-Induced Stress in Anodes
In addition to investigating the deformation of electrodes, several studies have focused on quantifying the stress developed in electrodes during lithium insertion and removal. Sethu-raman et al. [17] used a substrate curvature technique to track the stress in thin film silicon electrodes during electrochemical cycling, and showed the cyclic development of compressive and tensile stresses. They later adapted their substrate curvature technique to quantify the stresses in composite graphite electrodes harvested from a commercial battery and in composite silicon electrodes [18, 19]. Mukhopadhyay et al. [20, 21] found that electrodes comprised of graphitic carbon aligned with basal planes parallel to a substrate developed significantly less stress than electrodes comprised of graphitic carbon aligned with basal
Complementing the experimental work, theoretical studies have been devoted to modeling the stress development in electrodes. Bower et al. [22] formulated a complete set of field equations and constitutive equations governing the coupled mechanics and electrochemistry of the lithiation and delithiation of silicon. Deshpande et al. [23] developed a mathematical model of diffusion-induced stress in nano-wire electrodes and found that surface effects can decrease diffusion-induced tensile stress, and thus reduce the probability of fracture.
1.5
Chemo-Mechanical Electrode Degradation at
High Cycling Rates
The electrochemically-induced stresses and strains in battery electrodes become more sig-nificant during high rate charging and discharging [24–26]. Strain analysis of composite electrode materials has revealed that lithiation and delithiation occur through heteroge-neous regimes within individual particles of active material or across the entire composite electrode [27–30]. Such heterogeneities are even more acute in high-rate exchange of lithium ions and cause sharp stress and strain gradients that ultimately lead to chemical and physical degradation of the electrodes [24, 27, 31].
1.6
Solid-Electrolyte Interphase (SEI)
After bulk lithiation / delithiation of the electrodes, the second most important set of elec-trochemical reactions in lithium-ion batteries is decomposition of electrolyte. Because of the low working voltage of graphite-based and silicon-based anodes (< 0.3 V vs Li+/0),
electrolyte species, including carbonate solvents, lithium salts, and impurities (e.g. water), reduce irreversibly at the anode surface when lithium-ion batteries are charged for the first time [32]. These reactions begin at ca. 0.8 V vs Li+/0 and continue to take place down to 0 V vs Li+/0 [33]. Electrolyte reduction products are deposited onto the surface of the
anode, forming a thin layer, ca. 10 - 100 nm thick, called the solid-electrolyte interphase (SEI) [32,34]. A summary of the decomposition mechanisms of common electrolyte solvents is presented in Appendix A.
Ideally, the SEI passivates the electrode surface, preventing further electrolyte decom-position. However, particle fracture induced by cyclic fatigue during repeated charge / discharge cycles exposes fresh anode surfaces to the electrolyte [3,30,35–44]. Lithium ions consumed during continuous electrolyte decomposition is one of the primary causes of capac-ity fade associated with the anode. Thus, the electrochemically-induced mechanical response of the electrode (i.e. dilation, stress development, and fracture) is directly connected to the longevity and reliability of lithium-ion batteries.
Additionally, Mukhopadhyay and Tokranov et al. [45, 46] correlated irreversible stress development in oriented graphitic carbon electrodes with the formation and growth of the SEI layer. They found that the irreversible stresses in the electrode due to SEI formation were of the same order of magnitude as the reversible stresses due to lithium intercalation / deintercalation. Tavassol et al. [47] found that the SEI formed on a model gold electrode also resulted in irreversible stress generation. These results showed for the first time that surface processes at the electrode / electrolyte interface directly affect the mechanical response of the electrodes.
1.7
Overview and Outline of Dissertation
In this research, the electrochemically-induced mechanical response of lithium-ion battery anodes is investigated. Chapter 2 outlines an experimental protocol that adapts digital image correlation (DIC) to measure the strain in battery electrodes during electrochemical cycling. In contrast to previous strain measurements of anodes constrained by a current collector [11, 12], we measure the free expansion of unconstrained electrodes, i.e. electrodes that are not on a current collector or other substrate. Additionally, an analytical model based on
porous composite theory predicts the expected composite electrode expansion based on the known expansion of the active material.
In Chapter 3, the representative electro-chemco-mechanical response of graphite compos-ite electrodes is discussed. The strain response of electrodes cycled on a current collector is compared to the strain response of free-standing, unconstrained electrodes. The expansion and contraction of free-standing electrodes is compared to the analytical model, and key parameters that influence the mechanical response of the electrode are identified through the model. Two mechanisms of deformation are identified: reversible deformation caused by the formation of different graphite-lithium intercalation compounds and non-recoverable deformation correlated with the formation and growth of the solid-electrolyte interphase.
Chapter 4 presents a systematic characterization of the strain response of free-standing composite graphite electrodes during electrochemical cycling. Specifically, the following pa-rameters are investigated because of their importance in electrode design and their strong influence on electrode mechanics: polymer binder, carbon black content, cycling rate, and electrolyte composition. These studies provide insight into how electrode composition, elec-trolyte composition and cycling rate affect the mechanical response of electrodes during electrochemical cycling and SEI formation and growth.
In Chapter 5, we combine in situ stress and strain measurements of graphite compos-ite electrodes during electrochemical cycling to calculate an electrochemical stiffness of the electrodes. In contrast to the elastic stiffness constants (e.g. Youngs modulus), the electro-chemical stiffness reported here is a measure of the potential or capacity dependence of the stress and strain responses of the electrodes. Variations in the electrochemical stiffness as a function of electrode potential and electrode capacity reveal fundamentally different mecha-nisms that govern stress compared to strain induced by lithium interactions with electrodes. Chapter 6 discusses the deformation of free-standing silicon composite electrodes. Chal-lenges in composite electrode fabrication and attachment of free-standing electrodes to a substrate are presented and discussed. The strain response of select silicon composite
elec-trodes are compared to the strain response of graphite composite elecelec-trodes during the initial lithiation of the electrodes.
Finally, a summary of this research and directions for future work are presented in Chap-ter 7. In total, the research presented in this dissertation provides key information about the electrochemically-induced mechanical response of lithium-ion battery anodes, which can be used to aid in the design of more robust and reliable electrodes for the next generation of lithium-ion batteries.
Chapter 2
In Situ
Strain Measurements of
Battery Electrodes
*
In this chapter, we describe the experimental protocol that allows strain measurements to be made on lithium-ion battery electrodes. Two custom battery cells were designed, one that utilizes an electrode on a current collector and one that utilizes a free-standing electrode. A chemically-inert, well-correlated speckle pattern for digital image correlation (DIC) was generated using fluorescent silica nano-particles. An analytical model based on porous composite theories was developed to predict the expansion of graphite-based electrodes. Finally, experimental details are presented for fluorescent particle synthesis, electrode fabrication, electrochemical cycling protocols, and strain analysis.
2.1
Custom Battery Cell
2.1.1
Initial Design
We designed and fabricated two custom battery cells to enable in situ, full-field strain mea-surements during lithiation and delithiation of lithium-ion battery electrodes. Our initial cell design is shown in Fig.2.1. Key features of the cell included side-by-side arrangement of electrodes and a quartz window that allowed optical access to the electrodes during cycling. The working electrode, 19 mm in diameter, was a graphite-based composite electrode fab-ricated on a copper current collector, similar to commercial batteries. It was adhered to a
*Significant portions of this chapter were published in E. M. C. Jones, M. N. Silberstein, S. R. White, N. R. Sottos. Exp. Mech. (2014) 54:971-985. The analytical model presented in Sec. 2.3 was formulated primarily by Dr. M.N. Silberstein while a post-doctoral researcher at the University of Illinois at Urbana-Champaign.
x y A F J ROI 10 mm Front view A D F G H I J Exploded view D B C (c) A (a) (b) (d) E
Figure 2.1: Initial design of the custom battery cell. (a) Front view of cell, (b)
ex-ploded schematic view of cell, (c) schematic cross section view of a full epoxy adhesive layer (18 mm), and (d) schematic cross section view of a small epoxy adhesive layer (5 mm). Bat-tery cell components are: (A) working electrode, (B) current collector, (C) epoxy adhesive layer, (D) stainless steel substrate for working electrode, (E) spring for electrical connection to working electrode, (F) lithium metal counter electrode, (G) stainless steel pins for me-chanical and electrical connection of counter electrode, (H) main body (insulator), (I) quartz window, (J) lid.
circular substrate with a thin layer of rigid epoxy, and electrical connection was made to the backside of the current collector by a spring placed in a hole in the substrate (Fig. 2.1c-d). The counter electrode was a ring of lithium metal surrounding the working electrode and was attached to stainless steel pins that protruded through the base of the cell.
Two different configurations were examined for the attachment of the working electrode to the substrate. In the first configuration (Fig.2.1c), the epoxy adhesive layer was approx-imately 18 mm in diameter, and it completely constrained the working electrode in-plane, except at the very edge of the electrode. In the second attachment configuration (Fig.2.1d), the diameter of the epoxy adhesive layer was decreased to 5 mm, so that only the center of the electrode was constrained.
2.1.2
Second Design
Based on the results from testing of the initial cell design (see Sec. 3.1.2), a second custom battery cell was designed that used a free-standing composite graphite electrode without a current collector (Fig.2.2). The free-standing electrode was cantilevered from the edge of a stainless steel substrate and spot welded to the substrate at one end. Spot welds created an electrical connection between the electrode and the battery circuit and fixed the electrode to the stainless steel substrate during cycling. On the opposite free edge of the electrode, a polymer support with a thin gap (approximately 200µm) limited the out-of-plane deflection of the electrode while allowing free in-plane expansion and contraction (Fig.2.2c-d). Similar to the initial cell design, lithium metal was used as the counter electrode, and a quartz window provided optical access to the electrodes during cycling.
Front view 10 mm A E I G Exploded view A B E F G H I 2 mm C B A D Constraint Limited Deflection Unconstrained Electrode B A D C (a) (b) (c) (d) ROI x y
Figure 2.2: Second design of the custom battery cell. (a) Front view of cell, (b)
exploded schematic view of cell, (c) magnified view of working electrode attachment config-uration, (d) schematic side view of working electrode attachment configuration. Battery cell components are: (A) free-standing working electrode (i.e. without a current collector), (B) substrate for working electrode, (C) spot welds, (D) polymer support for working electrode, (E) lithium metal counter electrode, (F) substrate for counter electrode, (G) main body (insulator), (H) quartz window, (I) lid.
2.2
Speckle Pattern
Composite graphite electrodes have a natural speckle pattern appropriate for DIC at large magnifications. During cycling, however, graphite changes color as a function of lithium content (Fig.2.3) [48], and individual speckles appear, disappear and change size and shape as particles of graphite deform and undergo rigid body motion. These changes lead to poorly-correlated speckle patterns.
To overcome the issues with the natural speckle pattern, we generated a speckle pattern by spin-casting fluorescent silica nano-particles on the electrode surface [49–51]. This method had the additional benefit of being general to electrode material and type. The particles were synthesized in house using standard particle processing techniques [52, 53], and had a core of silica coupled with a rhodamine-based fluorescent dye and a shell of pure silica to protect the dye from bleaching. During electrochemical cycling, a laser illuminated the electrode surface to excite the fluorescent particles, and the emitted fluorescent light was captured with a CCD sensor. Fig. 2.4a shows the experimental configuration of the battery cell, camera, and laser, Fig. 2.4b shows a representative speckle pattern generated by the particles on the graphite electrode, and Fig. 2.4c shows a scanning electron micrograph of a composite graphite electrode with the particles on its surface.
Increasing lithium content 1 mm
Figure 2.3: Natural color change of graphite as a function of lithium content.
Electrodes transition from black (unlithiated) to dark blue, red, and finally gold (fully lithi-ated).
5μm (c) 300 μm (b) laser zoom lens camera battery cell filter 50 mm laser beam expanding lens shutter (open position) (a)
Figure 2.4: Imaging setup of the custom battery cell during electrochemical
cycling. (a) A 532 nm laser excites the fluorescent particles on the electrode surface.
Reflected laser light is filtered so that only the fluorescent emitted light is captured in the images. A shutter blocks the laser light during the majority of the test and opens only when an image is being captured, to minimize particle bleaching. (b) Representative speckle pattern generated by fluorescent nano-particles on the surface of a graphite composite electrode. (c) Scanning electron micrograph of a composite graphite electrode. Carbon black visible on the electrode surface is false-colored in red. Fluorescent silica nano-particles on the electrode surface are false-colored in blue.
2.3
Analytical Prediction of Composite Electrode
Expansion
The elastic properties of a composite graphite electrode were estimated by treating the electrode as a graphite particulate-filled composite with a porous matrix of carbon black (CB) and carboxymethyl cellulose (CMC) polymer binder. The expansion of the composite electrode due to lithium intercalation into graphite was modeled analogously to a thermal expansion where lithium content is akin to a temperature change. Several assumptions were made to allow the problem to be analytically solvable:
The electrode is fully unconstrained.
The electrode undergoes only elastic, reversible deformation. The electrode is fully lithiated and delithiated.
The lithiation and delithiation are spatially uniform.
The graphite particles, though individually anisotropic, are oriented randomly within the electrode, causing the electrode to be isotropic at the length scales considered in the model.
No electrochemical reactions occur other than the lithiation and delithiation of graphite. The electrolyte is free to move through the pores of the electrode without exerting
significant forces on the electrode.
2.3.1
Material Properties of the Composite Constituents
As described in Chapter1, graphite undergoes a series of smooth phase transitions between discrete, ordered graphite-lithium intercalation compounds (G-LICs) during lithiation,
mov-stage II (LiC18), stage II (LiC12), and finally stage I (LiC6) intercalation compounds [4, 5].
Qi et al. used density functional theory (DFT) simulations to predict the average volume expansion, Young’s modulus and Poisson’s ratio for unintercalated graphite and stage III, dilute stage II, stage II, and stage I compounds [8]. For our model, the stage III phase of the LiC18 composition was used instead of the dilute stage II phase in order to correlate the
model with experimental results. Material properties of the intercalation compounds were linearly interpolated between the discrete phases in order to have material properties for all lithium contents.
The Young’s modulus, Poisson’s ratio, and density of the CB and CMC were found in the literature [8, 54–57]. The electrode porosity and volume fractions of each of the solid components were calculated from the overall density of the electrode (1.0 g cm−3), the densities of the individual components, and the mass ratio of the solid components (8:1:1 wt. ratio of graphite, CB, and CMC).
The bulk and shear moduli for all of the electrode components were calculated from the Young’s moduli and Poisson’s ratios assuming isotropy. Additionally, the linear strain from lithium intercalation of the graphite-lithium intercalation compounds was computed from the volumetric expansion assuming an isotropic expansion. All material properties are listed in Table 2.1.
Table 2.1: Material properties of the constituents of the graphite composite electrode
Young’s Poisson’s Bulk Shear Density Volumetric Linear Volume Ref.
Modulus Ratio Modulusa Modulusa Expansion Straina Fraction
(GPa) (–) (GPa) (GPa) (g cm−3) (%) (%) (–)
C (graphite) 32.47 0.315 29.25 12.35 2.2 0 0 0.36 [8, 57]
LiC18 (stage III) 28.57 0.39 43.26 10.23 – 3.6 1.2 – [8]
LiC12 (stage II) 58.06 0.34 60.48 21.66 – 4.6 1.5 – [8]
LiC6 (stage I) 108.67 0.24 69.66 43.82 – 10 3.2 – [8]
CMC 1.2 0.45 4.0 0.41 1.6 0 0 0.06 [54, 56]
CBb 32.47 0.315 29.25 12.35 1.9 0 0 0.06 [8, 55]
porosity – – – – – – – 0.52 –
a The bulk and shear moduli were calculated from the Young’s modulus and the Poisson’s ratio, and the linear strain was calculated from the volumetric expansion assuming isotropy.
b The Young’s modulus and Poisson’s ratio for carbon black are taken to be the same as unintercalated graphite.
2.3.2
Elastic Properties of the Composite Electrode
The lower bound of the effective shear moduli,Gm, and the lower bound of the effective bulk
moduli,Km, of a matrix containing CB particles and CMC binder were calculated using the
inverse rule of mixtures [58]:
(1/Km) = (φm,cb/Kcb) + (φm,cmc/Kcmc) (2.1a) (1/Gm) = (φm,cb/Gcb) + (φm,cmc/Gcmc) (2.1b) with φm,cb= φcb φcb+φcmc (2.2a) φm,cmc= φcmc φcb+φcmc (2.2b)
where Kcb and Kcmc were the bulk moduli of the CB and CMC respectively, Gcb and Gcmc
were the shear moduli of the CB and CMC respectively, φm,cb and φm,cmc were the volume
fractions within the CB/CMC matrix of the CB and the CMC respectively, andφcbandφcmc
were the volume fractions within the complete composite electrode of the CB and the CMC respectively.
Open cell theory for an isotropic porous solid [59] was adapted to compute the effective bulk modulus of a porous matrix,Kpm, with the previously defined CB and CMC matrix as
the solid part:
Kpm= 1 3 (1−2νpm) 9KmGm 3Km+Gm ρpm ρm 2 (2.3)
with ρm =φm,cbρcb+φm,cmcρcmc (2.4a) ρpm=φpm,cbρcb+φpm,cmcρcmc (2.4b) and φpm,cb= φcb φpm (2.5a) φpm,cmc = φcmc φpm (2.5b) φpm=φcb+φcmc+φp = 1−φg (2.5c)
where ρm was the density the solid portion of the CB/CMC matrix, ρpm was the density of
the porous matrix (CB, CMC, and porosity), φpm,cb and φpm,cmc were the volume fractions
within the CB/CMC porous matrix of CB and CMC respectively,φpwas the porosity within
the complete composite electrode, and φg and φpm were the volume fractions within the
complete composite electrode of, respectively, the graphite and porous matrix (i.e. CB, CMC and porosity). The Poisson’s ratio of the porous matrix,νpm, was assumed to be equal
to 1/3 [59].
The bulk modulus, Ke, of the complete composite electrode was computed by applying
the “S-Combining Rule” [58] for graphite particulates in a porous matrix according to:
Ke =
Kpm(1 +φgξlχ)
1−φgΨχ
with χ= Kg−Kpm Kg+ξlKpm (2.7a) Ψ = 1 + φgφpm(1−γφpm) (Kg−Kpm) (ξu−ξl) Kg +ξu(φgKg +φpmKpm) (2.7b) ξu = 2 (1−2νg)Kg (1 +νg)Kpm (2.7c) ξl= 2 (1−2νpm) (1 +νpm) (2.7d) γ = 2λ ∗−1 λ∗ (2.7e)
where νg was the Poisson’s ratio of the G-LICs and Kg was the bulk modulus of randomly
oriented particles of G-LICs, calculated from the Young’s modulus and Poisson’s ratio assum-ing isotropy and linearly interpolated between discrete phases. The critical volume fraction for random close packing of the particle filler, λ∗, was estimated as 2/3 [58].
2.3.3
Predicted Expansion of the Composite Electrode due to
Lithium Intercalation
The linear strain due to lithium intercalation of the complete composite electrode, e, was
estimated according to:
e =avg + pm−g 1/Kpm−1/Kg 1 Ke − 1 Kavg (2.8)
with avg =φgg+φpmpm (2.9a) 1 Kavg = φg Kg + φpm Kpm (2.9b)
where g was the linear strain of G-LICs due to lithium intercalation (calculated from the
volume expansion assuming isotropy (Table 2.1) and linearly interpolated between discrete phases), and where the rule of mixtures and inverse rule of mixtures were used to calculate the volume-fraction averages of the lithium-intercalation strain, avg, and the bulk modulus,
Kavg, of the composite electrode. Because the CB/CMC porous matrix does not lithiate,
its lithium-intercalation strain, pm, is zero. Equations (2.8) - (2.9) were adapted from the
thermal expansion of a two-part composite where both the composite and its constituents are isotropic [58, 60]. In our model, lithium content is akin to a temperature change. Dis-cussion of the model predictions and comparison of the predictions to experimental results is presented in Sec. 3.2.2.
2.4
Materials and Methods
2.4.1
Materials
Plastic portions of the custom battery cells were fabricated from polychlorotrifluoroethylene (PCTFE, Plastics International), and steel portions of the electrode substrates were fabri-cated from 316 stainless steel. A Torr-Seal equivalent epoxy was used to adhere electrodes to the substrates in the initial cell design. Armor Crystal o-rings (Valqua America) and a quartz window (99.995% SiO2, 1.6 mm thick, McMaster-Carr) was used to seal the cell.
The electrolyte consisted of 1M lithium perchlorate (LiClO4, battery grade, dry, 99.99 %,
Sigma-Aldrich) dissolved in ethylene carbonate (EC, anhydrous, 99 %, Sigma-Aldrich) and dimethyl carbonate (DMC, anhydrous, >99 %, Sigma-Aldrich) in a 1:3 vol. ratio. Vinylene carbonate (VC, 99 %, Sigma-Aldrich) was added in various weight percents to some elec-trolyte as an elecelec-trolyte additive. Lithium metal (0.75 mm thick, Alfa Aesar) was used as a counter electrode.
Composite graphite electrodes were fabricated from synthetic graphite powder (<20µm, Sigma-Aldrich), carbon black (CB, 100 % compressed, 99.9+ % pure, Alfa-Aesar), and sodium carboxymethyl cellulose binder (CMC, average Mw ∼700,000, degree of substitution
0.8 - 0.95, Sigma-Aldrich). Composite silicon electrodes were fabricated from either micro-Si (325 mesh, 99 %, Sigma-Aldrich) or nano-Si (100 nm, plasma synthesized, 99 %, MTI), CB (Regal 400R, Cabot) and CMC. Electrodes were fabricated on a substrate of copper foil (9µm thick, > 99.99 %, MTI).
The synthesis of fluorescent silica nano-particles required the following reagents: 3-aminopropyltriethoxysilane (APS, 99+ %, Gelest), tetraethoxysilane (TEOS, 99.9+%, Gelest), rhodamine B isothiocyanate dye (RITC, mixed isomers, Sigma-Aldrich), ammonium hydrox-ide (30 wt.%, Fisher), and ethanol (200 proof, Decan labs).
2.4.2
Fluorescent Particle Synthesis
Fluorescent nano-particles were synthesized in house according to [52, 53]. A generalized synthesis procedure is presented in AppendixH, while the specific procedure utilized in this work is presented here. First, 10 mL ethanol, 0.0462 g RITC dye, and 0.0368 g APS were added to the reaction vessel. The vessel was purged with nitrogen, and the contents were mixed with a magnetic stir rod for approximately 24 hours. Next, 170 mL ethanol, 16.67 mL ammonium hydroxide, and 3.3 mL deionized water were added to the reaction vessel and allowed to mix for several minutes. Then, 11.1 mL TEOS was added quickly. The reaction vessel was again purged with nitrogen, and the contents were stirred rapidly for
a few minutes, and then mixed at a slower rate for approximately 24 hours. These steps created the particle cores containing RITC dye. Amounts of reagents were chosen to yield cores of 400 nm in diameter.
After the cores were formed, a protective shell of silica was grown around the cores in four discrete steps. For each step, deionized water was added to the reaction vessel first, and then TEOS was added quickly. The vessel was purged with nitrogen, and the contents were stirred for approximately two hours before the next addition of materials. Equal amounts of water and TEOS were added in the following increments: 1 mL, 10 mL, 17 mL, 17 mL. The total amount of TEOS (45 mL) was chosen such that the final particle diameter would be 700 nm, assuming a core diameter of 400 nm.
Once the particles were fully formed, the contents of the reaction vessel were centrifuged, and the excess reaction liquid was removed. The remaining particles were dispersed in fresh ethanol via sonication. This rinsing procedure was repeated three times, and then the particles were stored in ethanol at approximately -20◦ C. The final diameter of the particles, as measured from a scanning electron micrograph, was 550 - 620 nm.
In order to generate a speckle pattern for DIC, the particles were sonicated in ethanol immediately before use, and then spincoated at approximately 1000 RPM onto the surface of the electrode prior to battery cell assembly.
2.4.3
Composite Graphite Electrode Fabrication
Graphite electrode slurries were prepared by mixing graphite, carbon black and CMC in water. First, CMC was dissolved in water in a 1:100 wt. ratio. Then, carbon black and graphite were added using one of two protocols. In the first protocol, carbon black was added to the CMC solution, and the carbon black/CMC/water suspension was mixed for several days with a magnetic stir rod in order to fully disperse the carbon black. Then graphite was added and the slurry was mixed with a magnetic stir rod for several more days in order to
added to the CMC solution at the same time, and the slurry was mixed with a homogenizer (Model 15007ST, 7 mm, sawtooth (fine), stainless steel probe, Omni) at approximately 7,500 RPM for 1 hour. The two different mixing protocols had no noticeable influence on the electrochemical behavior or the strain responses of the electrodes. In both protocols, slurries were made in ca. 5 g quantities, and the weight ratio of solid components ranged from 9:0:1 to 0:9:1 for graphite, carbon black, and CMC respectively.
A substrate of copper foil was cleaned with acetone and ethanol. The electrode slurry was deposited onto the copper foil using a doctor blade to control the slurry thickness and then allowed to dry under ambient conditions. The measured density of the electrodes was ca. 1.0 g cm-3, and the porosity was ca. 50 % by volume, as calculated from the overall
electrode density, the density of individual electrode components, and the mass ratio of individual electrode components.
Electrodes on a copper current collector for use in the initial cell were prepared by punching pieces 19 mm in diameter from the electrode sheet. Excluding the mass of the copper current collector, electrodes were approximately 8.9 mg, indicating 7.1 mg of graphite for electrodes with a composition of 8:1:1 wt. ratio of graphite, carbon black, and CMC. The electrode on a current collector was adhered to its substrate by a thin layer of epoxy -either 18 mm or 5 mm in diameter - that was allowed to cure under ambient conditions for 24 hours before the electrode was assembled into the custom battery cell.
In order to prepare electrodes for use in the second cell design, the composite electrode was carefully peeled off of the copper foil, creating a free-standing electrode, 90 - 100 µm thick, with no current collector. The free-standing electrode was cut using a razor blade into pieces approximately 3 x 5 mm or 3 x 7 mm. Electrodes typically massed 1.5 - 2.5 mg total, indicating to 1.2 - 2 mg of graphite for electrodes with a composition of 8:1:1 wt. ratio of graphite, carbon black, and CMC. The electrode was spot welded to its substrate at 120 V through a piece of stainless steel foil.
2.4.4
Custom Cell Assembly
The working electrode (composite graphite electrode or composite silicon electrode) on its substrate was assembled into the custom battery cell, and the cell was transferred to a glovebox with an argon atmosphere with O2 and H2O levels both under 10 ppm. A piece of
lithium metal (counter electrode) was pressed onto stainless steel pins on its substrate. The cavity of the main body of the cell was filled with approximately 5 mL electrolyte, and the cell was sealed with a quartz window and an o-ring. The sealed cell was then brought into atmospheric conditions for testing. In order to prevent accumulation of gas on the working electrode surface from electrolyte decomposition during the formation of the solid electrolyte interphase (SEI) layer [32], the cell was oriented vertically during cycling.
2.4.5
Electrochemical Cycling
Within approximately 30 minutes of battery cell assembly, the cell was placed in the ex-perimental setup and allowed to rest at open circuit voltage (OCV) for five hours while images were captured of the fluorescent particles on the electrode surface. This five-hour rest period allowed the cell to reach mechanical equilibrium. The reference point for all strain measurements was taken after this rest period, just prior to cycling.
The specific capacity of the battery, Q, is a measure of the total charge passed between the two electrodes during the charge or discharge cycle normalized by the mass of the active material, m, and is defined as:
Q= 1
m
Z tf to
I(τ)dτ (2.10)
where I is the current and t is the time of charge or discharge. Ideally, the capacity is a measure of the number of lithium ions that are transferred to and from the graphite working electrode, but it can also include side reactions such as electrolyte decomposition. All capacities reported were normalized by the mass of the active material in the working
Galvanostatic Cycling
Galvanostatic cycling tests were performed between 2.00 V and 0.01 V vs Li+/0 on an Arbin
potentiostat/galvanostat at various C-rates. C-rates reported were calculated using the theoretical capacity of the active material, Qi, and the mass of the active material in the
working electrode, mi:
C-rate = Qimi
I , (2.11)
where I was the current used in the constant current portion of cycling. The theoretical capacity of graphite (Qg = 372 mA h g-1 [61]) was used for graphite composite electrodes,
and the theoretical capacity of silicon (Qsi = 4200 mA h g-1 [62, 63]) was used for silicon
composite electrodes.
In this work, discharge of the half cell (i.e. lithium ions moving from the lithium metal counter electrode to the working electrode) is referred to as “lithiation,” and charge of the half cell (i.e. lithium ions moving from the working electrode to the lithium metal counter electrode) is referred to as “delithiation.” Images of the fluorescent particles were captured every 10 minutes. Therefore, each constant current charge / discharge was followed by a constant current voltage hold of 11 minutes in order to capture an image at the end of each lithiation and delithiation step. Following the constant voltage step, the cell rested for 10 seconds (no applied current or voltage) to allow the potentiostat / galvanostat to switch smoothly to the next step.
Potentiostatic Test
To explore the effect of electrolyte decomposition on electrode deformation, we designed a test in which electrolyte reduction was the dominating electrochemical reaction. Electrodes with a composition of 8:1 wt. ratio of graphite and polymer binder (no carbon black) were held potentiostatically at a voltage of 0.5 V vs Li+/0 for a certain amount of time while the
current and strain responses were monitored. The voltage of 0.5 V vs Li+/0 was below the
threshold for reduction of electrolyte species (ca. 0.8 V vs Li+/0[33]), but above the threshold
for lithium intercalation into graphite (ca. 0.3 V vs Li+/0 [4]). Electrodes were fabricated
without carbon black to avoid any contribution to the capacity from lithium intercalation into carbon black, which occurs at voltages lower than ca. 1.5 V vs Li+/0 [4]. Therefore, all
capacity gained during this voltage hold was directly associated with irreversible electrolyte reduction.
Cyclic Voltammetry
For the data presented in Chapter 5, cyclic voltammetry (CV) was performed at scan rates of 10 µV s-1 (1.00 - 0.01 V vs Li+/0), 25 µV s-1 (1.00 - 0.01 V vs Li+/0), and 100 µV s-1
(1.50 - 0.01 V vs Li+/0) for three cycles. The first half of the cycle is denoted as the cathodic scan, when the working electrode potential was swept from higher voltages to lower voltages; negative current indicates lithiation of the working electrode. The second half of the scan is denoted as the anodic scan, when the working electrode potential was swept from lower voltages back to higher voltages; positive current indicates delithiation of the working electrode.
For the data presented in AppendixC, linear sweep voltammetry was performed between the open circuit voltage (OCV) of the electrode (ca. 2 - 3 V vs Li+/0) and 0.3 V vs Li+/0. The electrode potential was swept at 25µV s-1. Similar to the potentiostatic test, electrodes were fabricated without carbon black (8:1 wt. ratio of graphite and CMC binder) so that elec-trolyte decomposition was the dominating electrochemical reaction occuring in the voltage range investigated. Before cycling, the cell was allowed to rest for 24 hours. This extended rest period was required to ensure a more stable mechanical equilibrium than the standard five hour rest period, since the strains developed during this test were much smaller than strains developed in standard galvanostatic cycling tests.
2.4.6
Imaging Parameters
To excite the fluorescent nano-particles on the surface of the electrode, a 532 nm, 75 mW laser beam (Crystalaser) was expanded and directed onto the electrode at an angle of ca. 20◦, creating an elliptical spot size of approximately 4 x 5 mm. Experiments were carried out under a blackout blanket to prevent ambient light effects and to minimize influence of tem-perature fluctuations of the ambient lab environment. Images were captured using either Retiga camera (Q-Imaging) or an Aqua camera (Q-Imaging) and a 12X zoom lens (Navitar), for an effective scale of ca. 2.4µm pixel−1. A 620 nm filter was placed directly in front of the zoom lens to filter reflected laser light so that only emitted fluorescent light was captured in the images. Image exposure of 2 - 5 sec (with the Retiga camera) or 0.2 - 0.5 sec (with the Aqua camera) was used, and images were captured every 5 - 10 minutes. To prevent bleaching of the particles, the laser was shuttered during the majority of the test, and only unshuttered during image capture.
Fig. 2.2c shows an image of the working electrode spot welded to its substrate in the second custom battery cell. The region captured in the images, outlined by the yellow rectangle, was 3 x 2.5 mm. At this length scale, the composite response was considered a homogeneous average of the individual particle responses. Fig. 2.4 shows the experimental configuration of the camera, zoom lens, laser, and custom battery cell during electrochemical cycling as well as a representative speckle pattern created by the fluorescent nano-particles on the electrode surface.
2.4.7
Digital Image Correlation
The Matlab-based DIC code used in this work was adapted from open-source code by Eberl et al. [64], and a complete, working copy is available online [65]. A full description of the code, including an example correlation, is included in AppendixF, and the accuracy and precision of the code is evaluated in Appendix G. In this work, the images were processed through a
low-pass filter of radius 3 pixels (7.2µm) in order to remove aliasing effects before the images were correlated; the filter was generated using the built-in Matlab function fspecial and the images were filtered using the built-in Matlab function imfilter. A grid of ca. 90 by 120 control points with horizontal and vertical spacing of 10 pixels (24.4 µm) and a subset size of ca. 21 x 21 pixels (ca. 50 x 50 µm) were used during the image correlation. A smoothing kernel of 11 x 11 control points (260 x 260µm) was used, and displacements were smoothed three times before strains were calculated.
2.5
Conclusions
A system was developed to quantify the strain in lithium-ion battery electrodes during electrochemical cycling. Two custom battery cells were designed, one that allowed strain measurements of electrodes fabricated on a current collector and one that allowed strain measurements of free-standing, unconstrained electrodes. A speckle pattern for digital image correlation was generated using fluorescent silica nano-particles, and in-house DIC code was used to correlate images captured in situ and calculate strains. Finally, a model based on porous composite theory was developed to predict the expansion of unconstrained composite electrodes based on known expansion of the active material particles.
Chapter 3
Deformation of Graphite Electrodes
*
In this chapter, the deformation of graphite composite electrodes resulting from electro-chemical cycling is discussed. Strain was measured in both electrodes adhered to a current collector and in free-standing, unconstrained electrodes. Two principle deformation mech-anisms were identified. Reversible macroscale deformation of the composite electrode was traced to changes in the graphite layer spacing at the atomic scale as different graphite-lithium intercalation compounds were formed. Irreversible deformation was correlated with the formation and growth of the solid-electrolyte interphase (SEI) layer. The expansion of free-standing electrodes agrees well with an analytical model.
3.1
Representative Electrode Response
3.1.1
Electrochemical Response
Figure 3.1 shows the representative electrochemical data for three cycles of a free-standing composite graphite working electrode cycled galvanostatically at C/20 rate in the second custom battery cell (Fig. 2.2). Fig. 3.1a shows the full voltage axis, and Fig. 3.1b expands the voltage axis for clarity. The red circle represents the open circuit voltage (OCV) of the cell before cycling. As lithium ions moved from the lithium metal counter electrode to the graphite working electrode, the voltage decreased and the capacity increased (black lithiation curve). When lithium ions moved in the reverse direction, the voltage increased
*Significant portions of this chapter were published in E. M. C. Jones, M. N. Silberstein, S. R. White, N. R. Sottos. Exp. Mech. (2014) 54:971-985
Specific Capacity, Q (mA h g-1) 0 100 200 300 400 500 Voltage, V (V vs Li +/0 ) 0.0 0.05 0.10 0.15 0.20 0.25 0.30
Specific Capacity, Q (mA h g-1)
0 100 200 300 400 500 Voltage, V (V vs Li +/0 ) 0.0 0.5 1.0 1.5 2.0 2.5 Lithiation Delithiation irreversible capacity (a) 1 3 2 (b)
Figure 3.1: Representative electrochemical response of a graphite composite
electrode. The electrode had a composition of 8:1:1 wt. ratio of graphite, carbon black
and CMC binder and was cycled galvanostatically at C/20 rate for three cycles in the second custom battery cell (Fig. 2.2). The capacity is normalized with respect to the mass of graphite in the working electrode. The red circle represents the open circuit voltage (OCV) at the start of cycling. (a) Full voltage axis and (b) expanded voltage axis.
and the capacity decreased (blue delithiation curve). Electrodes cycled in the initial cell (Fig. 2.1) and electrodes cycled without fluorescent nano-particles in a flooded beaker cell had qualitatively and quantitatively similar electrochemical performance.
The lithiation portion of the first cycle showed an artificially high capacity due to irre-versible chemical reactions that occurred during the formation of the solid electrolyte inter-phase (SEI) layer [32], resulting in 167 mA h g-1 of irreversible capacity. The inefficiency of the cell (i.e. the difference between the lithiation capacity and delithiation capacity) in-dicated continued electrolyte decomposition on cycles two and three, though to a smaller extent than the main decomposition on the first cycle. The irreversible capacity is dis-cussed in more detail in Sec. 3.3. The cell achieved a reversible capacity of approximately 360 mA h g-1, which was close to the theoretical capacity of graphite (372 mA h g-1 [61]),
3.1.2
Strain Response of Constrained Electrodes
Figure 3.2 contains line scans of the strain that developed at the end of the first lithiation of the constrained electrode cycled in the initial custom battery cell (Fig.2.1) using the first attachment configuration (Fig. 2.1c). The line scans were taken along a vertical line (red dashed line) in the center of the region of interest (yellow rectangle), marked in the inset of Fig.3.2. The horizontal normal strain, Exx, and the shear strain,Exy, were both small over
the entire region of interest. The vertical normal strain, Eyy, was concentrated in a ring less
than 1 mm wide at the edge of the electrode, with negligible strain developed in the center of the electrode. It is hypothesized that the epoxy adhesive layer effectively constrained the majority of the electrode, and that significant strain developed only in the edge of the electrode that is not constrained by the epoxy.
When the constraint was relaxed and the electrode was attached to its substrate using the second attachment configuration (Fig. 2.1d), the electrode curled and uncurled repeatedly during lithiation and delithiation, preventing strain measurements. The curling behavior of
Y (mm) 0 0.5 1 1.5 2 Strain (%) 0 0.5 1 1.5 2 2.5 E xx E yy E xy
Figure 3.2: Spatial variation of the strain of a constrained graphite composite
electrode at the end of the first lithiation. The electrode had a composition of 8:1:1 wt.
ratio of graphite, carbon black and CMC binder and was cycled in the initial cell (Fig. 2.1), attached to its substrate via a nearly complete layer of epoxy. The line scans were taken along a vertical line (red dashed line) in the center of the region of interest (yellow rectangle).
the bi-layer electrode / current collector system arose as the graphite electrode expanded and contracted while the copper current collector attempted to retain its size. It was analogous to the curvature change that occurs during a temperature change in a bi-layer system made of materials with different coefficients of thermal expansion, e.g. a bi-metallic thermostat.
3.1.3
Strain Response of Unconstrained Electrodes
During the drying step of the electrode fabrication process (Sec. 2.4.3), the electrode devel-oped a slight concave curvature, which was indicative of the development of residual tensile stress in the electrode [66]. During the five-hour rest step that was performed before every cycling test (Sec. 2.4.5), a negative strain of approximately -0.1 % developed in both of the normal directions, Exx and Eyy, while the shear strain, Exy, was zero (Fig. 3.3), indicating
that the free-standing electrode underwent a volumetric contraction. We hypothesize that during the five-hour rest period, the polymer binder became more compliant (e.g. due to swelling of the binder in electrolyte or heating of the binder by the laser used during imag-ing) and contracted to relieve the residual tensile stress. The reference point for all strain
Time (hr) 0 1 2 3 4 5 Strain, E (%) -0.12 -0.10 -0.08 -0.06 -0.04 -0.02 0.00 E xy E xx E yy
Figure 3.3: Strain evolution of a graphite composite electrode during a five-hour
rest period before cycling. The electrode had a composition of 8:1:1 wt. ratio of graphite,
carbon black, and CMC binder, and the rest period started less than 30 minutes after the battery cell was assembled.
measurements was taken after this rest period, just prior to cycling. After the electrode reached mechanical equilibrium during the rest period, we believe temperature rise during cycling was negligible because of the small electrode mass (ca. 1.5 - 2.0 mg active material), slow cycling rates (C/5 or slower), large volume of electrolyte that acted as a heat sink (ca. 5 mL) and black-out blanket that minimized influence of temperature fluctuations of the ambient lab environment.
Figure 3.4 contains contour plots and line scans of the strain components of the free-standing graphite electrode at the end of the first lithiation in the second custom battery cell (Fig.2.2). The line scans were taken along a vertical line (red dashed line) in the center of the region of interest (yellow rectangle), marked in the inset of Fig.3.4d. The horizontal normal strain, Exx, was spatially uniform, while the vertical normal strain, Eyy, was larger
towards the unconstrained side of the electrode (right) and smaller towards the side that was spot welded to the substrate (left). The two normal strains were of the same order of magnitude, and the shear strain,Exy, was negligible, as expected for an isotropic volumetric
expansion.
The state of strain of the electrode is given by the rotationally invariant equivalent strain:
Eeqv = 3 2 EijEij − 1 3EmmEnn 1/2 (3.1)
where Eij are the components of the two-dimensional finite-strain tensor and repeated
in-dices imply summation. For each image captured during cycling, the equivalent strain was averaged over a vertical line in the middle of the region of interest. The portion of the electrode in the middle of the region of interest was sufficiently far from the constraint of the spot welds to undergo nearly free expansion, yet was close enough to the support of the substrate that it did not undergo significant out-of-plane motion due to electrode bending. Averaging the equivalent strain over a vertical line farthest from the spot weld constraint (right edge of the region of interest) increased the strain by less than 0.1 % strain while
(a) (b) (d) (c) Exx Eyy Eeqv x y
Figure 3.4: Spatial variation of the strain of an unconstrained graphite composite
electrode at the end of the first lithiation. The electrode was cycled in the second
battery cell (Fig 2.2). The line scans are taken along a vertical line (red dashed line) in the center of the region of interest (yellow rectangle), marked in the inset of (d). This strain data corresponds to the electrochemical data presented in Fig. 3.1.
Specific Capacity, Q (mA h g-1) 0 100 200 300 400 500 Equivalent Strain, E eqv (%) 0.0 0.5 1.0 1.5 2.0 Lithiation Dellithiation 3 2 1 non-recoverable deformation
Figure 3.5: Representative strain response of a free-standing graphite composite
electrode during galvanostatic cycling. The electrode was cycled in the second custom
battery cell (Fig.2.2). The equivalent strain was averaged along a vertical line in the center of the region of interest (red dashed line in the inset of Fig.3.4d). The capacity is normalized with respect to the mass of graphite and carbon black in the working electrode. The red circle represents the start of cycling. This strain data corresponds to the electrochemical data presented in Fig. 3.1.
averaging over a vertical line closest to the spot weld constraint (left edge of the region of interest) decreased the strain by less than 0.2 % strain.
The average equivalent strain is plotted in Fig.3.5 as a function of the working electrode capacity. The start of the test is represented by the red circle, at zero strain and zero capacity. As the electrode was lithiated and the capacity increased (black curves), the strain increased an average of 1.23 % per cycle (averaged over cycles 2-3). When the electrode was subsequently delithiated (blue curves), the strain decreased an average of 1.06 % per cycle (averaged over cycles 2-3). The expansion and contraction of the graphite electrode was not completely reversible. During the first cycle in particular, the electrode expanded during lithiation more than it contracted during delithiation, resulting in 0.56 % strain that was not recovered. The cumulative non-recoverable deformation increased with additional cycles.