Type: Research Paper / Tipo: Artículo de Investigación
Special Section: VII Workshop on Lidar Measurement in Latin-America / Sección Especial: VII Taller de Medidas Lidar en Latino-América
The first ALINE measurements and intercomparison exercise on lidar
inversion algorithms
Primeras mediciones simultáneas dentro de ALINE y ejercicio de
inter-comparación de los algoritmos de inversión de señal lidar
H. M. J. Barbosa
(1,*), F. J. S. Lopes
(2,3), A. Silva
(4,5), D. Nisperuza
(6), B. Barja
(7), P. Ristori
(8),
D. A. Gouveia
(1), C. Jimenez
(4,5), E. Montilla
(4,5), G. L. Mariano
(9), E. Landulfo
(3),
A. Bastidas
(6), E. J. Quel
(8)1. Instituto de Física, Universidade de São Paulo, São Paulo, Brasil.
2. Instituto de Astronomia, Geofísica e Ciências Atmosféricas, Universidade de São Paulo, Brasil. 3. Instituto de Pesquisas Energéticas e Nucleares, Universidade de São Paulo, Brasil.
4. Center for Optics and Photonics (CEFOP), Universidad de Concepción, Chile. 5. Departamento de Física, Universidad de Concepción, Chile.
6. Grupo Láseres y Espectroscopía Óptica, Escuela de Física, Universidad Nacional de Colombia, Sede Medellín, Colombia
7. Grupo de Óptica Atmosférica de Camagüey, Instituto Meteorológico de Cuba, Cuba. 8. Division Lidar, CEILAP-UNIDEF, Villa Martelli, Argentina.
9. Faculdade de Meteorologia, Universidade Federal de Pelotas, Brasil. (*) Email: [email protected]
Received / Recibido: 15/02/2014. Revised / Revisado: 25/05/2014. Accepted / Aceptado: 26/05/2014. DOI: http://dx.doi.org/10.7149/OPA.47.2.99
ABSTRACT:
The first coordinated effort to perform simultaneous lidar measurements in Latin America was carried out as a pilot campaign between 10 and 14 September 2012. Four lidar stations contributed to the campaign measurements: Manaus, São Paulo, Concepción and Buenos Aires. Data from all four contributing stations were manually screened and a 1-h average cloud-free profile was selected from each one. These four elastic profiles were analyzed by four of the groups using their own elastic lidar algorithm. Here, the results for the particle backscatter coefficient are compared and discussed. We show that after five stages, the results have an agreement better than the typical uncertainty in the retrieval. Systematic errors found in different algorithms during the five stages of the exercise emphasize the need for analysis, measurements and data quality protocols. Difficulties involved in the coordination of the campaign and in the collaborative analysis are also highlighted.
Key words: ALINE; First Campaign; Intercomparison.
RESUMEN:
El primer esfuerzo combinado para realizar mediciones lidar simultáneas en latinoamerica resultó en la campaña piloto de mediciones desde el 10 al 14 de septiembre de 2012. Cuatro estaciones lidar contribuyeron a la campaña de mediciones: Manaus, São Paulo, Concepción y Buenos Aires. Los datos de retrodipersión elástica de la atmósfera de todas las estaciones fueron manualmente discriminados y fue seleccionado un perfil promedio de una hora, sin presencia de nubes para cada estación. Esos cuatros perfiles fueron analizados por cuatro grupos de investigación empleando sus propios algoritmos de inversión elástica. En el presente trabajo fueron comparados y discutidos los resultados de los perfiles de coeficiente de retrodispersión por partículas obtenidos del procesamiento con los diferentes algoritmos. Se muestra que después de cuatro tentativas de procesamiento, ajustando los diferentes algoritmos, los resultados tienen diferencias menores que la incertidumbre típica del método de cálculo. Errores sistemáticos fueron encontrados en los
diferentes algoritmos durante las cuatro fases del ejercicio. De estamanera se enfatiza en la necesidad de establecer protocolos de análisis, medición y de calidad de los datos. También se destacan las dificultades presentadas en la coordinación de la campaña, así como en el análisis conjunto.
Palabras clave: ALINE; Primera Campaña; Comparación, Lidar.
REFERENCES AND LINKS / REFERENCIAS Y ENLACES
[1]. C. Böckmann, U. Wandinger, A. Ansmann, J. Bösenberg, V. Amiridis, A. Boselli, A. Delaval, F. De Tomasi, M. Frioud, I. V. Grigorov, A. Hågård, M. Horvat, M. Iarlori, L. Komguem, S. Kreipl, G. Larchevêque, V. Matthias, A. Papayannis, G. Pappalardo, F. Rocadenbosch, J. A. Rodrigues, J. Schneider, V. Shcherbakov, M. Wiegner, “Aerosol Lidar Intercomparison in the framework of the EARLINET project. 2. Aerosol backscatter algorithms”, Appl. Opt.43, 977–989 (2004). DOI
[2]. K. M. Longo, S. R. Freitas, M. Pirre, V. Marécal, L. F. Rodrigues, J. Panetta, M. F. Alonso, N. E. Rosário, D. S. Moreira, M. S. Gácita, J. Arteta, R. Fonseca, R. Stockler, D. M. Katsurayama, A. Fazenda, M. Bela, “The chemistry CATT-BRAMS model (CCATT-BRAMS 4.5): A regional atmospheric model system for integrated air quality and weather forecasting and research”, Geosci. Model Dev. Discuss. 6, 1173– 1222 (2013). DOI
[3]. L. Otero, P. Ristori, E. Pawelko, J. Pallotta, E. Quel, “Six-year evolution of multiwavelength lidar system at CEILAP”, Opt. Pura Apl.44, 13-18 (2011).
[4]. A. Silva, E. Montilla-Rosero, C. Jiménez, C. Saavedra, R. Hernández, “Tropospheric measurements of aerosol optical properties at Concepción (36ºS,73ºW)”, Proc. 26th International Laser Radar
Conference (26th ILRC), Vol I, 521-524, Porto Heli, Greece (2012).
[5]. H. M. J. Barbosa, B. Barja, D. A. Gouveia, T. Pauliquevis, A. Braga, P. Artaxo, G. Cirino, R. Santos, “A permanent Raman lidar station in the Amazon: Description, characterization and first results”,
Atmos. Meas. Tech. Discuss.7, 769-817 (2014). DOI
[6]. E. Landulfo, C. A. Matos, A. S. Torres, P. Sawamura, S. T. Uehara, “Air quality assessment using a multi-instrument approach and air quality indexing in an urban area”, Atmos. Res.85, 98-111 (2007). DOI [7]. F. G. Fernald, “Analysis of atmospheric lidar observations: some comments”, Appl. Opt.23, 652–653
(1984). DOI
[8]. J. D. Klett, “Lidar inversion with variable backscatter/extinction ratios”, Appl. Opt.24, 1638–1643 (1985). DOI
[9]. J. D. Klett, “Stable analytical inversion solution for processing lidar returns”, Appl. Opt.20, 211–220 (1981). DOI
1.
Introduction
The Latin America Lidar Network (ALINE) is a coordinated lidar network for measuring aerosol backscatter and extinction coefficient profiles, as well as other atmospheric species such as ozone and water vapor. During the VI Workshop on Lidar Measurements in Latin America, in La Paz in 2011, more engagement in collaborative activities was identified as key for further development of the lidar community in the region and a measurement campaign was suggested as a starting point. This idea, however, remained dormant until the ALINE meeting during the 26th International Laser Radar Conference in Greece in 2012. There, the network members agreed on conducting a pilot
campaign, between September 10th and 14th 2012, during the South American biomass burning season. This became the first coordinated effort to perform simultaneous lidar measurements in Latin America.
Latter that year, ALINE was officially recognized by the World Meteorological Organization (WMO) and became a contributing network to the Global Atmospheric Watch (GAW) program. The main goal of ALINE, stated in its letter of agreement with WMO, is to establish a consistent and statistically sound database for enhancement of the understanding of the aerosol distribution over the continent and its direct and indirect influence on climate.
There are five groups of lidar scientists operating aerosol lidar systems at the eight stations participating in ALINE (further details at www.lalinet.org). Since January 2013, each group has been performing lidar measurements twice a week, following protocols based on those initially defined for the pilot campaign. Protocols for data quality assurance and instrument intercomparison are of utmost importance in the establishment of a joint dataset and collaborative studies and are currently being discussed. The comparison of the algorithms used by different groups to invert the lidar signal and retrieve the profile of aerosol optical properties is also very important, as shown by studies conducted by other lidar networks [1].
This manuscript presents the first comparison of the elastic retrieval of the aerosol backscatter coefficient by different lidar groups in South America, an exercise based on data collected during our 2012 pilot campaign. In section 2 we describe the lidar stations that participated in the pilot campaign and how data was selected for the retrieval exercise. In section 3 we discuss the results from the intercomparison and conclusions are presented in section 4.
2.
Methodology
2.1. The pilot campaign
The pilot measurement campaign was conducted during the Amazon biomass burning season, between September 10th and 14th 2012.
Measurements were taken between 8 am to 8 pm local time during clear sky conditions. Integration time was defined to be 1-minute or less and unprocessed raw data was to be shared through the ALINE ftp site (ftp.lalinet.org) in either ascii or binary format. The group from the Meteorology Department of the Federal University of Pelotas, in Brazil, was in charge of the air quality forecast daily bulletins, that included a synoptic analysis integrated with aerosol optical depth from MODIS for the previous day and 24 h forecasts of biomass burning transport from CATT-BRAMS model ran at INPE [2]. Coordination of the proposed simultaneous measurements were extremely difficulty, particularly because seven of the eight lidar stations depended not only on fair weather but also on a local operator for the measurement routine. For this reason, only four of the eight ALINE station were able to do measurements during the proposed period (see Table I).
Before the campaign started, analysis tasks were also defined for the different research groups. These involved calculating back trajectories from HYSPLIT; retrieving of AOD from MODIS; looking at CALIPSO overpasses for each station; analyzing the boundary layer development; and obtaining temperature and relative humidity profiles from COSMIC network. Finally, collaborative analysis of all the dataset was to be performed by all groups. This, however, proved to be even more challenging than organizing the campaign itself. For instance, data sharing took four months to be completed,
TABLE I
Description of lidar stations measuring during the pilot campaign, including geographical location, detected wavelengths and resolution. Details for data shared after the campaign include channel and detection mode (an: analog or pc: photoncount), number of profiles (#) and total size. Last column indicates during which days of September 2012 each station was able to perform measurements.
Name and location detected (nm) Wavelength Resolution Shared channels Shared files and sizes measurements Days with Manaus (Ma) 2.891ºS, 59.97ºW 100 m asl 355, 387, 408 7.5 m, 60-sec 355 an/pc 387 an/pc 408 pc #4555 1.39 Gb 10,11,12,13,14 São Paulo (Sp) 23.46ºS, 46.23ºW 740 m asl 355, 387, 408, 532, 607, 660 7.5 m, 200-sec 532 an/pc 607 pc 929 Mb #2872 10,12,14
Buenos Aires (Ba) 36.84ºS, 58.51ºW 20 m asl 355, 387, 408, 532, 607, 1064 7.5 m, 10-sec 355 an 532 an 1064 an #14727 1.35 Gb 11,12,13,14 Concepción (Cp) 36.84ºS, 73.02ºW
170 m asl 532 7.5 m, 60-sec 532 an/pc
#2128
particularly due to reduced manpower available in most groups. Moreover, most of the analysis tasks proposed above are still on hold as the efforts were focused firstly on the intercomparison of inversion algorithms, which is discussed in this manuscript.
2.2. Contributing lidar stations
Each system participating in ALINE was tailored built to attend the needs of each research group and thus the network is quite heterogeneous. Features common to all systems are the Nd:Yag lasers and LICEL data acquisition modules. Location and brief details on the detected wavelengths are given in Table I for those stations able to take measurements during the campaign. The station in Argentina was the only
to detect the three wavelengths, but it recorded the signal only in analog mode, while for other to detect the three wavelengths, but it recorded the signal only in analog mode, while for other stations the signal was recorded simultaneously in both detection modes. Except for Concepción, all stations had at least one inelastic Raman backscattering channel from nitrogen molecules, thus allowing obtaining quantitative aerosol extinction profiles, and at least one channel for water vapor. For the analysis presented in this paper, however, only the analog elastic channel was used. Further details on each instrument can be found in [3-6].
2.3. Data selection
Data from all four contributing stations were
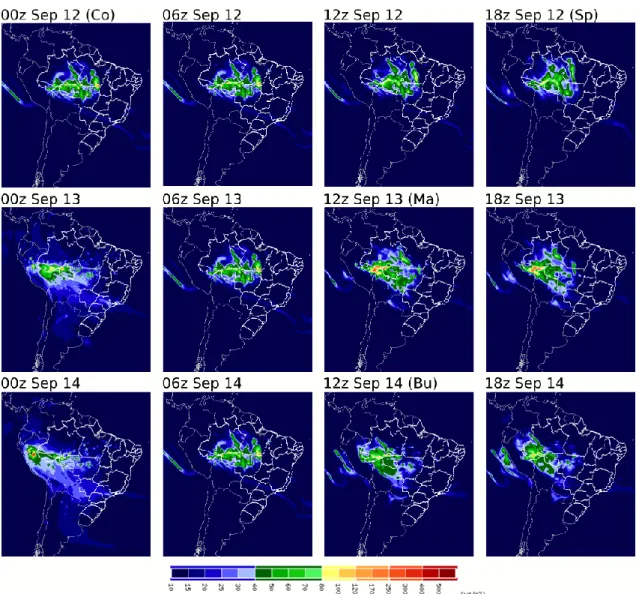
Fig. 1. Aerosol concentration (PM2.5, gm-3) at 3000 m from CATT-BRAMS model weather forecasts are shown from 0Z September 12th to 18Z September 14th 2012. The image closer to the time selected for each station is indicated.
manually screened for determining cloud-free periods. The weather bulletins, MODIS images and air quality forecasts from CATT-BRAMS model were used access the likelihood of having long-range transported aerosols over each site during these cloud-free periods. This integrated analysis, for instance, identified a stationary front at approximately 30ºS on September 11th
and the air quality model indicated advection of the smoke plume from the central region of South America towards the South of Brazil due to the predominant circulation northern of the front. Results from the model forecasts, shown in Fig. 1, showed that the plume of biomass burning aerosols passed over São Paulo between September 12th and 14th. As the last two days of the campaign were very cloudy in the region, the period from 1-2 pm local time (UTC-3) on September 12th was selected in this case.
The analysis is summarized in Table II. For Buenos Aires, there was maximum probability on September 14th, and the period from 10-11 am local time (UTC-3) was selected. Manaus was close to most fire emissions and on September 13th the CATT-BRAMS model forecasted PM2.5 levels of about 40-80 gm-3. The selected period
was 7-8 am local time (UTC-4). Concepción was not influenced by air masses coming from the biomass burning regions, but rather by regional transport below 3 km. The period from 7-8 pm local time (UTC-4) on September 11th was selected for this station. The selection criteria also considered the wavelength, to include signal to noise ratios as different as possible from those usually processed by each group. For Manaus,
TABLE II
Probability of detection of local (Loc), regional (Reg), or long-range transported (Lrt) aerosols according to the analysis of air quality model forecasts, weather bulletins and MODIS images for September 11 to 14. Low (↓), medium (∼), or high (↑) confidence levels were considered. Days with cloudiness above 80% are indicated by *, while those selected for the exercise are shown in bold face.
Station Sep 11 Sep 12 Sep 13 Sep 14
Ma Reg↑ Reg↑ Reg↑ Reg↑
Sp Lrt↓ Lrt∼ Lrt↑* Lrt∼*
Bu Loc↓ Loc↓ Lrt∼ Lrt↑
Cp Reg↑ Reg Reg↓* Reg↓
data from the 355 nm analog channel was selected. For São Paulo and Concepción, the choice was the 532 nm analog. The 1064 nm infrared analog channel was taken from Buenos Aires data.
2.4. Inversion exercise
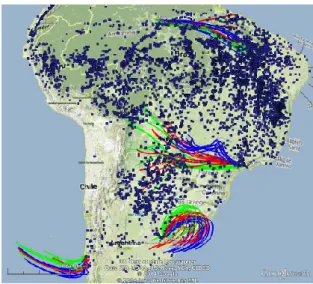
The four 1-h average elastic profiles were distributed with the nearest radiosonde data to the research groups. HYSPLIT back trajectories were calculated for 48 h starting from the selected period for each station. These are shown in (Fig. 2) with fire spots from AQUA/MODIS satellite data. For the selected periods, fresh smoke was expected at Manaus; a mixture of urban pollution and aged regional smoke at São Paulo and Buenos Aires; and marine aerosols at Concepción.
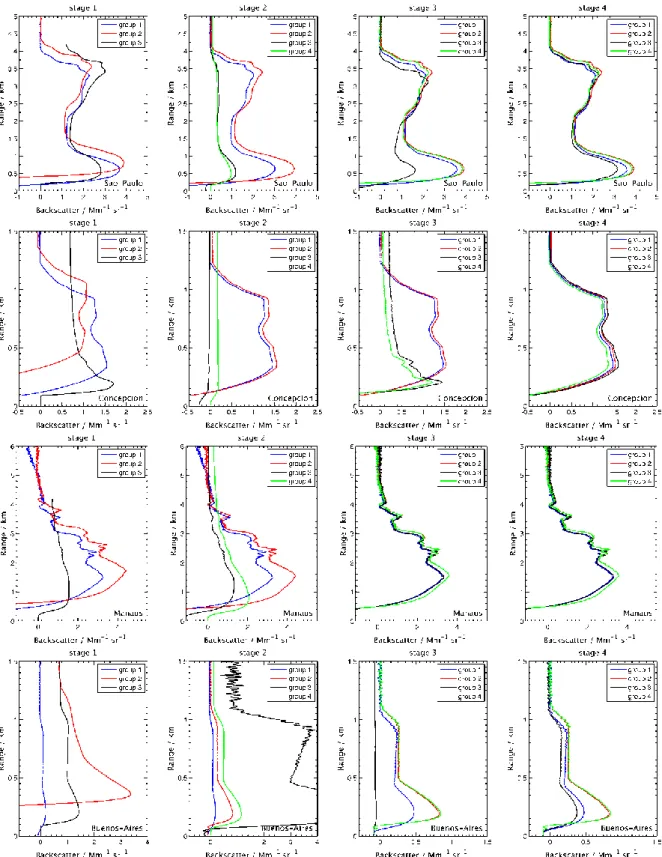
It was requested that each group should obtain the backscatter coefficient using only the elastic channel. The comparison was performed in five stages. Except for the first, each stage started with the review and discussion of the differences found in the previous stage. Each stage ended with the delivery of new results from the improved algorithms of each group. The lidar groups from Concepción, Manaus and São Paulo contributed with inverted backscattering profiles to the first stage. Concepción, Manaus,
Fig. 2. Fires (dark blue) detected by INPE algorithm (http://www.inpe.br/queimadas/) using AQUA/MODIS satellite data from September 10th to 14th 2012 are shown.
Lines correspond to 48 h HYSPLIT back trajectories (http://ready.arl.noaa.gov/HYSPLIT.php) starting at the time selected for each station and altitude of maximum backscatter (Fig. 3). Trajectories were calculated in ensemble mode using GDAS meteorological data.
Medellín and São Paulo contributed to the second, third and fourth stages (interactive). In the following analysis, these lidar groups are anonymously identified as group 1, 2, 3 and 4.
Stage 1 (blind): This first stage required the elastic inversion to be performed without any specification on the method or underlining hypothesis, e.g. gluing, molecular reference region, Rayleigh fit, overlap correction or particle backscatter at reference height. The only parameter fixed was the extinction to backscatter ratio (lidar ratio, or LR), chosen as 55 sr-1 for Manaus, 30 sr-1 for Concepción and 70
sr-1 for the other sites. These are typical values
for the expected aerosol types at each station. Stage 2: It was specified that all groups should use an algorithm for the elastic inversion based on backward Klett [8], thus starting integration from above the aerosol layer and going towards the ground.
Stage 3: Further restrictions on the algorithm were imposed. The Fernald method [7] should be used, i.e. the backscatter was to be obtained first, and the extinction to be calculated latter from and the lidar ratio.
Stage 4: The reference altitude should be fixed at 1 km above the aerosol layer and no particle backscatter should be assumed at this altitude.
Stage 5: It was not possible to estimate the analog delay for the Buenos Aires dataset as the photoncount channel was not available. Hence, the experimental value of 7-bin should be used for this last stage.
3.
Results
Backscatter profiles obtained from each group for comparison stages 1 to 4 are shown in (Fig. 3). Each row presents results from a different dataset, and each column from a different stage. For São Paulo input data, results presented at stage 1 showed very important systematic differences. For instance, results from groups 1 and 2 were offset due to an error in the consideration of the lidar ground altitude that was corrected by group 2 in the second stage. Both groups 1 and 2 used an algorithm based on backward Klett-Fernald [7,8] and the
backscatter profile obtained starts from 0 Mm-1
sr-1 above the aerosol layer, becoming negative
at low altitudes as expected, since no overlap correction was performed. Group 3 used an algorithm based on forward Klett [9] to obtain firstly the extinction and latter the backscatter coefficient with the prescribed lidar ratio. Their implementations lead to 0 Mm-1 sr-1 near ground
with large positive values at the layer top. In the second stage, groups 3 and 4 modified their algorithms and performed a backward Klett [8] but yet computing firstly the extinction. Results obtained were similar but different from backward Klett-Fernald. In stage 3, these groups changed their algorithm one more time and performed a backward Klett-Fernald. Group 4 obtained values very close to those of group 2, which are both slightly different from group 1. Group 3 had a badly chosen reference height that was corrected in stage 4, leading to values similar to group 1.
Very similar improvements at each stage can be seen in the results from Concepción data (Fig. 3, second row). Again, both forward Klett and backward Klett algorithms lead to unrealistic profiles. Stage 4 showed an excellent agreement between the results from the four algorithms for the Concepción dataset, with differences of about 0.2 Mm-1 sr-1 for a maximum backscatter
of 1.5 Mm-1 sr-1. In fact, this is 50% less than the
differences for the São Paulo dataset, about 1 Mm-1 sr-1 for a maximum backscatter of 3.5 Mm-1
sr-1. As the algorithm used by each group was the
same for the different datasets, this was not expected. Comparing stage 4 for all the datasets (Fig. 3, last column) we identified two clusters of results in the case of São Paulo, Manaus and Buenos Aires datasets. The absolute difference between groups 1-3 and groups 2-4 is about 0.5 Mm-1 sr-1 at the height of maximum backscatter
in these three cases. The relative differences, however, increase for smaller backscatter values, as can be noted comparing Manaus and Buenos Aires.
4.
Discussion
Although differences remaining after three interactive discussions (Fig. 3, last column) are small and typically less than the associated
Fig. 3. Particle backscatter coefficients (Mm-1 sr-1) obtained by each participating group are shown. From top to bottom, rows shows the results from São Paulo, Concepción, Manaus and Buenos Aires datasets. Results of the same stages are shown in the same columns. A good agreement is found only in stage 4, except for Buenos Aires dataset that required a fifth stage.
uncertainty (not shown but of the order of 20%) they are systematic. For instance, going downward from above the aerosol layer, an increase in the backscatter coefficient is firstly found in the results from groups 2 and 4 and latter (lower) in the results from groups 1 and 3. This happens for São Paulo, Manaus and Buenos Aires and not for Concepción. A possible explanation could be the correction for the analog delay applied differently by each group. Analog delay is the time required by the analog to digital converter (ADC) to convert the analog voltage measured by the photomultiplier tube into a digital number and to record it in the memory bank that is then read by the computer. Transient recorders from LICEL, as used in all the systems operating in ALINE, usually have an analog delay of about 5-10 bins that needs to be accounted for.
Group 1 calculated a 0-bin delay for Concepción and a 10-bin delay for Manaus and São Paulo by comparing the analog and photoncount channels and assumed the same 75m for Buenos Aires. Group 3 also calculated the same delay as group 1 for Concepción, Manaus and São Paulo, but considered a 7-bin delay for Buenos Aires [3]. Groups 2 and 4 did
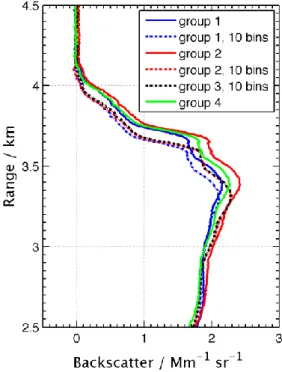
Fig. 4. Comparison of the particle backscatter coefficient (Mm-1 sr-1) obtained by different groups from the São Paulo dataset with 0 and 10-bin analog delay are shown.
not do any correction. The Concepción dataset was the only one where the four groups applied the same criteria, i.e. no delay, and thus explains why they found the same results. To investigate if all algorithms would give the same result with the same delay, it was requested that each group should do the analysis for São Paulo (largest aerosol loading) with 0 and 10-bin analog displacement. The systematic difference shown in Fig. 4 is indeed compatible with the vertical displacement seen in results of stage 4 for Manaus, Buenos Aires and São Paulo.
It is important to note, however, that this 75 m vertical displacement of the lidar signal had a large impact on the retrieval of the backscatter coefficient at lower altitudes, as was noted for Buenos Aires. Similar differences of about 0.5 Mm-1 sr-1 can be seen in the last column of (Fig.
3) for São Paulo and Manaus, but are relatively smaller because of the larger aerosol content. To investigate this effect, group 1 performed lidar inversions assuming different delays for the São Paulo dataset (Fig. 5). Results indicate that the difference increases downward from the reference altitude. For this particular aerosol loading, the differences between a 10-bin correction and no-correction are -0.1 Mm-1 sr-1
at 3.5 km and -1 Mm-1 sr-1 at 0.75 km. Not
correcting for the analog delay, in this case, would mean an overestimation of the backscatter coefficient by about 25% below 1 km.
This systematic difference increasing downward, from the displacement of the lidar signal, can be understood from the Klett-Fernald solution that, for a constant particle lidar ratio,
, is usually written as: (1) (2) where is the range corrected signal, is the molecular lidar ratio, is the reference height and it was assumed that the
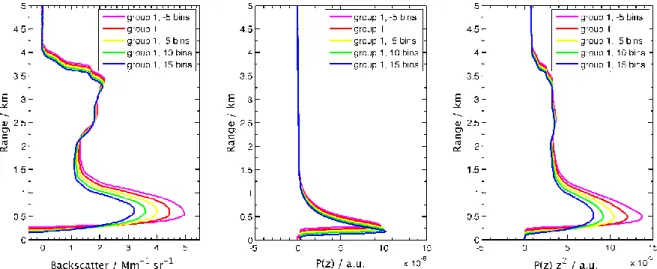
Fig. 5. The particle backscatter coefficient obtained by group 1 with various analog delays (left), the delay corrected lidar signal (center), and the delay and range corrected lidar signal (right) are shown.
molecular region was well chosen so that .
The first thing to recall is that the background corrected is scaled to the molecular reference profile , or vice-versa, for inverting the lidar signal. As the signal is displaced downward relatively to the molecular reference, this scaling coefficient is increased by 4% for a 10-bin delay (analysis not shown). This, effect can be noted in the signal, as shown in the center panels of Fig. 5. However, this 4% cannot explain the difference in the results as depends on the normalized signal which is not affected by this scaling. Therefore, we rewrite Eq. (1) explicitly as a function of the vertical displacement, ,
(3)
where we assumed a downward shift for , the reference height was kept at same altitude and the different molecular scaling is already canceled out. In this form, it is clear that the observed change in the backscatter solution comes from the shift of the signal relative to , which is a function rapidly increasing with altitude. In the right panel of Fig. 5, the range corrected signal is shown and the effect of the is clear: although the result for a
Fig. 6. Particle backscatter coefficients obtained by different groups for the Buenos Aires dataset are shown. In this stage 5, only group 1 reprocessed the data using two assumptions for the analog delay: 7-bins (as group 3) and 0-bins (as groups 2 and 4).
15 bin delay (blue) has a higher maximum signal, it has lowest maximum range corrected signal and, hence, lowest maximum backscatter coefficient.
To show that this large change in the backscatter coefficient caused by a vertical displacement of the lidar signal indeed explained
the differences in the Buenos Aires results, a fifth stage was performed. The results shown in Fig. 6 were obtained with the measured analog delay of 7-bin. Groups 1 and 3 agree reasonably well, showing only a small difference of about 0.05 Mm-1 sr-1 between 400-900 m. This corresponds
to a difference of 0.002 in the aerosol optical depth and is thus negligible. Groups 2 and 4 show even smaller differences.
5.
Conclusions
The pilot campaign accomplished by the Latin American Lidar Network (ALINE) in 2012 was the first coordinated effort to perform simultaneous lidar measurements in the Latin America. The difficulties involved in the
coordination of such simultaneous
measurements were mainly due to (1) reduced manpower, (2) manually operated lidar stations, and (3) weather permitting conditions. At the end of the day, only four stations out of eight were able to take measurements and only during a reduced number of days. The analysis period that followed afterwards was not easier and only four groups, out of nine taking part in ALINE, were able to deliver the results.
Differences as large as a factor of 5 were detected when the backscattering profiles obtained by each group were initially compared. These differences were reduced as the algorithms were modified or improved after each of the five proposed stages. The systematic errors found in different algorithms emphasize the need for analysis, measurements and data quality protocols. For instance, it was demonstrated that the delay between analog and the laser trigger has a crucial importance in the inversion of the lidar signal, particularly in the
boundary layer. Differences in the magnitude of the backscattering coefficient were found to be as large as 0.5 Mm-1 sr-1 when a 0-bin and a
10-bin delay were considered. The data quality protocol for ALINE, therefore, should demand the experimental determination of this delay for each lidar station.
Nonetheless, after the fifth comparison stage, the differences in the backscatter coefficient obtained by the different groups were about 20% in the worse case, but typically less. This demonstrates unequivocally the importance of comparison exercises on lidar processing algorithms as a tool for quickly establishing a uniform and joint dataset for the network.
Therefore, we suggest that further
intercomparison exercises should be performed under the ALINE framework, as more complex algorithms still need to be reviewed, e.g. Raman and water vapor. Intercomparisons of Lidar system performances should also be done for giving additional information needed for full lidar data analysis.
Acknowledgments
Authors are grateful for suggestions and advice from Dr. Albert Ansmann and Dr. Holger Baars during the writting of this manuscript. H. M. J. Barbosa and B. Barja acknowledges the financial support from Fundação de Amparo à Pesquisa do Estado de São Paulo (FAPESP) under grant
numbers 2008/58100-2, 2011/14365-5,
2012/16100-1 and 2013/05014-0. Funding from Comissão de Aperfeiçoamento de Pessoal do Ensino Superior (CAPES) and the Science without borders program under grant BJT-A16_2013 is also acknowledged.