CAR METHODOLOGY
MANUAL
A METHOD FOR IDENTIFYING
REGULATORY BURDEN WITHIN A SECTOR
Patrick van der Poll Peter Bex
Joland van der Heijden Frans van Eck
ISBN/EAN: 978-90-815210-0-0
The CAR methodology is a co-production of the Ministry of Economic Affairs and SIRA Consulting. It was developed in close consultation with the Confederation of Netherlands Industry and Employers (VNO-NCW), the Royal Association MKB Nederland, the Dutch Association of the Paint and Printing Ink Industry (VVVF),
3
CONTENTS
Foreword 7 CAR thesaurus 9 Summary 11 Part I. Explanation 13Part II. Procedure 29
Part III. Method sand techniques 53
5
FOREWORD
The CAR methodology (Cost driven Approach to Regulatory burdens) is a new tool for identifying unnecessary burden caused by legislation and regulations. It has been developed with a view to increasing business profitability by eliminating problematic regulatory burdens. This CAR Methodology Manual was commissioned by the Dutch Ministry of Economic Affairs.
The Manual consists of three parts:
• Part I: Explanation
Information on the background, added value and principles of the methodology. This part of the Manual is of particular interest to those becoming acquainted for the first time with the CAR methodology and its potential applications.
• Part II: Procedure
Description of the main points of the application procedure, with special attention for the phased approach and the project organisation. This section is for you if you are involved in a CAR study but are not carrying it out yourself.
• Part III: Methods and techniques
Detailed description of the methods and techniques used. This section is intended for research bureaus that are using the CAR methodology, and especially for those researchers who are actually applying it.
We worked on the development of the CAR methodology and wrote this Manual between June and November 2014. We were assisted by a supervisory committee in which the following bodies were represented:
• The Dutch Ministries of Economic Affairs, Social Affairs & Employment, Security & Justice and Health, Welfare & Sport;
• The municipalities of The Hague and Rotterdam;
• Actal, the Dutch Advisory Board on Regulatory Burden;
• The Confederation of Netherlands Industry and Employers (VNO-NCW) and the Royal Association MKB Nederland ;
• The Dutch Association of the Paint and Printing Ink Industry (VVVF).
We would like to thank the members of the supervisory committee for the stimulating cooperation. The meetings were interactive work sessions which produced inspired discussion of the key aspects of the methodology and the content of the Manual. The constructive and positive critical attitude of the committee members made an important contribution to the quality of the CAR methodology.
We would also like to thank our client for the excellent cooperation and sharing of expert knowledge throughout all phases of the project.
On behalf of the colleagues at SIRA Consulting, Peter Bex, Director
7
CAR THESAURUS
Definitions
It is important for every methodology that the concepts used are uniformly defined. This CAR thesaurus explains the key concepts used in the CAR methodology. The definitions are aligned with the Measuring Regulatory Burden (Meting Regeldruk) manual produced by the Dutch Ministry of Economic Affairs.
Administrative burden
The costs of complying with information requirements stemming from government legislation and regulations. It involves the collection, processing, registration, storage and making available of information.
Business operations
The way in which a company is run or managed. The term ‘management’ can sometimes also be used.
Impediment
An aspect of regulatory burden that, while it does not cost money directly, does mean that a business is constrained in its entrepreneurial activities. Eliminating impediments, as well as reducing the perceived regulatory burden, leads to increased turnover and thus to better operating results.
EBIT
Earnings Before Interest and Tax: the operating income of a business before deduction of interest and tax.
Government
Regulations are established by different strands and levels of government. Depending on the context, the CAR methodology uses the term ‘government’ to refer to:
• EU institutions;
• Dutch government departments;
• executive organisations;
• regulators;
• provincial authorities;
• local authorities;
• water boards;
• independent governing bodies (ZBO).
The CAR methodology was developed in order to identify the unnecessary regulatory burden stemming from government legislation and regulations.
Traceable financial problem areas
The unnecessary burden – expressed as costs – faced by a business in complying with obligations stemming from two sources: government legislation and regulations and rules imposed by other organisations carrying out tasks on the grounds of legislation and regulations. Traceable financial problem areas are reflected in a company’s financial administration.
Tangible problem areas
Problems which businesses experience in their contacts with the government but which are not financially traceable in their financial administration. They include things such as impediments encountered by a business in performing or expanding its activities (opportunity costs), but also the way in which the government approaches businesses (irritations about attitude and behaviour).
Compliance costs
Compliance costs stem from obligations enshrined in legislation and regulations, for example when purchasing physical resource such as fire protection equipment (fire alarm, extinguishers, emergency lighting, etc.) or attaining a required qualification.
Pseudo-legislation
A container term for policy rules and other non-statutory rules. Policy rules are rules set by a competent independent governing body which stipulate how a specific internal competence is used. Other non-statutory rules also relate to the exercise of authority, but are not focused on an internal competence (e.g. circulars and implementation guidelines).
Sector
A sector comprises all professional participants in the economic process within a given category of services and/or products. Statistics Netherlands (CBS) is the body in the Netherlands that is responsible for the codification of sectors based on the Standard Industrial Classifications, or (SBI, Standaard Bedrijfsinde¬ling 2008). Examples include the hospitality industry, the hairdressing sector, the chemical sector, etc.
Standard Cost Model
The CAR methodology uses a calculation model that is based on the Standard Cost Model (SCM). This model quantifies the administrative burden and compliance costs of new or amended regulations. The Dutch Ministry of Economic Affairs describes the SCM in the ‘Measuring Regulatory Burden (Meting Regeldruk) manual.
Regulatory burden
Businesses have to comply with the law. Regulatory burden encompasses all the investments and efforts they have to make in order to do this, as well as the constraints this imposes on their freedom. The CAR methodology also regards obligations ensuing from pseudo-legislation as regulatory burden.
N.B. Obligations ensuing from covenants are not classed as regulatory burden, because these are voluntary arrangements between parties that are laid down in an agreement. As soon as these obligations from covenants are adopted in regulations, however, they
9
Legislation and regulations
These are generally binding rules: laws, Acts in Council and ministerial regulations. They may be based on decisions by EU bodies. They may also be incorporated in municipal or provincial rules, for example.
Legal/statutory obligation
This obligation stems from legislation and regulations and requires businesses to perform certain tasks or take certain measures. A legal obligation can be traced directly to one or more sections of legislation and regulations. The way in which a business ultimately complies with the obligation can vary due to the way in which the competent authority implements the legislation and regulations.
11 Regulatory burden impacts
on business profitability
SUMMARY
Making unnecessary burden visible
Businesses incur costs in complying with obligations stemming from legislation and regulations, for example by investing time and money in financial accountability and keeping books. But maintaining a salary and absenteeism administrations also costs a lot of money. In addition, specific rules apply in many sectors, depending on the goods or services supplied by companies within that sector.
To determine the extent to which these regulatory costs impact on company profits, the Ministry of Economic Affairs developed the CAR methodology. This methodology produces a clear picture of the impact of regulatory burden on business profitability. This enables businesses to bring specific regulatory pressures to the attention of government authorities.
The CAR inventory focuses on unnecessary regulatory burden, the removal of which, can make a demonstrable contribution to economic growth and employment – often not just for the sector in question, but for other sectors too.
The added value of the CAR methodology
The CAR methodology provides a very complete picture of the unnecessary burden experienced by businesses in a given sector. On the one hand there are traceable financial problem areas. These impact directly on business costs and are shown as cost centres in the accounts. In addition, the CAR methodology identifies unnecessary burden that is not directly quantifiable, such as impediments encountered by businesses wishing to expand, innovate or develop their business.
The CAR inventory starts from the actual situation ‘on the ground’. Unnecessary burden is traced back to the legislation and regulations from which the obligations ensue. The result is a complete overview of the unnecessary burden and its impact. This overview also indicates precisely which regulation is causing that burden .
The CAR methodology in practice
The CAR methodology has been used successfully at both national and international level in:
• the chemical sector (designated as a Top Sector);
• the hairdressing sector;
• mental health care;
• an international comparison of bakeries.
The results provide businesses with specific tools to engage in dialogue with government. The CAR methodology therefore keys indirectly into the Top Sector and Sectoral approach of the Ministry of Economic Affairs. The experiences gained in these projects have been incorporated into this Manual.
The CAR methodology gives businesses an insight into the unnecessary burden caused by legislation and regulations
The CAR methodology has been applied successfully in four sectors
Part I
Explanation
CAR methodology
A method for identifying regulatory burden within a sector
15
PART I: CONTENTS
1. Introduction 17 A complete picture of unnecessary burden within a sector
2. Contours 19 Purpose of the CAR methodology
21 Added value of the CAR methodology
3. Principles 23 Features of the CAR methodology
Guide
In this first part of the Manual you can read about the background, purpose, added value and general principles of the CAR methodology. This part is of interest for readers making a first acquaintance with the CAR methodology and its potential applications. It is of particular importance if you are involved in a CAR study, but are not performing it yourself – for example if you have commissioned a CAR study or are a member of the supervisory committee.
17 Firms face both general and
sector-specific issues
Regulatory burden consists of more than just financially traceable expenses and costs
Bottom-up. The CAR methodology identifies the regulatory burden where it is felt – in the business.
1. INTRODUCTION
A complete overview of unnecessary burden within a sector
Commercial companies and institutions incur costs for complying correctly with all obligations arising from legislation regulations and following mandatory instructions. All firms are subject to general obligations, such as financial reporting requirements, keeping proper accounting records and maintaining a salary and absenteeism administration. In addition, specific rules apply in many sectors for the supply of goods and services. For example, businesses in the hairdressing sector spend a good deal of their budget on mandatory ergonomic materials such as scissors, work clothing and hydraulic chairs. By contrast, organisations in the mental health care sector invest a great deal of time and money in complying with rules set by health insurers. As mental health is a sector involving extensive use of public money, these organisations must meet strict financial accountability standards in relation to the care provided.Regulatory burden: necessity or pointless red tape?
Businesses see some of these costs as necessary investments, but experience others as unnecessarily burdensome. Hairdressers, for example, consider ergonomic materials to be necessary for running their business properly. But they also believe that the costs of providing an in-house emergency and first aid service are out of proportion to the low risks in hairdressing salons. Similarly, mental health institutions accept that reporting is a necessary part of providing good care, but feel it goes too far to make it mandatory for care providers to keep a minute by minute record of what care has been provided in what way.
In addition, businesses see regulatory burden as more than just administrative red tape and compliance costs. As well as direct costs, they also experience irritations in their contacts with the authorities and lost income due to slow and lengthy procedures.
A better overview using CAR methodology
The CAR methodology was developed in order to provide a better overview of the total impact of the regulatory burden at individual company level, but above all to identify opportunities to reduce that impact significantly. The methodology approaches the issue of regulatory burden from the perspective of the company (bottom-up).
By making use of the principles of the Standard Cost Model (SCM) it is always possible to identify which regulations or procedures cause the regulatory burden or irritations. The CAR methodology thus offers a systematic means of identifying unnecessary burden and opportunities for improvement.
1 The CAR methodology is suitable for identifying and describing the issues caused by the regulatory burden in all
kinds of organisations, including commercial companies but also semi-government institutions and non-commercial organisations. The terminology used in this Manual is based on the application of the methodology to organisations (businesses) operating in a commercial sector.
Also in this section
This section of the Manual is made up of three chapters. Following this introduction, you will read more about the contours, the purpose and the added value of the CAR methodology. Chapter 3 describes the most important general principles of the methodology.
19 The CAR methodology
brings to light traceable financial and tangible problem areas
Inventory of specific issues in day-to-day business operations
2. CONTOURS
The purpose of the CAR methodology
The CAR methodology is an inventory tool designed to make regulatory burdens and specific issues visible from the perspective of a company. These burdens stem directly from the day-to-day operational activities of companies or institutions.
Besides identifying the regulatory pressure points experienced by businesses, the CAR methodology also illustrates the way in which regulatory burden impacts on:
1. business profitability; 2. the scope for innovation;
3. economic growth and employment in a sector.
Structure
The purpose of the CAR methodology is to provide companies with a practical toolkit to enable them to bring specific regulatory pressures to the attention of the public authorities. The methodology makes clear what impact legislation and regulations have on day-to-day operations and on long-term developments. Since all this can be traced back to specific rules and procedures, the business community can engage in direct dialogue with government, creating the opportunity for government and business to remove burdens and obstacles on the basis of observed facts.
The CAR methodology distinguishes between:
• Traceable financial problem areas: demonstrable costs incurred as a result of legislation and regulations, which can be reduced through more efficient and effective
implementation. The impact of these costs is reflected in the financial administration.
• Tangible problem areas: issues which mean that certain business investments, developments or innovations do not take place or take place later than desired as a result of government regulations or their implementation. These issues may entail loss of income, and their commercial impact cannot be quantified in a straightforward way from the accounting records.
The CAR methodology creates a complete picture of the traceable financial and tangible problem areas caused by regulatory burden within a company. It provides an inventory of specific issues in day-to-day business operations. These issues have a direct impact on profitability, entrepreneurship, employment and the scope for growth and innovation within companies.
Ultimately, the CAR methodology is an instrument which provides leads for a dialogue between the business sector and government. The aim is to resolve issues and thereby increase the economic strength of business.
€
1
2
3
4
CREATING ECONOMIC GROWTH
AND INCREASE EMPLOYMENT
2.2 CONDUCTING IN-DEPTH INTERVIEWS WITH THE EXECUTIVE AND MANAGEMENT 3.1 DETERMINING THE FINANCIAL
TRACEABLE AND TANGIBLE REGULATORY BURDEN
3.2 COMPARABLE COMPANIES ASSESS THE RESULTS OF THE BUSINESS ANALYSIS. ARE THE RESULTS RECOGNISABLE?
4.2 STAKEHOLDER ANALYSIS
4.1 TRACING BACK THE RELEVANT LEGISLATION AND PROCEDURES CAUSING THE UNNECESSARY BURDEN
DETAILED DESCRIPTION OF THE MAIN PROBLEM AREAS
IMPACT OF REGULATORY BURDEN 2.1 MAKING AN ANALYSIS OF
THE FINANCIAL ADMINISTRATION AND BUSINESS OPERATIONS FINAL REPORT
1.1MAKING A DESCRIPTION OF THE SECTOR
1.2 MAKING A SELECTION OF THE REPRESENTATIVE COMPANIES
SECTOR ANALYSIS BUSINESS ANALYSIS
CAR-METHODOLOGIE
21 The CAR-methodology
provides an insight into the impact of regulatory burden on business profitability
The CAR methodology aims to improve the striking power of business
The added value of the CAR methodology
The CAR methodology is a unique tool which provides a comprehensive overview of the quantitative and qualitative impact of legislation and regulations at the level of individual companies. The CAR methodology:
• Quantifies the regulatory burden by analysing the financial administration of the business and bringing to light the actual costs of regulation and statutory procedures.
• Shows the commercial impact of regulations, among other things by relating them to the profitability of a business.
• Makes visible the obstacles that stand in the way of businesses in their further development, innovation and/or growth. Which regulations cause this impact? Which practical options are available for reducing the regulatory burden?
• Provides an insight into the perception of businesses regarding government implementation of legislation and regulations.
• Demonstrate whether government measures aimed at reducing the regulatory burden have the desired effect in practice.
• Has added value at company level. What costs does the regulatory burden create? Can the business streamline its compliance? Which regulatory obstacles need to be removed for this to happen?
• Makes regulatory burden reduction more visible by engaging businesses in identifying regulatory pressure and seeking solutions. The advantage of this is that the business gains a greater insight into the government approach to reducing the regulatory burden with a view to increasing the economic strength of businesses.
Regulatory burden in the context of the CAR methodology
The primary aim of the CAR methodology is to compile an inventory of unnecessary burden within a sector and to identify, formulate and discover the origin of regulatory burden within companies. This means that the methodology complements existing instruments aimed at mapping out the regulatory burden in a top-down way, from the perspective of the regulator.
The added value of the CAR methodology is clear:
• It provides a broader picture than other methods of the unnecessary burden experienced by businesses. It does not look only at burden caused by the plethora of obligations, but also explicitly focuses on unnecessary burden caused by the implementation of regulations by government and the quality of service delivery in this regard.
• It places the emphasis on improving the economic striking power of businesses. The inventory forms the basis for initiating a dialogue between the business sector and governmental organisations in order to resolve the issues and thus increase the profitability of businesses.
Broad picture of regulatory pressures
Figure 2 illustrates the role of the CAR methodology in calculating the total regulatory burden of businesses and identifying the unnecessary burden.
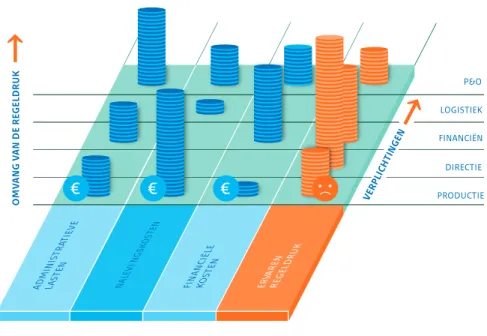
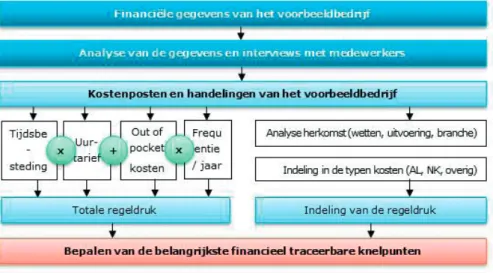
The CAR methodology analyses and visualises the entire area where businesses experience regulatory burden. It creates an insight into both the quantitative aspects of the regulatory burden (administrative burden, compliance costs) and the qualitative aspects (perceived regulatory burden). The method identifies the ‘sites’ where the regulatory burden is greatest, i.e. the traceable financial and tangible problem areas. These are portrayed as coin stacks and negative emoticons.
O M VA N G V A N D E R EG EL D R U K REGELDRUK NALE VI N GSKO STEN ADM INIS TRAT IEVE LAST EN ERVA REN REGE LDRU K FINA NCIË LE KOST EN P&O LOGISTIEK FINANCIËN DIRECTIE PRODUCTIE VERP LICH TIN GEN
23 Regulatory burden is used
to identify unnecessary burden
Day-to-day business operations are the starting point
3. PRINCIPLES
The CAR methodology uses the regulatory burden as a starting point for identifying unnecessary burden
The CAR methodology identifies both the financially traceable costs and the perceived regulatory burden. The company’s accounting records are examined in order to provide a clear picture of the impact of these costs. A dialogue is initiated with company management and staff in order to identify the perception of regulatory burdens and obstacles. The inventory reveals the regulatory pressures within the sector and pinpoints the issues. The experiences of businesses form an explicit part of this exercise.
N.B. Regulatory burdens are quantified purely in order to identify issues and their impact. A CAR inventory involves a business analysis in only a limited number of cases. Together with the working sessions, this provides a good picture of the issues in the sector, but this is not enough to enable the results to be extrapolated and the regulatory burdens for an entire sector to be quantified.
The CAR methodology starts from the actual compliance experience of businesses
It is well known that not all businesses comply with all regulations fully and strictly all the time. Defective compliance is sometimes deliberate, but often accidental. It can happen if a company is not (fully) aware of the prevailing legislation and regulations, or if there is a lack of clarity regarding the required level of compliance.
This can be due to the large number of regulations, the speed with which regulations change and/or the scope for interpretation of regulations. Discussions about obligations can also lead to deliberate non-compliance with obligations. In this sense, non-compliance can also be a sign of a problem in the prevailing regulatory frameworks.
Companies also sometimes – deliberately or otherwise – do more than is required by law. This ‘overcompliance’ is outside the scope of the costs of regulatory burdens, but can also be a useful signal of problems with (communication about) prevailing legislation and regulations. These signals are therefore included when investigating tangible problem areas, so that the sector gains an insight into its own scope for limiting costs. The primary aim of the CAR methodology is after all to optimise the implementation of legislation and regulations in order to increase the economic strength of organisations within a sector.
Over-compliance does not count when calculating the regulatory burden
Regulatory burden may need to be approached in different ways in different subsectors Example: Overcompliance by hairdressers
The CAR study carried out in the hairdressing sector shows that a large part of the regulatory burden for this sector stems from obligations in relation to the financial administration, for example the time and effort needed to compile annual accounts and to pay tax.
Hairdressers are not always aware of the obligations they have to meet. This is partly because rules are spread across different pieces of legislation, and partly because those rules change regularly. To be certain that they are complying with the minimum applicable obligations, hairdressers sometimes have their accounts audited. This involves high costs. These hairdressers are not aware that an audit is not obligatory.
Overcompliance in this case consists of unnecessary costs incurred for a non-obligatory audit. These costs fall outside the scope of the financially traceable regulatory burden, but do provide an important signal of the need to improve the communication on the rules for this group. In such cases, the CAR methodology also looks at the scope for the sector itself to make cost savings.
The CAR methodology does not distinguish between external and internal costs
The distinction between internal and external costs is not relevant in the CAR methodology. After all, the aim is to improve the economic strength of organisations, and it makes no difference whether the costs are specific to the company or external.
Occupational safety regulations mean that some companies have to purchase personal protection equipment (external costs). But even without this obligation they would purchase this equipment in order to protect their staff (internal costs). This obligation is not experienced by companies as a problem and therefore does not appear on the inventory.
The CAR methodology reveals differences between but also within sectors
The number of laws and rules encountered by a company depends partly on the sector in which it operates. Different rules apply for the retail sector, for example, than for sectors which are funded largely from the public purse, such as the care sector.
Within each sector, the unique characteristics of each business mean that the regulatory burden differs from one company to another. In the selection of Model Companies, therefore, the CAR methodology makes allowance for these differences and where necessary distinguishes between subsectors.
To make differences within a sector visible, the CAR approach begins with a sector analysis. Specific business activities bring specific obligations, leading to variation in the regulatory burden for different types of business. If different companies within a sector perform different activities, and are therefore subject to different obligations, we call this a subsector. In that case, several Model Companies from different subsectors are analysed in order to obtain a representative picture of the impact of the regulatory burden within the sector as a whole.
25 Companies also experience
regulatory burden from sector agreements
Regulatory burden has a direct influence on companies’ profits and scope for innovation
The CAR methodology creates transparency regarding the self-imposed obligations of companies and sectors
Companies can also experience regulatory burden due to obligations imposed by the sector itself. Those obligations thus do not stem from legislation and regulations, but for example from protocols and guidelines designed by a sector organisation in order to assure quality within the sector. Instruments such as these are sometimes prerequisites for membership. Although these arrangements are not legally binding, businesses often regard them as obligations.
The CAR methodology identifies the individual problems that can stem from these self-imposed obligations made by the sector itself. Where possible, the costs are also quantified.
The CAR methodology makes unnecessary burden transparent and traceable to the legislation and regulations that causes it
It is important to have a very clear picture of which regulatory burden is caused by which regulations and statutory procedures. All the calculations needed to determine precisely what constitutes the regulatory burden must be completely transparent. To achieve this, the CAR methodology uses the SCM as a basis for quantifying the burden.
The CAR methodology provides an insight into the economic strength of companies
The CAR methodology calculates what percentage of its total costs a company spends on compliance. This is the financial impact of the regulatory burden on the company’s economic strength. The transparency provided by the SCM makes the potential cost reductions visible.
In commercial sectors, this calculation is based on the relationship between costs and EBIT (Earnings Before Interest and Tax). The inventory highlights the issues that have a negative impact on the profitability of companies within the sector.
Figure 3 illustrates the relationship between business operating costs, production costs and EBIT, and shows that an increase in regulatory burden impacts on a company’s EBIT.
Figure 3. Schematic representation of the role of regulatory burden in the costs of commercial companies
In non-profit sectors, there is by definition no profit motive. Yet here, too, increasing an organisation’s economic strength is very important. That strength gives non-profit organisations the opportunity to invest and innovate further in order to achieve their (non-commercial) objectives. Omzet Bedrijfs- kosten EBIT Kosten grondstoffen Overige kosten Regeldruk (RD) Productie- kosten Bedrijfs- kosten EBIT Kosten grondstoffen Overige kosten Regeldruk (RD) Productie- kosten Omzet
Effect van een toename van de regeldruk (bij gelijkblijvende Overige kosten en Kosten grondstoffen)
Afname EBIT
RD EBIT
27
Part II
Procedure
CAR methodology
A method for identifying regulatory burden within a sector
31
PART II: CONTENTS
1. Introduction 33 How the methodology is applied
2. Procedure 35 Phased approach
3. Step-by-step plan 37 Step 1 – Sector analysis
39 Step 2 – Business analysis
41 Step 3 – Impact of regulatory burden
43 Step 4 – Description of problem areas
4. Reporting 45 The business analysis and the final report
5. Organisation 47 Planning
48 Organisation
Guide
This second section of the Manual describes the procedure for carrying out a study using the CAR methodology. It is intended to provide a clear picture of the activities and results of such a study. It is therefore intended primarily for people who are involved in a CAR study but who are not carrying it out themselves, for example people who commission or supervise a CAR study.
33 A CAR study is carried out
in four phases
1. INTRODUCTION
How the methodology is applied
This part of the Manual is of interest to you if your organisation will be using the CAR methodology or if you are supervising a CAR study. In this section you will read all about the phased approach of the CAR methodology. Tips are given for each phase. You will also find an overall outline of the throughput time and planning of a CAR study.
Analyses based on established methods
The CAR methodology provides an insight into the impact of regulatory burden on business profitability. The researchers compile an inventory of the regulatory burden, both quantitatively – the traceable financial problem areas – and qualitatively: the perceived, constraining regulatory burden. The result of a CAR study is a complete overview of the unnecessary burden experienced by an organisation and its impact. The overview also indicates precisely which regulations cause this.
This inventory of problem areas forms the input for measuring the impact of the regulatory burden. This begins with a sector analysis and a business analysis. In the ensuing chapters you will read how the different methodologies are used in the phased approach of the CAR methodology.
Part III ‘Methods and techniques’ contains detailed information on the step-by-step approach of the analyses.
35 The step-by-step plan
provides for a manageable study
2. PROCEDURE
Phased approach
As stated, the CAR methodology uses a phased approach. This phasing ensures that the study remains clear and manageable in terms of content, process and planning. Figure 4 illustrates the four phases.
Figure 4. Phased approach of the CAR methodology
5 DETAILED DESCRIPTION
OF THE MAIN PROBLEM AREAS IMPACT OF REGULATORY BURDEN SECTOR ANALYSIS BUSINESS ANALYSIS
1
2
3
4
Making a description of the sector Making a selection of the representative companies Conducting in-depth interviews with the executive and managementDetermining the financial traceable and tangible regulatory burden
Comparable companies assess the results of the business analysis. Are the results recognisable?
Tracing back the relevant legislation and procedures causing the unnecessary burden
Stakeholder analysis Making an analysis of
the financial administration and business operations
KAR methodiek handboek drukker_P35_ENG.pdf 1 07-04-15 16:58
37 Good preparation is
needed to ensure selection of the right model companies and identification of the relevant regulation Coordination with a feedback group is necessary to ensure broad support
3. STEP-BY-STEP PLAN
Step 1 – Sector analysis
Purpose
To prepare substantively for of the study and define its scope
Activities
1. The researchers first investigate which stakeholders play a role in the sector. They are interested in representatives of the business community, such as sector organisations, and representatives of government, including regulators, ministries and executive organisations.
2. The researchers compile an inventory of the regulations encountered by businesses in the sector. These include not just sector-specific regulations, but all relevant regulations. 3. They then examine the structure of the sector. They describe the different activities
carried out within the sector and the different types of businesses active in it. If certain companies carry out non-standard activities and therefore have different administrative obligations, they are classed as belonging to a subsector. The researchers then collect facts and figures for each subsector which give a picture of the structure and profile of that subsector. Examples include the number of companies in the sector and its subsectors, the turnover and profitability of the sector and how many people are employed in it.
4. The researchers select companies for the study. It is important to choose representative businesses from the different subsectors. To ensure the reliability of the results, a business analysis needs to be carried out at two or three companies in each subsector.
5. The researchers draw up an action plan. They agree this plan with the various stakeholders involved in the project.
A detailed description of the activities involved in the sector analysis can be found in chapter 3 of Part III of this Manual.
Results
At the end of Step 1 there is an action plan containing:
• A summary of the approach, principles and planning of the project.
• The procedure and approach of the study and the way in which the relevant stakeholders will remain engaged with the study.
• An overview of the relevant legislation and regulations for the types of business for which the researchers will perform a business analysis (including known problem areas).
• A substantiation of the identified sectors and subsectors and the selection of representative businesses (the Model Companies); these businesses will be studied anonymously and thus described in general terms.
39 Business analysis: an
overview of the financially traceable and perceived regulatory burden in a sector or subsector
Step 2 – Business analysis
Purpose
To obtain an inventory of the traceable financial and tangible problem areas in the ModelCompanies.
Activities
1. Analysis of the Model Companies. The researchers first look at the structure of the business: who performs which activities and which regulations do they encounter? This determines which employees can best be targeted for interviews.
2. Inventory of the traceable financial problem areas by analysing the financial administration and business operations. The researchers go through the entire accounting records with the company or with the accounts staff. They make an assessment for each cost centre to determine whether it is caused by legislation and regulations.
3. In-depth interviews with the company board and management. The researchers discuss with managers of all relevant departments which regulations apply (or applied) for their department and which costs ensue from this. They also discuss any specific points that emerged from the financial analysis with the interviewees.
4. Business analysis report. The researchers discuss a draft version of this report with the stakeholders involved in the study. The business analysis provides the substantiation for the final report.
A detailed description of the activities performed for the business analysis can be found in chapter 4 of Part III of this Manual.
The business analysis provides the substantiation for the final report
Results
At the end of Step 2 there is a business analysis for each subsector, containing as a minimum:
• A description of the procedure and principles.
• An anonymised description of the Model Companies studied. Anonymisation is important to guarantee the confidentiality of the data processed. It enables businesses to participate in the study in an open and honest way and to speak freely and without impediment on tangible problem areas. For each Model Company, the report looks at topics such as turnover, net profit, profit, market share, number of employees, main activities, number of establishments, area of operation, etc. As a further guarantee of anonymity, the researchers work with bandwidths.
• The regulatory burden as a percentage of operating costs over a period of five years. The report distinguishes between non-recurring and structural regulatory burden and describes the sources of the regulatory burden.
• The commercial impact of regulatory burden, expressed as a percentage of turnover and profitability.
• A description of the perceived regulatory burden that has come to light at the Model Companies. Where applicable, the report explains in more detail the relationship between the perceived regulatory burden and the traceable financial problem areas. A more detailed description of the structure of this report can be found in Annex 1 of Part III of this Manual.
Tips!
• In the interviews, use the overview of relevant regulations that was drawn up in the sector analysis. This avoids things being forgotten, both when going through the financial administration and during the interviews.
41 Comparable companies
assess the results of the business analysis.
Are the results recognisable? Is further detailing needed?
Step 3 – Impact of regulatory burden
Purpose
To verify and supplement the results of the business analysis based on experiences of comparable businesses.
Activities
1. The researchers organise work sessions with businesses from the sector being studied: at least one work session per subsector. The participating businesses are comparable in terms of organisational structure and business activities with the Model Companies for which a business analysis has been carried out. If the subsector is large, complex or diverse, it is useful to organise two or three work sessions for that subsector.
Prior to the work session, the participants receive information about the study and the purpose of the work session. They also receive an insight into the results of the business analysis for their subsector.
2. During the work sessions the researchers test the recognisability of the business analysis. Do the participating companies recognise the extent and origin of the regulatory burdens found? Do they experience a comparable (commercial) impact from them? The participants are employed in companies that are comparable with the Model Companies, and in principle face the same legal obligations. The testing during the work sessions guarantees that the identified burdens are broadly recognised within the sector.
3. During the work sessions, the researchers collaborate and expand on the unnecessary burden for the subsector studied. The work sessions are interactive; participants are challenged to contribute ideas and to discuss financially traceable and tangible problem areas.
4. Together with the stakeholders concerned, the researchers draw up a provisional ranking of problem areas.
Results
At the end of Step 3, there is a summary for each work session containing:
• An overview of the business analysis, with necessary detailing and elaboration.
• A list of the problem areas identified; the document makes explicit how these problem areas:
-Constrain the individual company within the sector.
-Constrain the entrepreneurial climate within the sector.
43 Detailed description of
the main problem areas
Step 4 – Description of problem areas
Purpose
To describe and detail the financially traceable and tangible problem areas.
Activities
1. The researchers analyse the results of the work sessions and clarify the financially traceable and tangible problem areas. At the start of the project it is not yet clear how many issues will come to light. And not all issues found have the same impact on businesses in the sector. The researchers provide a detailed description of the most important and most noticeable problem areas. The less important problem areas are placed in an annex to the report. The researchers do not apply any further prioritisation in these categories, because that is the subject of the public-private dialogue that is initiated.
2. The researchers describe the problem areas in more detail and provide an insight into their commercial impact: how does this unnecessary burden affect the business results and/or does it constrain the scope of the business to grow or innovate?
The legal basis of the unnecessary burden is given a prominent place in the description. This means that the problem areas can be traced back to the legislation and regulations that cause them. The researchers also perform a stakeholder analysis to determine which parties are affected by this burden.
3. Where necessary, the research bureau discusses the problem areas with policy officials or legal officers from the ministries concerned. This is done primarily to test the tangible problem areas against the legal basis and (legal) considerations underlying them. 4. The researchers draw up the final report and liaise on it with the stakeholders involved
in the study.
The final report is the starting point for further discussion aimed at reducing the regulatory burden in the sector Results
At the end of Step 4 there is a final report containing:
• A description of the methods used and principles applied.
• A description of the sector in the Netherlands.
• A summary of the business analysis, with a description of the commercial impact of both financially traceable and tangible problem areas.
• An overview of the financially traceable and tangible problem areas, with an insight into the regulations causing them.
• The main conclusions and recommendations of the study.
A detailed description of the structure of this report may be found in Annex 2 to Part III of this Manual.
Tips!
• Ensure that the problem ares that cause the unnecessary burden remain recognisable when drafting the final report. It takes a lot of time to describe problem areas properly and in a detailed way. It is therefore important to liaise with the stakeholders involved in the study on the identified problem areas. This liaison is necessary to obtain a clear description of the problem areas and to determine which should be tackled first.
45 The business analysis
describes the unnecessary burden experienced by businesses within the sector
What is the impact of each problem? Which regulations cause this?
4. REPORTS
The business analysis and the final report
The research bureau records the results of the CAR study in two separate reports.
The Business Analysis
This report sets out the findings from Step 2 of the study. The business analysis discusses the outcomes of the financial analysis of the Model Companies, the quantified regulatory burden, the perceived regulatory burden, the regulations responsible for that burden and the impact of the regulatory burden on the economic strength of the Model Companies. Annex 1 contains an annotated table of contents for the business analysis. The results of all CAR projects are presented in this format, making them uniform and therefore comparable.
The final Report
This report is the culmination of Step 4, the final step in the project. The final report discusses the unnecessary burden within the sector. It presents a clear description of the impact of each problem area, and of the legislation and regulations on which it is based. At the same time as the reports, the research bureau also presents the model used in calculating the regulatory burden. This model can also be used to make a quantitative assessment of the impact of future developments within the sector.
An annotated table of contents for the final report may be found in Annex 2.
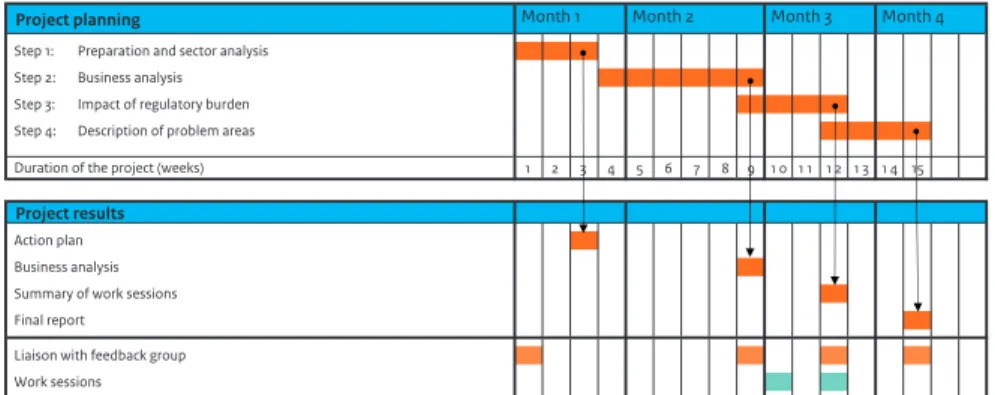
47 The planning timeline
provides for a total throughput time of four months
5. ORGANISATION
Planning
Figure 5 presents one possible planning timeline for a CAR study. The timeline provides for an average throughput time of four months.
Figure 5. Timeline of a CAR study
Kopie van UVP KAR v0.1 Offerte planning
Project planning Month 1 Month 2 Month 3 Month 4
Step 1: Preparation and sector analysis Step 2: Business analysis Step 3: Impact of regulatory burden Step 4: Description of problem areas
Duration of the project (weeks) 1 2 3 4 5 6 7 8 9 1 0 1 1 1 2 1 3 1 4 15
Project results
Action plan Business analysis Summary of work sessions Final report
Liaison with feedback group Work sessions
23-1-2015 Pagina 1 van 1
The CAR methodology requires an experienced research team with broad expertise
The time investment for Model Companies must be kept as short as possible
Organisation
The importance of a multidisciplinary team
To ensure the quality of the CAR study, a multidisciplinary team is essential. Such a team looks at the Model Companies through a variety of lenses – not just the lens of an accountant or business economist, but also the lens of the legal expert or entrepreneur.
The researchers must have in-depth knowledge of the legal obligations that apply for the Model Companies. They must be able to investigate which legislation and regulations apply and to what extent the obligations apply to the businesses in their study. The research team’s tasks include carefully reviewing, assessing and analysing the accounting records and business operations at the level of individual cost centres. If necessary, they must also assess invoices and other source documents.
It is also important that the research team has sufficient legal knowledge and expertise to trace the identified burden back to the legislation and regulations that causes it.
Core competences and qualities
As a minimum, the research team must possess the following qualities
• Knowledge of business processes;
• Business expertise;
• Legal knowledge of the relevant regulations;
• Strong analytical skills and substantive drive;
• Knowledge and experience of research methods and analyses;
• Ability to work on a project basis;
• Excellent written and spoken skills in the Dutch language;
• Communication skills and flair in giving presentations;
• Wide experience in the use of Excel, Word and PowerPoint (or comparable programs). These core competences and qualities need not of course all be concentrated in a single researcher. The important thing is that the research team contains sufficient breadth of knowledge and expertise to carry out a project using the CAR methodology at a sufficiently high level of quality.
49 Process support by
feedback group creates support among stakeholders
Regular consultation guarantees the quality of the study
What is the burden for the Model Company?
The CAR methodology ensures that the study takes as little time as possible for the Model Companies. The time needed depends greatly on the company’s structure and internal organisation. Each department faces specific obligations, so it is necessary to speak to a representative of each department. In a group structure, the research team can plan an interview with each of the individual group companies in order to obtain a complete picture of the burden. In practice, these activities are spread among several people. The procedure is as follows:
1. Initial contact. The research bureau contacts the managing director of the company by telephone. The managing director receives information on the project and its purpose. At the same time, they make an appointment for a first meeting. By way of preparation, the research bureau sends out explanatory notes by email.
2. Initial interview. The researcher starts by introducing the project and the discussion. The first part of the discussion focuses on the Model Company and its business costs. The second part focuses on identifying the regulatory costs, based on an overview. The two sides go through the overview and provide additional information where possible. They compile an inventory of information that is missing and still needs to be provided. 3. Information-gathering. The researchers look up the identified cost components in
the accounting records. They do this on the basis of the agreements made, and often in consultation with the managing director and/or the person responsible for the administration. The researchers also hold interviews to identify the tangible problem areas.
4. Discussion of the results and conclusion. The research team discusses the specific cost calculation and the relationship with the key figures with the relevant employees of the Model Company. During the discussion, it is often necessary to adjust some of the figures.
Liaison with stakeholders
To increase the support for the project results, the research team will discuss them with the stakeholders, for example by creating a feedback group. This feedback group systematically supervises the study and assesses the results. In phase 1 of the project, the research team discusses the planning timeline and procedure with the feedback group. The (draft) results are discussed in later phases.
Possible members of the feedback group include the following:
• Responsible ministries;
• Regulators and other executive organisations;
• Employers’ organisations;
• Employees’ organisations;
• Sector organisations.
Project coordination and consultation
To ensure good implementation of the project, there should be regular consultation with the different stakeholders. The consultation moments are set out in the model project planning schedule (figure 5). The main consultation moments are set out in more detail in the following table.
51
Table 1. Contact and consultation moments
Week
Type of contact
Topics
1 Initial discussion with the client • Discussion of the principles, procedure and timeline for
the project.
• Discussion of the draft action plan so that it can be sent to the supervisory committee.
3 First meeting of feedback group • Coordination of the project approach based on the draft
action plan.
• Selection of the Model Companies for the business analysis.
5-6 First interviews with
management of the Model Company
• Review of the financial administration and accounting records. • Inventory of financially traceable regulatory burden.
• Inventory of perceived regulatory burden. • Discussion of missing information.
7-8 Second interviews with the
management of the Model Company
• Coordination of results from the financial analyses.
• Coordination of the most recent missing information.
8 Progress meeting with
the client
• Discussion of the draft business analysis report.
9 Second meeting of
feedback group
• Discussion and adoption of the business analysis report.
10 + 12 Work session with comparable
companies
• Verification of results of the business analysis.
• Supplementing identified problem areas.
12 Third meeting of
feedback group
• Discussion of the results of the work sessions
14 Progress meeting with
the client
• Discussion of the draft final report.
15 Fourth meeting of
feedback group
• Presentation of the results from the final report. • Discussion and adoption of the final report.
Part III
Methods and Techniques
CAR methodology
A method for identifying regulatory burden within a sector
55
PART III: CONTENTS
1. Introduction 57 Explanation of key components of CAR methodology
2. CAR measurement model 59 Building the CAR measurement model
3. Sector analysis 61 Structure of the sector
4. Business analysis 67 The traceable financial problem areas
75 The tangible problem areas
Guide
In this third part of the Manual you will find a detailed description of the main components of the CAR methodology. Which components make up the sector and business analysis? How can you apply them? This section is of particular interest to those applying the CAR methodology in practice, for example independent research bureaus. And of course, for you as an individual researcher.
57 Part III of the Manual gives
a detailed description of the steps involved in the CAR methodology
1. INTRODUCTION
Explanation of key components of CAR methodology
This part of the CAR Methodology Manual describes the various methods and techniques used in order to gather, process and analyse data. It deals specifically with the following components:
• The measurement model
In this section you can read which measurement model is suitable for identifying the regulatory burden.
• The sector analysis
The sector analysis enables you to map out the structure of the sector, which specific regulations apply for companies within it and how the sector can be subdivided into different subsectors.
• The business analysis: traceable financial problem areas
Here you compile an inventory of the problem areas that emerge from the financial administration of the Model Companies and how great the regulatory burden is.
• The business analysis: tangible problem areas
Here you identify which other unnecessary burden professionals within the sector experience as a result of legislation and regulations. Although this regulatory burden cannot be identified in the financial administration, it does pose an obstacle to professionals in their day-to-day business practice.
If you are looking for more general information on the working methods, organisation and planning, read Part II, Procedure.
In the following chapters you will find a detailed description of the steps taken by your research team order to bring a project based on the CAR methodology to a successful conclusion. Chapter 2 describes a measurement model, with instructions for research bureaus on how to populate it. The illustrations give an impression of a measurement model that researchers can use to identify the regulatory burden.
59
2. MEASUREMENT MODEL
Structure of CAR measurement model
To gauge the impact of regulatory burden on business costs, you need a measurement model that is able to process all research results from each phase of the study. The measurement model must be able to perform calculations automatically and must be able to translate the research results into clear report figures. This guarantees a uniform method of data recording and calculation of the results, so that measurements from different studies can be compared with each other. The screenshots in this chapter give an impression of a well-structured measurement model.
The tab sheets
The measurement model comprises six tab sheets: one explanatory sheet and five worksheets:
• Explanatory sheet
This tab sheet explains the structure and operation of the measurement model.
• I. Sector analysis
This tab sheet deals with the structure of the sector. The researcher enters data on subsectors, number of companies per sector/subsector, average turnover, total turnover and number of persons employed.
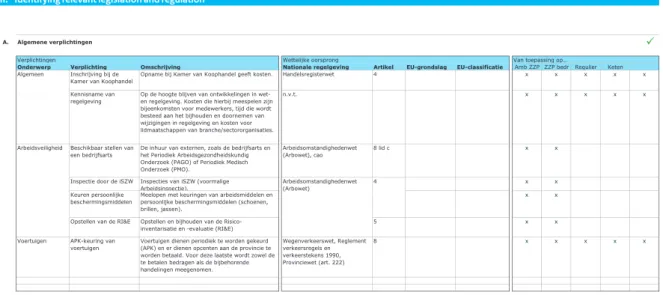
• II. Identification of relevant regulations
On this tab sheet the researcher enters information on the general regulations that apply to the sector, and the sector-specific obligations.
• III. General business information
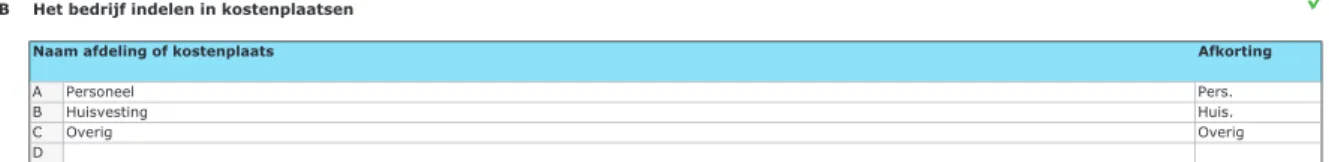
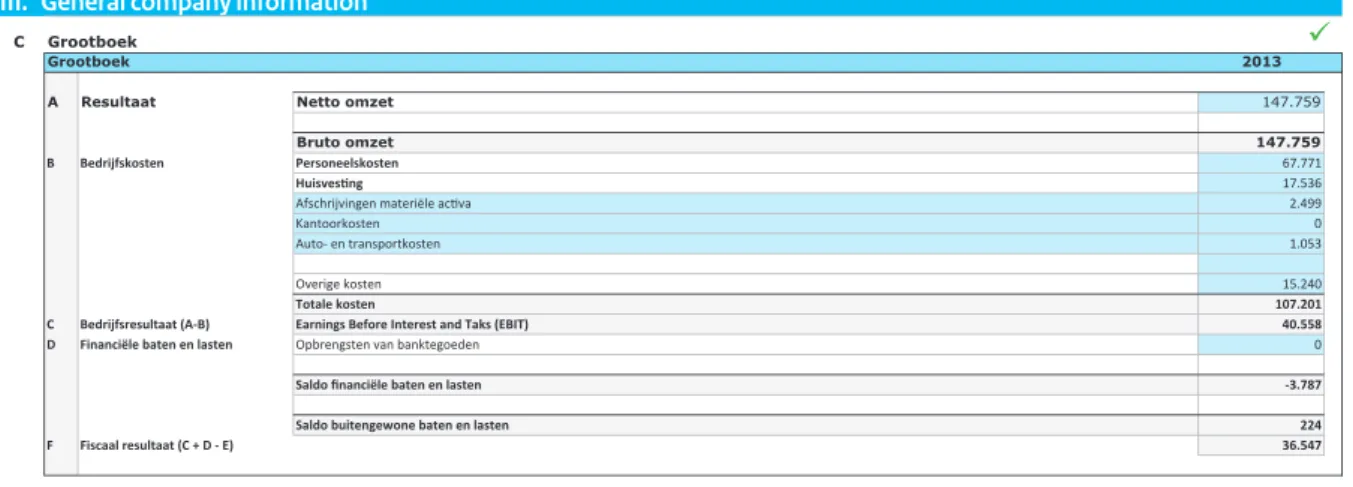
Here the researcher enters company-specific information: cost centre categories, applicable hourly rates and financial data drawn from the accounting records.
• IV. Quantification of regulatory burden
Here the researcher enters company-specific information to calculate the financially traceable regulatory burden.
• V. Reporting
Here the researcher can generate figures and tables based on the data entered. These can be used for presenting the research results in the reports (Business Analysis and Final Report).
61
3. SECTOR ANALYSIS
The sector analysis actually consists of two parts. In the first part you examine how the sector is structured, and in the second part you identify which regulations apply to the sector.
Structure of the sector
The CAR study should provide as broad a picture as possible of the different cost structures and the legislation and regulations that apply in the sector concerned. It is quite possible that the sector contains different types of businesses, which because of their specific products or services encounter different specific legislation and regulations. This can lead to a varied regulatory burden within the sector, as regards both the financially traceable and tangible problem areas. In such a case, the sector is divided into subsectors.
It is essential for the quality of the study that you identify clearly how the sector is structured. Key points are the classification and size of subsectors, the average business size and the average turnover per business. For the classification of the sector you should adhere as closely as possible to the Standard Industrial Classifications (SBI) as produced by Statistics Netherlands (CBS). Once you have analysed the structure of the sector, you can determine which companies are representative for the sector. Finally, you select representative organisations that are suitable for analysis using the CAR methodology.
To determine whether the sector contains subsectors, you identify the composition of the sector using a sector scan:
Step 1. Collecting relevant information
There are several public sources that you can consult for relevant data, such as the Statline digital database containing statistical information from CBS, and the website Ondernemersplein.nl . The Chamber of Commerce posts information on this website about the number of establishments, the number of new businesses and the number of bankruptcies in a range of sectors.
If possible you should supplement this information with data that you obtain from the sector. Sector organisations regularly commission studies to obtain specific sector information. These studies cover commercial aspects but also aspects relating to labour, staffing, etc. The outcomes of such studies can sometimes be found on the websites of the sector organisations. Otherwise, you can obtain sector-specific information via your contacts with the stakeholders.
2 Ondernemersplein is an initiative by the Chamber of Commerce, Answers for Business, Netherlands Enterprise
Agency, the Dutch Tax Administration, RDW and CBS.
Step 2. Processing the data collected
The information collected to is used identify how the sector is structured. Important elements here are:
• the different business types;
• the number of companies of each type;
• the average turnover per business type;
• the total turnover per business type;
• the number of employees per business type.
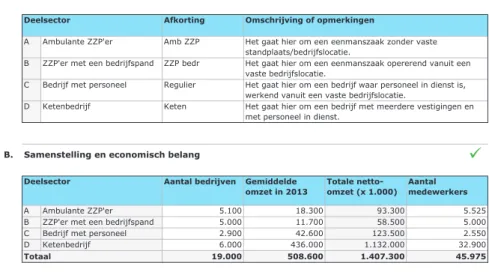
How to enter the data
Enter the information on tab sheet I of the measurement model, ‘Sector analysis’. Figure 6 shows a screenshot of a completed tab sheet. The data entered are fictitious.
Figure 6. Tab sheet I: Sector analysis
In the business analysis you provide a written explanation of the data from the table. You give a brief description of the main business activities for each business type, together with any other factors that distinguish the different types of business from each other. If necessary, you can also add information on key commercial or political developments.
I. Sector analysis
A. Opbouw van de sector bepalen
Deelsector Afkorting Omschrijving of opmerkingen
A Ambulante ZZP'er Amb ZZP
B ZZP'er met een bedrijfspand ZZP bedr
C Bedrijf met personeel Regulier
D Ketenbedrijf Keten
B. Samenstelling en economisch belang
Deelsector Aantal bedrijven Gemiddelde
omzet in 2013 Totale netto-omzet (x 1.000) Aantal medewerkers
A Ambulante ZZP'er 5.100 18.300 93.300 5.525
B ZZP'er met een bedrijfspand 5.000 11.700 58.500 5.000
C Bedrijf met personeel 2.900 42.600 123.500 2.550
D Ketenbedrijf 6.000 436.000 1.132.000 32.900
Totaal 19.000 508.600 1.407.300 45.975
Binnen sectoren kunnen vaak deelsectoren worden onderscheiden. Geef in de onderstaande tabel aan in welke deelsectoren deze sector uiteen valt. Geef bij elke deelsector een korte omschrijving van het betreffende segment. U dient tenminste één deelsector aan te maken.
Het gaat hier om een eenmanszaak zonder vaste standplaats/bedrijfslocatie.
Het gaat hier om een eenmanszaak opererend vanuit een vaste bedrijfslocatie.
Het gaat hier om een bedrijf waar personeel in dienst is, werkend vanuit een vaste bedrijfslocatie.
Het gaat hier om een bedrijf met meerdere vestigingen en met personeel in dienst.
63
The result of this sector scan forms part of the Business Analysis report. See Annex I, Annotated table of contents of Business Analysis report.
Step 3. Selecting the Model Companies
Based on the outcomes of the sector scan, you select the Model Companies you wish to approach to take part in the study. The ultimate selection criteria differ from one CAR project to another. You compile these criteria together with the client and possibly the members of the supervisory committee. It is important that, as a minimum, you identify all the problem areas within the sector. You should therefore selected at least one Model Company per sector.
Do not choose companies that have just completed a merger or major reorganisation. This is particularly important with a view to keeping the throughput time of the study within bounds.
A Model Company must as a minimum meet the following criteria:
1. The company is representative
It must be a company that complies with the regulations and makes best effort to do so. The company must be able to serve as a representative example for the other companies in terms of its activities and structure.
2. The company is comparable
The companies in the study can be compared with each other in terms of business and business operations. Within reason, the methodology can cope with differences in size, because the regulatory burden is expressed as a percentage of the business costs.
3. The business operations of the company are clear
For larger companies this means that it must be clear at the level of the parent
company how the costs of the operating companies are made up, so that you can study them in a targeted way.