This is an Accepted Manuscript, which has been through the Royal Society of Chemistry peer review process and has been accepted for publication.
Accepted Manuscripts are published online shortly after
acceptance, before technical editing, formatting and proof reading. Using this free service, authors can make their results available to the community, in citable form, before we publish the edited article. We will replace this Accepted Manuscript with the edited and formatted Advance Article as soon as it is available.
You can find more information about Accepted Manuscripts in the
Information for Authors.
Please note that technical editing may introduce minor changes to the text and/or graphics, which may alter content. The journal’s standard Terms & Conditions and the Ethical guidelines still apply. In no event shall the Royal Society of Chemistry be held responsible for any errors or omissions in this Accepted Manuscript or any consequences arising from the use of any information it contains.
Accepted Manuscript
Analytical
Methods
Highly-sensitive electrochemical detection of bisphenol A based on
the cooperative enhancement effect of graphene-Ni(OH)
2hybrid and
hexadecyltrimethylammonium bromide
1Rui Wang a
, Kangbing Wu b, Can Wu b*
a
Wuhan Second Ship Design and Research Institude, Wuhan 430205, China
b School of Chemistry and Chemical Engineering, Huazhong University of Science
and Technology, Wuhan 430074, China
Graphene sheets (GS) are first easily prepared via one-step solvent exfoliation of graphite powder in N-methyl-2-pyrrolidone (NMP) and then hybridizes with Ni(OH)2
microparticles. The resulting insoluble GS-Ni(OH)2 hybrid is readily dispersed in
water in the presence of surfactant hexadecyltrimethylammonium bromide (CTAB). Compared with the bare glassy carbon electrode (GCE), CTAB, pristine GS, Ni(OH)2,
and GS-Ni(OH)2 composite modified GCEs shows enhanced oxidation signal for
bisphenol A (BPA). Based on the cooperative enhancement effect of solvent-exfoliated graphene-Ni(OH)2 hybrid and CTAB, a novel electrochemical
sensor with high sensitivity is developed for the detection of BPA. Under the optimal conditions, the detection limit (S/N =3) is estimated to be as low as 5.0 nM. In the end,
3 4 5 6 7 8 9 10 11 12 13 14 15 16 17 18 19 20 21 22 23 24 25 26 27 28 29 30 31 32 33 34 35 36 37 38 39 40 41 42 43 44 45 46 47 48 49 50 51 52 53 54 55 56 57
Analytical
Methods
Accepted
Manuscript
the fabricated electrochemical sensor is successfully used to determine the content of BPA in real water samples.
Keywords:
Graphene; Ni(OH)2; Bisphenol A; Electrochemical sensorIntroduction
Bisphenol A (BPA, 2,2-bis (4-hydroxyphenyl) propane) is a common industrial monomer compound for the synthesis of polycarbonate, polystyrene resins, and epoxy resin, which are widely applied to produce daily plastic products. More and more studies show that BPA is a kind of endocrine disruptor chemical that may potentially interfere the endocrine system of both the wildlife and human. Intake of low dose of BPA may induce cancer,1 decrease semen quality,2 reduce immune function,3 lead to learning deficits,4 and impair reproduction.5 Due to the daily use of plastic products such as plastic bag, plastic bottle, plastic toy and so on, humans may indirectly ingest trace amount of BPA. So it is of great importance to develop a fast and sensitive detection platform for monitoring the content of BPA.
Graphene, a two-dimensional and one-atom thick carbon sheet, has received considerable attention due to its unique physical properties.6-8 Especially in these years, multifarious graphene-based electrochemical sensors with low detection limit, high sensitivity and reduced resistance have emerged.9-13 However, among these studies, graphene was predominantly obtained via chemical oxidation exfoliation of graphite according to modified Hummer’s methods, which involve the consumption of
3 4 5 6 7 8 9 10 11 12 13 14 15 16 17 18 19 20 21 22 23 24 25 26 27 28 29 30 31 32 33 34 35 36 37 38 39 40 41 42 43 44 45 46 47 48 49 50 51 52 53 54 55 56 57
Analytical
Methods
Accepted
Manuscript
a large amount of strong oxidizing reagents, complicated and rigorous treatments, and irreversible structure defects. Therefore, it is necessary to prepare graphene through a simple, eco-friendly, and mild method with high quality. Recently, one-step solvent sonication exfoliation method has been proved to be feasible for preparation of pristine graphene.14,15 However, the solvent exfoliated graphene-based electrochemical is still very limited.
On the other hand, nano metal and metal oxide, such as Au,16 Ag,17 CuO,18 Fe2O3,19 Ni(OH)2,20 TiO221 and so on, are frequently used to enhance the
electrochemical performance of graphene. In these graphene-based hybrid materials, Ni(OH)2 has gained considerable attention due to its high stability, large proton
diffusion coefficient22 and strong catalytic reaction activity23.
In this work, graphene sheets (GS) are easily prepared via one-step solvent exfoliation of graphite powder in N-methyl-2-pyrrolidone (NMP). The Ni(OH)2
microparticles are synthesized by simple homogeneous precipitation method. Considering the insolubility of GS and Ni(OH)2, CTAB, a common cationic surfactant,
is selected as the dispersing agent. After then, GS-Ni(OH)2 hybrid is used to modify
the surface of glassy carbon electrode (GCE). The electrochemical behaviors of BPA on the surface of bare GCE, CTAB-modified GCE (CTAB/GCE), Ni(OH)2-modified
GCE (Ni(OH)2/GCE), GS-modified GCE (GS/GCE), and GS-Ni(OH)2
composite-modified GCE (GS-Ni(OH)2/GCE) are systematically studied. CTAB/GCE,
Ni(OH)2/GCE and GS/GCE shows an obvious signal enhancement responding to BPA
oxidation compared with bare GCE, and the oxidation peak current is further
3 4 5 6 7 8 9 10 11 12 13 14 15 16 17 18 19 20 21 22 23 24 25 26 27 28 29 30 31 32 33 34 35 36 37 38 39 40 41 42 43 44 45 46 47 48 49 50 51 52 53 54 55 56 57
Analytical
Methods
Accepted
Manuscript
increased on GS-Ni(OH)2/GCE. Such remarkable enhancement effect for BPA
oxidation may be attributed to the cooperative enhancement effect of GS-Ni(OH)2
hybrid and CTAB, which leads to the notably improved accumulation efficiency of BPA. Therefore, a novel and simple electrochemical sensing platform is successfully fabricated for BPA detection. Compared with the reported electrochemical methods for BPA detection, this newly fabricated sensing platform for BPA exhibits higher sensitivity, as confirmed from Table 1.
Experimental Section
Reagents
All chemicals are of analytical grade and used as received. BPA (Sigma) is dissolved into ethanol to prepare 0.01 M standard solution. Graphite powder (spectral pure), NMP, Ni(NO3)2, NH3⋅H2O (28 wt%), CTAB are purchased from Sinopharm Chemical
Reagent Company (Shanghai, China). Ultrapure water (18.2 MΩ) is obtained from a Milli-Q water purification system and used throughout.
Instruments
Electrochemical measurements are performed on a CHI 660D electrochemical workstation (Chenhua Instrument, Shanghai, China). The working electrode is a glassy carbon electrode (GCE), the reference electrode is a calomel electrode with saturated KCl, and the counter electrode is a Pt wire. Scanning electron microscopy (SEM) is performed with a Nova NanoSEM450 microscope (FEI Company,
3 4 5 6 7 8 9 10 11 12 13 14 15 16 17 18 19 20 21 22 23 24 25 26 27 28 29 30 31 32 33 34 35 36 37 38 39 40 41 42 43 44 45 46 47 48 49 50 51 52 53 54 55 56 57
Analytical
Methods
Accepted
Manuscript
G220 microscope (FEI Company, Netherlands). X-ray diffraction (XRD) pattern is conducted using a X’Pert PRO diffractometer (Panalytical Company, Netherlands).
Preparation of GS and GS-Ni(OH)2 hybrid
GS are easily prepared via one-step ultrasonic exfoliation of graphite powder in NMP solvent. In a typical preparation, 5.0 g graphite powder is added into 500.0 mL NMP, and then sonicates in a KQ-100B ultrasonicator (frequency: 40 kHz, power: 100 W; Kunshan Ultrasonic Instrument Co., Ltd, China) for 48 h. The resulting suspension is denoted as graphite@48 h. After that, the suspension is centrifugated, washed with ultrapure water and ethanol several times, and finally dried in vacuum at 60 oC for 5 h.
Ni(OH)2 microparticles are prepared by simple homogeneous precipitation
method. Firstly, 23.2 g Ni(NO3)2 is dissolved in 20 mL distilled water, then the
Ni(NO3)2 solution is added into a beaker containing 40 mL ammonia solution (28
wt%) under magnetic stirring drop by drop at room temperature. After that, the mixed solution is transferred to a water bath with continuous magnetic stirring at 70 oC for 18 h. Finally, after aging the product in mother liquor for 6 h, the light green precipitate is collected by centrifugation, washed with ultrapure water several times, and dried at 100 oC in vacuum for 8 h.
For the preparation of GS-Ni(OH)2 hybrid, 10.0 mg GS and 10.0 mg Ni(OH)2
are first exactly weighed, and then together added in 5 mL, 1 mg/mL CTAB solution.
3 4 5 6 7 8 9 10 11 12 13 14 15 16 17 18 19 20 21 22 23 24 25 26 27 28 29 30 31 32 33 34 35 36 37 38 39 40 41 42 43 44 45 46 47 48 49 50 51 52 53 54 55 56 57
Analytical
Methods
Accepted
Manuscript
After 30-min ultrasonic treatment, a stable black suspension with concentration of 2 mg/mL GS-Ni(OH)2 composite is obtained.
Fabrication of modified GCEs
GCE with diameter of 3 mm is polished with 0.05 µm alumina slurry, and then sonicated in ultrapure water to give a clean surface. After being dried, a certain amount of GS-Ni(OH)2 suspension is coated on GCE surface, and then dried under an
infrared lamp in air. For the comparison, GS and Ni(OH)2 are also dispersed in CTAB
solution and used to modify the GCE according to the above procedure. The CTAB-modified GCE is similarly prepared using 1 mg/mL CTAB solution.
Analytical procedure
0.1 M phosphate buffer solution (pH 7.5) is used as the supporting electrolyte. After accumulation at 0.2 V under stirring for 180 s, differential pulse voltammetry (DPV) curves are recorded by applying a positive-going scan from 0.2 to 0.8 V, and the oxidation peak current at 0.49 V is measured. The pulse amplitude was 50 mV, the step increment was 4 mV, the pulse width was 40 ms, the sampling width is 16.7 ms and the scan rate is 40 mV/s.
Results and discussion
Morphology and structure characterization
3 4 5 6 7 8 9 10 11 12 13 14 15 16 17 18 19 20 21 22 23 24 25 26 27 28 29 30 31 32 33 34 35 36 37 38 39 40 41 42 43 44 45 46 47 48 49 50 51 52 53 54 55 56 57
Analytical
Methods
Accepted
Manuscript
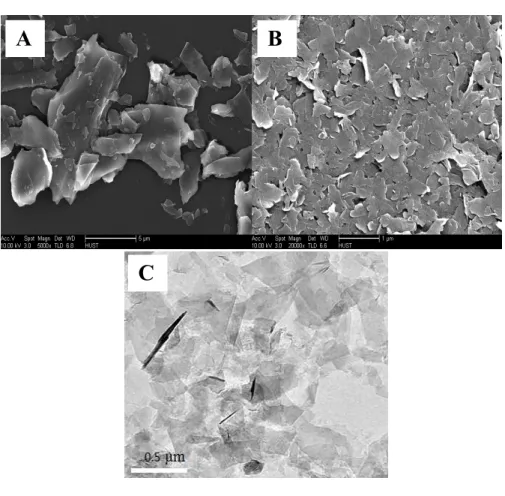
In order to verify the bulk graphite is effectively exfoliated into graphene nanoflakes, SEM and TEM characterization of bulk graphite and graphite@48 h are conducted. As shown in Fig. 1A, the pristine graphite is consisted of large number of bulk particles on a micron meter scale. After applying graphene suspension that ultrasonically exfoliated for 48 h in NMP, plenty of graphene nanoflakes are observed, indicating graphite is effectively exfoliated (Fig. 1B). In addition, many transparent nanosheets can be seen from the TEM image of graphite@48 h (Fig. 1C). Apparently, graphene has been successfully obtained through the ultrasonic exfoliation of graphite powder in NMP.
Raman spectra measurements and XRD tests are also conducted to provide further insights into the structural differences of graphite and graphite@48 h. As displayed in Fig. 2A, three peaks at 1350 cm-1, 1580 cm-1 and 2700 cm-1 are easily observed with the graphite powder and graphite@48 h, which can be attributed to the natural D-band, G-band and 2D-band of carbon material, respectively. D-band is assigned to the disorder-related peak, which is due to the existence of defects in basal plane and edge of carbon material.34,35 The peak intensity ratio of ID/IG is often used
to evaluate the surface defect level of carbon material. Obviously, the D-band intensities of graphite@48 h is significantly enhanced relative to pristine graphite, demonstrating a highly-effective exfoliation of bulk graphite and the generation of graphene. Moreover, for graphite@48 h, the intensity of the characteristic diffraction peak (002) of carbon material decreases greatly compared with pristine graphite, which suggests the wide-range periodicity associated with the stacking of graphene in
3 4 5 6 7 8 9 10 11 12 13 14 15 16 17 18 19 20 21 22 23 24 25 26 27 28 29 30 31 32 33 34 35 36 37 38 39 40 41 42 43 44 45 46 47 48 49 50 51 52 53 54 55 56 57
Analytical
Methods
Accepted
Manuscript
graphite has been destroyed by ultrasound exfoliation. So it can be concluded that graphene is obtained via one-step solvent exfoliation of graphite powder in NMP and this result has also been confirmed in our previous work.36,37
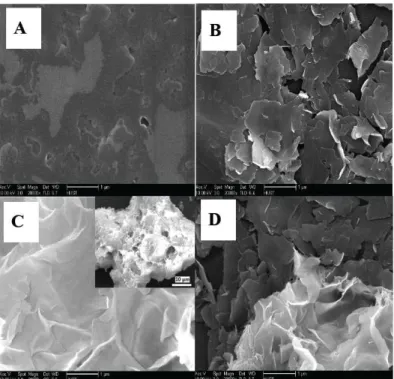
The surface morphology of different electrodes are characterized using SEM, and the results are shown in Fig. 3. As seen in Fig. 3A, a thin film is formed on the surface of CTAB-modified GCE. After modification with GS (B), the GCE surface is covered by a large number of nanosheets. The nanosheets indicates the bulk graphite powder is effectively exfoliated to graphene. On the surface of Ni(OH)2/GCE (C), corrugated
appearance is observed, indicating high roughness of Ni(OH)2. Inset in Fig. C is the
low magnification of SEM image of Ni(OH)2, it is clear that the obtained Ni(OH)2
samples are composed of numerous of corrugated structure with micron-scale. In addition, the wrinkled structure is clearly found on the surface of graphene-Ni(OH)2
composite (D), suggesting the graphene nanosheets are successfully hybridized with Ni(OH)2. From the comparison, it is apparent that the GS-Ni(OH)2 hybrid owns larger
surface roughness and three-dimensional structure.
Furthermore, the crystal structure and the phase purity of the as-synthesized Ni(OH)2 is examined using XRD. As shown in Fig. 4, characteristic diffraction peaks
of (003), (006), (101), (015), (018), (110) and (113) can be readily indexed as the α-Ni(OH)2 structure (JCPDS No. 38-0715).
38
In addition, no diffraction peaks from impurities could be founded from the XRD image of Ni(OH)2, indicating the high
purity of the resulting sample.
3 4 5 6 7 8 9 10 11 12 13 14 15 16 17 18 19 20 21 22 23 24 25 26 27 28 29 30 31 32 33 34 35 36 37 38 39 40 41 42 43 44 45 46 47 48 49 50 51 52 53 54 55 56 57
Analytical
Methods
Accepted
Manuscript
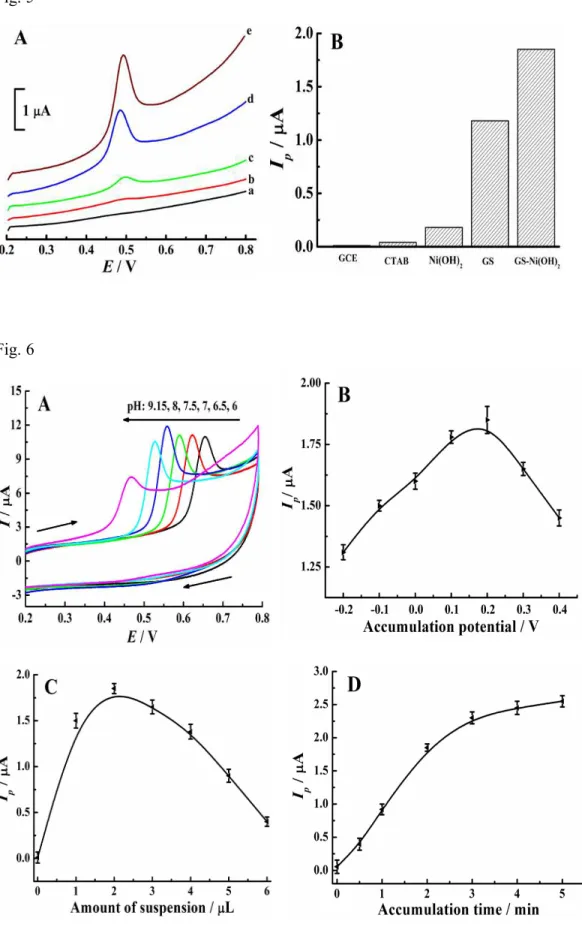
Cooperative enhancement effect of GS-Ni(OH)2 and CTAB for BPA response Fig. 5A shows the DPV curves of 0.5 µM BPA at different electrodes and Fig. 5B illustrates the corresponding variation of oxidation peak current. A negligible oxidation peak is observed at bare GCE (a), indicating poor accumulation ability of bare GCE. When using CTAB/GCE (b), the oxidation signal of BPA at 0.49 V can be seen, suggesting CTAB is conductive to the detection of BPA. This declares that surfactant can also be electrocatalytic active.39 The oxidation signal further increases at Ni(OH)2/GCE (curve c), suggesting its high electrochemical activity toward the
oxidation of BPA. This enhanced oxidation signal may be attributed to the rough surface of Ni(OH)2. It is noticed that the oxidation peak current of BPA increases
greatly on GS/GCE (curve d), indicating the prepared GS displays strong catalytic activity on BPA oxidation. Interestingly, GS-Ni(OH)2 hybrid film shows the highest
oxidation current (curve e). In conclusion, the arresting signal amplification may be due to the cooperative enhancement effect of GS-Ni(OH)2 hybrid and CTAB, which
leads to the remarkably increased accumulation efficiency for BPA.
Detection of BPA
Fig. 6A shows the effect of electrolyte pH on the current of 100 µM BPA on GS-Ni(OH)2/GCE. Different pH values containing 0.1 M phosphate buffer solution
with pH of 6, 6.5, 7, 7.5, 8 and 9.15 are tested using cyclic voltammetry (CV) with scan rate of 100 mV/s. As seen in Fig. 6A, only an oxidation peak is observed during the cyclic sweep from 0.2 to 0.8 V, revealing the oxidation of BPA on GS-Ni(OH)2
3 4 5 6 7 8 9 10 11 12 13 14 15 16 17 18 19 20 21 22 23 24 25 26 27 28 29 30 31 32 33 34 35 36 37 38 39 40 41 42 43 44 45 46 47 48 49 50 51 52 53 54 55 56 57
Analytical
Methods
Accepted
Manuscript
hybrid film is totally irreversible. In addition, the oxidation peak current of BPA increases gradually with the increase of the pH from 6 to 7.5. When further improving pH value to 9.15, the oxidation signal decreases gradually. Thus, 0.1 M phosphate buffer solution solution with pH of 7.5 is selected for BPA detection in the following study.
The effect of the accumulation potential on the oxidation signal of 0.5 µM BPA is studied in the range from -0.2 V to 0.4 V using DPV, and the results are shown in Fig. 6B. When the accumulation potential shifts toward positive from -0.2 V to 0.2 V, the oxidation peak current of BPA increases greatly. When further moving the potential to 0.4 V, the peak current of BPAstarts to decrease gradually. So 0.2 V is selected as the optimum accumulation potential for further measurements.
Fig. 6C shows the dependence of the oxidation signal of 0.5 µM BPA on the amount of graphene suspension. As illustrated in Fig. 6C, the oxidation peak current increases remarkably with the volume of graphene suspension over the range from 0 to 2 µL, indicating an improved enhancement effect. When further extending the volume to 5 µL, the oxidation signal decreases remarkably, this may be attributed to the increase of nonconducting surfactant and Ni(OH)2 hinders the electron transfer.
For the highest sensitivity, 2 µL graphene suspension is used.
The effect of the accumulation time on the oxidation peak current of 0.5 µM BPA is studied under the optimized conditions described above. As can be seen from Fig. 6D, the oxidation peak current of BPA increases linearly with extending the accumulation time in the range of 0 to 180 s, this phenomenon suggests that
3 4 5 6 7 8 9 10 11 12 13 14 15 16 17 18 19 20 21 22 23 24 25 26 27 28 29 30 31 32 33 34 35 36 37 38 39 40 41 42 43 44 45 46 47 48 49 50 51 52 53 54 55 56 57
Analytical
Methods
Accepted
Manuscript
accumulation is rather efficient to improve the detection sensitivity. However, when further prolonging the accumulation time to 300 s, the increasing tendency of the oxidation current is not so obvious, suggesting the adsorption of BPA on the electrode surface tends to a limit value. In order to guarantee the detection sensitivity while keeping high detection efficiency of the sensor, an accumulation time of 180 s is chosen.
In this work, we find that the GS-Ni(OH)2-modified GCE is unqualified for the
successive measurements because the oxidation peak currents of BPA increases continuously. Thus, it is just employed for the single measurement. The reproducibility between eleven GS-Ni(OH)2 modified GCEs is investigated based on
the oxidation signal of 0.5 µM BPA. Each electrode undergoes one measurement and the resulting value of relative standard deviation (RSD) is 4.5%, suggesting excellent fabrication reproducibility and good detection precision.
The potential interferents are also studied for thedetection of BPA. Under the optimized conditions, the oxidation peak current of 0.5 µM BPA is measured after adding different concentrations of interferents, the interferents are added individually and the peak current change is then checked. It is found that 1000-fold amounts of Ca2+, Mg2+, K+, Cl-, SO42-, NO3-, CO32-, 80-fold amounts of o-nitrophenol,
m-nitrophenol, p-nitrophenol, phenol, catechol, hydroquinone and 30 -fold amounts of o-aminophenol, m-aminophenol and p-aminophenol have no influence on the detection of BPA when the signals change are below 10%.
The linear range and detection limit for BPA are also examined using DPV under
3 4 5 6 7 8 9 10 11 12 13 14 15 16 17 18 19 20 21 22 23 24 25 26 27 28 29 30 31 32 33 34 35 36 37 38 39 40 41 42 43 44 45 46 47 48 49 50 51 52 53 54 55 56 57
Analytical
Methods
Accepted
Manuscript
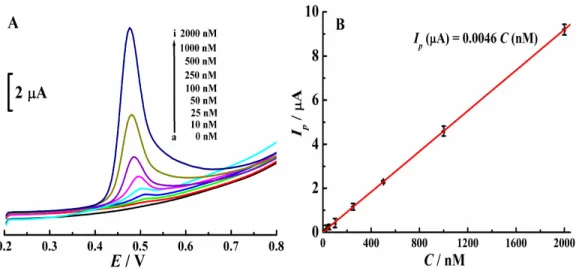
the optimized conditions. As shown in Fig. 7, the oxidation peak current of BPA (Ip,
µA) is proportional to its concentration (C, nM) over the range from 10 nM to 2000
nM. The calibration curve and correlation coefficients are Ip(µA)= 0.0046 C (nM), R =
0.998. In addition, the oxidation signals of 10 nM BPA at GS-Ni(OH)2 are recorded to
estimate its detection limit. The standard deviation of eleven detection is calculated, and the limit of detection (LOD) for BPA is evaluated to be as low as 5 nM based on a signal to noise ratio of 3 with an accumulation time of 180 s.
Analytical application
In order to evaluate the sensing performance of this method, the fabricated GS-Ni(OH)2/GCE is used to determine BPA content in the real water samples. In brief,
water samples collected from different place in Wuhan city are first filtered through a 0.45 µm filter membrane. Then, 5.0 mL of water sample is added into 5.0 mL pH 7.5 phosphate buffer solution. Afterward, the DPV curves are recorded from 0.2 to 0.8 V after accumulation for 180 s. The results illustrated in Table 2. show that no BPA is detected in these water samples. So the BPA standards with different concentrations are spiked into the water samples. Each water sample undergoes three parallel detections, and the RSD value is below 5%, suggesting high detection precision. The content of BPA in water samples are calculated by standard addition method, and the results are listed in Table 1. The value of recovery is in the range from 97.0% to 105.0%, revealing the newly-developed method is accurate and has promising application. 3 4 5 6 7 8 9 10 11 12 13 14 15 16 17 18 19 20 21 22 23 24 25 26 27 28 29 30 31 32 33 34 35 36 37 38 39 40 41 42 43 44 45 46 47 48 49 50 51 52 53 54 55 56 57
Analytical
Methods
Accepted
Manuscript
Conclusions
Graphene nanosheets are easily prepared via one-step solvent exfoliation of graphite powder and high surface roughness of wrinkled Ni(OH)2 are synthesized by simple
homogeneous precipitation method. The fabricated graphene-Ni(OH)2 hybrid sensing
film exhibits stronger signal enhancement on BPA oxidation, relative to pristine graphene and pure Ni(OH)2. The remarkably enhanced BPA oxidation signal may be
attributed to the cooperative enhancement effect of GS-Ni(OH)2 hybrid and CTAB,
which leads to the notably increased accumulation efficiency for BPA. Compared with the reported electrochemical methods for BPA detection, this newly fabricated sensing platform for BPA exhibits higher sensitivity. Furthermore, this analytic method is successfully applied to detect the trace level of BPAin the real samples.
Acknowledgements
This work was supported by the National Natural Science Foundation of China (Grant No. 21375041) and the Program for New Century Excellent Talents in University (Grant NCET-11-0187). The Center of Analysis and Testing of Huazhong University of Science and Technology was also acknowledged for its help in the SEM, TEM observation and XRD test.
3 4 5 6 7 8 9 10 11 12 13 14 15 16 17 18 19 20 21 22 23 24 25 26 27 28 29 30 31 32 33 34 35 36 37 38 39 40 41 42 43 44 45 46 47 48 49 50 51 52 53 54 55 56 57
Analytical
Methods
Accepted
Manuscript
References
1 S. Jenkins, N. Raghuraman, I. Eltoum, M. Carpenter, J. Russo, C.A. Lamartiniere,
Environ. Health Perspect., 2009, 117, 910-915.
2 M.V. Maffini, B.S. Rubin, C. Sonnenschein, A.M. Soto, Mol. Cell. Endocrinol., 2006, 254, 179-186.
3 J.A. Rogers, L. Metz, V.W. Yong, Mol. Immunol., 2013, 53, 421-430.
4 K.S. Saili, M.M. Corvi, D.N. Weber, A.U. Patel, S.R. Das, J. Przybyla, K.A. Anderson, R.L. Tanguay, Toxicology, 2012, 291, 83-92.
5 P.A. Hunt, M. Susiarjo, C. Rubio, T.J. Hassold, Biol. Reprod., 2009, 81, 807-813. 6 A.A. Balandin, Nat. Mater., 2011, 10, 569-581.
7 A.H. Castro Neto, F. Guinea, N.M.R. Peres, K.S. Novoselov, A.K. Geim, Rev. Mod.
Phys., 2009, 81, 109-162.
8 A.K. Geim, K.S. Novoselov, Nat. Mater., 2007, 6, 183-191.
9 L. Wang, M. Xu, L. Han, M. Zhou, C.Z. Zhu, S.J. Dong, Anal. Chem., 2012, 84, 7301-7307.
10 J.F. Wu, M.Q. Xu, G.C. Zhao, Electrochem. Commun., 2010, 12, 175-177.
11 Q.J. Wan, Y. Liu, Z.H. Wang, W. Wei, B.B. Li, J. Zou, N.J. Yang, Electrochem.
Commun., 2013, 29, 29-32.
12 Q.J. Wan, H. Cai, Y. Liu, H.T. Song, H.L. Liao, S.T. Liu, N.J. Yang, Chem. Eur. J., 2013, 19, 3483-3489.
13 X. Luo, Z.P. Qiu, Q.J. Wan, H. Shu, N.J. Yang, Phys. Status Solidi A-Appl. Mat., 2014, 12, 2795-2800. 3 4 5 6 7 8 9 10 11 12 13 14 15 16 17 18 19 20 21 22 23 24 25 26 27 28 29 30 31 32 33 34 35 36 37 38 39 40 41 42 43 44 45 46 47 48 49 50 51 52 53 54 55 56 57
Analytical
Methods
Accepted
Manuscript
14 Y. Hernandez, V. Nicolosi, M. Lotya, F.M. Blighe, Z.Y. Sun, S. De, I.T. Mcgovern, B. Holland, M. Byrne, Y.K. Gun’ko, J.J. Boland, P. Niraj, G. Duesberg, S. Krishnamurthy, R. Goodhue, J. Hutchison, V. Scardaci, A.C. Ferrari, J.N. Coleman, Nat. Nanotechnol., 2008, 3, 563-568.
15 J.N. Coleman, Adv. Funct. Mater., 2009, 19, 3680-3695.
16 K.F. Zhou, Y.H. Zhu, X.L. Yang, J. Luo, C.Z. Li, S.R. Luan, Electrochim. Acta, 2010, 55, 3055-3060.
17 Y.W. Zhang, S. Liu, L. Wang, X.Y. Qin, J.Q. Tian, W.B. Lu, G.H. Chang, X.P. Sun,
RSC Adv., 2012, 2, 538-545.
18 Y.W. Hsu, T.K. Hsu, C.L. Sun, Y.T. Nien, N.W. Pu, M.D. Ger, Electrochim. Acta, 2012, 82, 152-157.
19 C. Wu, Q. Cheng, L.Q. Li, J.P. Chen, K.B. Wu, Electrochim. Acta, 2014, 115, 434-439.
20 Y. Zhang, F.G. Xu, Y.J. Sun, Y. Shi, Z.W. Wen, Z. Li, J. Mater. Chem., 2011, 21, 16949-16954.
21 Y. Fan, H.T. Lu, J.H. Liu, C.P. Yang, Q.S. Jing, Y.X. Zhang, X.K. Yang, K.J. Huang,
Colloid Surf. B-Biointerfaces, 2011, 83, 78-82.
22 X.J. Han, P. Xu, C.Q. Xu, L. Zhao, Z.B. Mo, T. Liu, Electrochim. Acta, 2005, 50, 2763-2769.
23 G.M. Wang, Y.C. Ling, X.H. Lu, T. Zhai, F. Qian, Y.X. Tong, Y. Li, Nanoscale, 2013, 5, 4129-4133. 3 4 5 6 7 8 9 10 11 12 13 14 15 16 17 18 19 20 21 22 23 24 25 26 27 28 29 30 31 32 33 34 35 36 37 38 39 40 41 42 43 44 45 46 47 48 49 50 51 52 53 54 55 56 57
Analytical
Methods
Accepted
Manuscript
24 B. Ntsendwana, B.B. Mamba, S. Sampath, O.A. Arotiba, Int. J. Electrochem. Sci., 2012, 7, 3501-3512.
25 L. Peng, S.Y. Dong, H.D. Xie, G.Z. Gu, Z.X. He, J.S. Lu, T.L. Huang, J.
Electroanal. Chem., 2014, 726, 15-20.
26 F.R. Wang, J.Q. Yang, K.B. Wu, Anal. Chim. Acta, 2009, 638, 23-28.
27 Y.Q. Lin, K.Y. Liu, C.Y. Liu, L. Yin, Q. Kang, L.B. Li, B. Li, Electrochim. Acta, 2014, 133, 492-500.
28 X.W. Yu, Y.K. Chen, L.P. Chang, L. Zhou, F.X. Tang, X.P. Wu, Sens. Actuator
B-Chem., 2013, 186, 648-656.
29 X.L. Niu, W. Yang, G.Y. Wang, J. Ren, H. Guo, J.Z. Gao, Electrochim. Acta, 2013,
98, 167-175.
30 Y.X. Zhang, Y.X. Cheng, Y.Y. Zhou, B.Y. Li, W. Gu, X.H. Shi, Y.Z. Xian, Talanta, 2013, 107, 211-218.
31 L.D. Wu, D.H. Deng, J. Jin, X.B. Lu, J.P. Chen, Biosens. Bioelectron., 2012, 35, 193-199.
32 D.G. Mita, A. Attanasio, F. Arduini, N. Diano, V. Grano, U. Bencivenga, S. Rossi, A. Amine, D. Moscone, Biosens. Bioelectron., 2007, 23, 60-65.
33 W. Wang, X. Yang, Y.X. Gu, C.F. Ding, J. Wan, Ionics, 2015, 21, 885-893.
34 A.C. Ferrari, J.C. Meyer, V. Scardaci, C. Casiraghi, M. Lazzeri, F. Mauri, S. Piscanec, D. Jiang, K.S. Novoselov, S. Roth, A.K. Geim, Phys. Rev. Lett., 2006,
97, 187401(1-4).
35 C. Casiraghi, A. Hartschuh, H. Qian, S. Piscanec, C. Georgi, A. Fasoli, K.S.
3 4 5 6 7 8 9 10 11 12 13 14 15 16 17 18 19 20 21 22 23 24 25 26 27 28 29 30 31 32 33 34 35 36 37 38 39 40 41 42 43 44 45 46 47 48 49 50 51 52 53 54 55 56 57
Analytical
Methods
Accepted
Manuscript
Novoselov, D.M. Basko, A.C. Ferrari, Nano Lett., 2009, 9, 1433-1441.
36 C. Wu, Q. Cheng, K.B. Wu, G. Wu, Q. Li, Anal. Chim. Acta, 2014, 825, 26-33. 37 C. Wu, Q. Cheng, K.B. Wu, Anal. Chem., 2015, 87, 3294-3299.
38 J.T. Zhang, S. Liu, G.L. Pan, G.R. Li, X.P. Gao, J. Mater. Chem. A, 2014, 2, 1524-1529.
39 D.A.C. Brownson, J.P. Metters, D.K. Kampouris, C.E. Banks, Electroanalysis, 2011, 23, 894-899. 3 4 5 6 7 8 9 10 11 12 13 14 15 16 17 18 19 20 21 22 23 24 25 26 27 28 29 30 31 32 33 34 35 36 37 38 39 40 41 42 43 44 45 46 47 48 49 50 51 52 53 54 55 56 57
Analytical
Methods
Accepted
Manuscript
Captions for figures and table
Fig. 1 SEM images of bulk graphite (A), graphite@48 h (B) and TEM image of graphite@48 h (C).
Fig. 2 Raman spectrum (A) and XRD pattern (B) of graphite and graphite@48 h.
Fig. 3 SEM images of CTAB/GCE (A), GS/GCE (B), Ni(OH)2/GCE (C) and
GS-Ni(OH)2/GCE (D) at high magnification. Scale bar: 1 µm. Inset in Fig. 3C is the
low magnification of SEM image of Ni(OH)2。
Fig. 4 XRD pattern of Ni(OH)2.
Fig. 5A DPV curves of 0.5 µM BPA at bare GCE (a), CTAB/GCE (b), Ni(OH)2/GCE
(c), GS/GCE (d) and GS-Ni(OH)2/GCE (e) in 0.1 M phosphate buffer solution (pH
7.5). Fig. 5B Variation of oxidation peak current of 0.5 µM BPA on different electrodes. Accumulation potential: 0.2 V, accumulation time: 120 s, amount of modifier: 2 µL.
Fig. 6 Effect of pH values (A), accumulation potential (B), amount of GS-Ni(OH)2
suspension (C), and accumulation time (D) on the oxidation peaks current of BPA. Error bar represents the standard deviation of triple measurements.
3 4 5 6 7 8 9 10 11 12 13 14 15 16 17 18 19 20 21 22 23 24 25 26 27 28 29 30 31 32 33 34 35 36 37 38 39 40 41 42 43 44 45 46 47 48 49 50 51 52 53 54 55 56 57
Analytical
Methods
Accepted
Manuscript
Fig. 7A DPV curves of BPA on GS-Ni(OH)2/GCE with different concentration. Fig.
7B Calibration curve of BPA. Accumulation potential: 0.2 V, accumulation time: 180 s, amount of modifier: 2 µL. Error bar represents the standard deviation of triple measurements.
Table 1 Performance comparison of electrochemical methods for BPA detection.
Table 2. Determination of BPA in real water samples by GS-Ni(OH)2 composite.
3 4 5 6 7 8 9 10 11 12 13 14 15 16 17 18 19 20 21 22 23 24 25 26 27 28 29 30 31 32 33 34 35 36 37 38 39 40 41 42 43 44 45 46 47 48 49 50 51 52 53 54 55 56 57
Analytical
Methods
Accepted
Manuscript
Fig. 1 Fig. 2
A
B
C
3 4 5 6 7 8 9 10 11 12 13 14 15 16 17 18 19 20 21 22 23 24 25 26 27 28 29 30 31 32 33 34 35 36 37 38 39 40 41 42 43 44 45 46 47 48 49 50 51 52 53 54 55 56 57Analytical
Methods
Accepted
Manuscript
Fig. 3 Fig. 4 3 4 5 6 7 8 9 10 11 12 13 14 15 16 17 18 19 20 21 22 23 24 25 26 27 28 29 30 31 32 33 34 35 36 37 38 39 40 41 42 43 44 45 46 47 48 49 50 51 52 53 54 55 56 57
Analytical
Methods
Accepted
Manuscript
Fig. 5 Fig. 6 3 4 5 6 7 8 9 10 11 12 13 14 15 16 17 18 19 20 21 22 23 24 25 26 27 28 29 30 31 32 33 34 35 36 37 38 39 40 41 42 43 44 45 46 47 48 49 50 51 52 53 54 55 56 57
Analytical
Methods
Accepted
Manuscript
Fig. 7 3 4 5 6 7 8 9 10 11 12 13 14 15 16 17 18 19 20 21 22 23 24 25 26 27 28 29 30 31 32 33 34 35 36 37 38 39 40 41 42 43 44 45 46 47 48 49 50 51 52 53 54 55 56 57
Analytical
Methods
Accepted
Manuscript
Table 1
Electrodes Linear range (M) Detection limit (nM) References RGOa/GCE 5.0×10⁻⁸-1.0×10⁻⁶ 47 [24] Bi2WO6/CPEb 7.0×10⁻⁸-1.3×10⁻⁶ 20 [25]
Mesoporous SiO2/CPE 2.2×10⁻⁷-8.8×10⁻⁶ 38 [26]
PGAc-MWCNTd/GCE 1.0×10⁻⁷-1.0×10⁻⁵ 20 [27] BMIMBF4e/CPE 1.0×10⁻⁷-1.1×10⁻⁵ 83 [28] SGNFf-Au/GCE 8.0×10⁻⁸-2.5×10⁻⁴ 35 [29] MNPsg-RGO/GCE 6.0×10⁻⁸-1.1×10⁻⁵ 17 [30] Tyrosinase-graphene/GCE 1.0×10⁻⁷-2.0×10⁻⁶ 33 [31] Tyrosinase-SWNTh/CPE 1.0×10⁻⁷-1.2×10⁻⁵ 20 [32] Li4Ti5O12-MWCNT/GCE 1.0×10 -7 -1.0×10⁻⁵ 78 [33]
GS-Ni(OH)2/GCE 1.0×10⁻⁸-2.0×10⁻⁶ 5.0 This work a
RGO Reduced graphene oxide b
CPE Carbon paste electrode c
PGA Polyglutamate acid d
MWCNT Multi-walled carbon nanotube e
BMIMBF4 1-butyl-3-methylimidazolium tetrafluoroborate f
SGNF Stacked graphene nanofibers g
MNPs Magnetic nanoparticles
h SWCNT Single-walled carbon nanotube 3 4 5 6 7 8 9 10 11 12 13 14 15 16 17 18 19 20 21 22 23 24 25 26 27 28 29 30 31 32 33 34 35 36 37 38 39 40 41 42 43 44 45 46 47 48 49 50 51 52 53 54 55 56 57
Analytical
Methods
Accepted
Manuscript
Table 2 Samples Measured (M) Spiked (M) Expected (M) Founded (M) RSD (%) Recovery (%) 1 - 2.0×10⁻⁸ 2.0×10⁻⁸ 2.1×10⁻⁸ 4.2 105.0 2 - 5.0×10⁻⁸ 5.0×10⁻⁸ 4.9×10⁻⁸ 3.8 98.0 3 - 2.0×10⁻⁷ 2.0×10⁻⁷ 2.1×10⁻⁷ 3.4 105.0 4 - 5.0×10⁻⁷ 5.0×10⁻⁷ 5.1×10⁻⁷ 2.7 102.0 5 - 1.0×10⁻⁶ 1.0×10⁻⁶ 9.7×10⁻⁷ 4.5 97.0 3 4 5 6 7 8 9 10 11 12 13 14 15 16 17 18 19 20 21 22 23 24 25 26 27 28 29 30 31 32 33 34 35 36 37 38 39 40 41 42 43 44 45 46 47 48 49 50 51 52 53 54 55 56 57