WORKING PAPERS
Working Paper No 2011-55 November 2011
A fuzzy logic approach to
measure overweight
Maria Noel PI ALPERIN Guayarmina BERZOSA
CEPS/INSTEAD Working Papers are intended to make research findings available and stimulate comments and discussion. They have been approved for circulation but are to be considered preliminary. They have not been edited and have not
been subject to any peer review.
The views expressed in this paper are those of the author(s) and do not necessarily reflect views of CEPS/INSTEAD. Errors and omissions are the sole responsibility of the author(s).
1
A fuzzy logic approach to measure overweight
Maria Noel Pi Alperin
1Guayarmina Berzosa
CEPS/INSTEAD, Luxembourg
October 2011
Abstract
We apply fuzzy sets theory to measure the extent of overweight in Luxembourg. This methodology permits to differentiate between mild or severe forms of overweight and to identify the sub-populations which contribute most to global overweight. The application to residents of Luxembourg shows that natives are those who contribute most to global overweight. Specifically, men are more affected than women, the intensity of overweight is more severe with age and the more educated are less affected by obesity.
Keywords: decomposition; fuzzy set theory; overweight JEL classification codes: D63 ; I19
1
Maria Noel Pi Alperin, CEPS/INSTEAD, 3 avenue de la Fonte, L-4364 Esch-sur-Alzette, Luxembourg. Associate researcher at LAMETA, Université Montpellier 1. Corresponding author e-mail: MariaNoel.PiAlperin@ceps.lu.
2
1
Introduction
Obesity and overweight continue to be a public health problem in the world.2 Thereis a concern regarding the increasingly fast trend in overweight and obesity in adults and children.The World Health Organization (WHO) estimated in 2005 that 1 billion of the global population was affected by either condition, and they forecast 2.3 billion adults overweight and 700 million obese in 2015 (WHO, 2011).
According to Antecol and Bedard (2006), those suffering from obesity have a higher risk of developing certain types of cancer, heart disease, stroke and diabetes among other health problems. This has consequences for the government in terms of cost of care, either medical and/or social services (i.e. Filkenstein et al., 2003; Fry and Finley, 2005; WHO, 2006). As this has important implications for policy makers and medical organizations alike, the estimation of the prevalence of overweight and obesity is necessary in order to (i) identify populations at particular risk of obesity and its associated health and economic consequences; (ii) help policy makers and public health planners in the mobilization and allocation of resources; (iii) provide baseline data for monitoring the effectiveness of national programs for the control of obesity (WHO, 2000).
Most of the literature on this topic focuses on estimating the proportion of population overweight and obese (i.e. WHO, 2000). However, measuring this segment of the population does not, as such, reflect the intensity of the overweight. It doesn‟t differentiate between mild or severe forms of overweight suffered by an individual. In this paper, we propose a method for measuring the intensity of these conditions. Precisely, we apply a methodology based on fuzzy set theory, initially developed for the measurement of poverty3, to assess the extent and the intensity levels of overweight and obesity.
This methodology allows computing an overweight indicator for each individual and an average indicator for the entire population. This index satisfies
2
By overweight and obesity we consider the “abnormal or excessive fat accumulation that may impair health” (WHO, 2011).
3
Cerioli and Zani (1990) proposed a first statistical method to measure poverty using this theory. Since then, several authors have developed further different aspects linked to the utilization of the fuzzy set theory in poverty analysis (Dagum et al., 1991; Cheli et al., 1994; Chiappero-Martinetti, 1994 and 2000; Cheli and Lemmi, 1995; Qizilbash, 2003; Dagum and Costa, 2004; Lemmi and Betti, 2006; and Mussard and Pi Alperin, 2007 among others).
3
several axiomatic conditions. Among those, the property of „sub-group decomposability‟ which permits distinguishing the sub-populations which contribute most to global overweight. This means the possibility to policy makers to design more effective overweight policies by targeting specifically the most affected group(s) of population.
We apply this new indicator to measure overweight in Luxembourg using data from the survey Panel Socio-Economique Liewen zu Lëtzebuerg 2008 (PSELL-3). Evidence on this issue in Luxembourg is scarce. For example, Tchicaya and Lorentz (2010) describe the prevalence of overweight and obesity in Luxembourg between 1995 and 2008. They find that compared to 1995, the share of overweight people has not changed, while the share of obese people increased from 14.3% in 1995 to 17.2% in 2005 and 17.7% in 2008. On the other hand, Alkerwi et al. (2011) treat the problem of overweight and obesity in the view of the cardiovascular risk factors in Luxembourg. They found that obesity is one of the most predominant cardiovascular risk factors. Precisely, 20.9% of individuals with cardiovascular diseases are obese.
This paper is organised as follow: Section 2 presents the basic notions of the „overweight fuzzy index‟ based on fuzzy sets. Section 3 gives a brief description of the used database. In Section 4 the methodology is applied to analyze the extent and the intensity levels of overweight in Luxembourg. Concluding remarks are given in
Section 5.
2
Measuring overweight
2.1 Commonly used methods
The most common indicator determining weight status for each individual is the
body mass index (BMI). It relates an individual‟s weight to his or her height. Precisely, the BMI equals weight in kilograms divided by height in meters squared.
The World Health Organization defines overweight as a BMI equal to or more than 25, and obesity as a BMI equal to or more than 30 (WHO, 2000). These cut-off points provide a benchmark for individual assessment, but there is evidence that risk
4
of chronic disease in population increases progressively from a BMI of 21.Table 1 presents the different categories of adiposity according to BMI for adults.
Table 1: Categories of adiposity according to BMI
Description BMI (kg/m²) Underweight <18.5 Normal range 18.50-24.99 Overweight ≥25 Obese ≥30 Sub-classifications Overweight pre-obese 25.00-29.99 Moderately obese 30.00-34.99 Severely obese 35.00-39.99
Very severely obese ≥40.00
Source: WHO, 2000
The most common practice to calculate the extent of overweight (obesity) is to compute the number of people with a BMI >25 (BMI >30) divided by the total population. Then, we have the proportion of overweight (obese) individuals with respect to the entire population. A major drawback of this method is that it does not distinguish between mild or sever forms of overweight and all individuals are considered as suffering the same intensity of overweight.
In next section we propose a method to measure the extent of overweight using fuzzy logic. Fuzzy theory is particularly adapted for analyzing overweight as biologically there is a continuous transition from normal weight to obesity.
2.2
The Overweight Fuzzy Index
Zadeh (1965) introduced the fuzzy set theory as an extension of the classical notion of set considering that an element can belong partially, but not absolutely, to a category. Zadeh‟s mathematical idea is easy to apply to the biomedical world because so many concepts are not exactly defined. For example, there is not a straight-line relationship between the BMI and the degree of overweight. An individual with a BMI<25 is an individual not suffering from any kind of overweight (the degree of membership to the “overweight” set is 0). An individual with a
BMI>30 is definitely overweight (the degree of membership to the “overweight” set
is 1). For BMI values in between, the degree of membership would have fractional values between 0 and 1 (Hillman, 2005). This section briefly summarizes the basic concepts related to the analysis of the intensity of overweight in the framework of the
5
fuzzy set theory. For this, we rely on a previous paper of Mussard and Pi Alperin (2007).
Let A be a population of individuals, A={1,…,i,…,N}. Let O be the fuzzy subset of individuals suffering from some degree of overweight, 𝑂 ⊂ 𝐴. In case of a census, A
contains all the individuals of a population, hence each individual has the constant weight of 1, i=1,…, N. Conversely, if A is a representative stratified sample of a population, to each individual corresponds a weight ni equal to the number of
individuals, the sample observation i represents in the population.
Let xi denote the degree of membership of individual i to the fuzzy sub-set O. In
particular:
(i) xi=0 if the individual is not considered to having overweight problems;
(ii) xi=1 if the individual suffers obesity; and
(iii) 0<xi<1 if the individual suffers mild form of overweight, but is not
considered as suffering obesity.
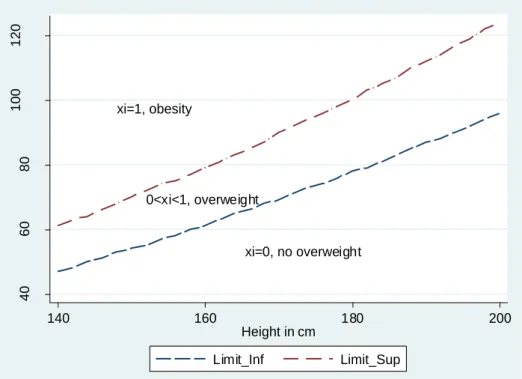
Figure 1: The degree of membership to the fuzzy subset of overweight individuals
Suppose that xi is calculated taking into account the ratio between weight and height
(BMI). Then, Figure 1 shows the way that the fuzzy logic will compute the continue xi=1, obesity 0<xi<1, overweight xi=0, no overweight 40 60 80 100 120 W e ig h t in Kg 140 160 180 200 Height in cm Limit_Inf Limit_Sup
6
transition from normal weight to obesity. Thus, all individuals whose weight-height combination is below the bottom line (dashed line), will have a xi=0. All those whose
combination is above the top line (dashed-dot line) will have a xi=1. Finally, those
who have a height-weight combination which places them in between will have a xi
value between 0 and 1 depending on whether it is closer to the upper or lower limit. The Overweight Fuzzy Index (OFI) of A is population mean of xi:
𝑂𝐹𝐼 = 𝑥𝑖 𝑁 𝑖=1 𝑛𝑖 𝑛𝑖 𝑁 𝑖=1 . (1)
The OFI index measures the intensity of overweight for the total population. It will be equal to 0 if nobody in the total population is suffering from overweight. The index will be equal to 1 if everybody suffers obesity. Thus, the closer OFI is to 1 more severe is the form of the individuals‟ overweight.
The OFI index allows two different interpretations as it belongs to a family of indexes 𝑂𝐹𝐼𝜕: 𝑂𝐹𝐼𝜕 = 𝑁𝑖=1(𝑥𝑖)𝜕𝑛𝑖 𝑛𝑖 𝑁 𝑖=1 . (2)
In particular, if 𝜕 = 0 it is possible to measure the proportion of the population with any positive degree of overweight; and if 𝜕 = 1 it is the classic index, that is the population mean of individual overweight indicators.
2.3
The group and sub-group decomposition
As Mussard and Pi Alperin (2007) show, a richer way to evaluate the structure of the overweight problem is to provide a decomposition by sub-population groups. Let us divide the total population into K groups of size Nk (k=1,…,K). Then, the overweight
fuzzy index associated with group K is:
𝑂𝐹𝐼𝑘 = 𝑥𝑖𝑘𝑛𝑖𝑘 𝑁𝑘 𝑖=1 𝑛𝑖𝑘 𝑁𝑘 𝑖=1 . (3)
7
Following (3), the overall overweight fuzzy index can be computed as a weighted average of the overweight level within each group:
𝑂𝐹𝐼 = 𝑥𝑖 𝑘𝑛 𝑖 𝑘 𝑁𝑘 𝑖=1 𝑠 𝑘=1 𝑛𝑖 𝑁 𝑖=1 . (4)
Hence, it is possible to measure the contribution of the k-th group to the global index of overweight: 𝐶𝑂𝐹𝐼𝑘 = 𝑁𝑖=1𝑘 𝑥𝑖𝑘𝑛𝑖𝑘 𝑛𝑖 𝑁 𝑖=1 . (5)
Thus, if total population is divided by gender, then, it is possible to calculate the contribution of the intensity of overweight of men group to the intensity of overweight for the entire population.
Let us now suppose that the population is divided into a first partition, with K
groups. Let B be a second partition. Suppose that each group K is separated into P
sub-groups (b=1,…,P). Then, 𝑥𝑖𝑏𝑘 is the intensity of overweight of the i-th individual of sub-group „bk‟.
Therefore, it is possible to measure the state of overweight within each b sub-group: 𝑂𝐹𝐼𝑏𝑘 = 𝑥𝑖𝑏𝑘𝑛𝑖𝑏𝑘 𝑁𝑏𝑘 𝑖=1 𝑛𝑖𝑏𝑘 𝑁𝑏𝑘 𝑖=1 . (6)
Also, it is possible to calculate the contribution of the b-th sub-group to the k-th group‟s overweight index:
𝐶𝑂𝐹𝐼𝑏𝑘 𝑘 = 𝑥𝑖𝑏𝑘𝑛𝑖𝑏𝑘 𝑁𝑏𝑘 𝑖=1 𝑛𝑖𝑘 𝑁𝑘 𝑖=1 . (7)
Hence, the overall overweight index can be defined as a weighted average of the overweight intensity that exists within the groups of the second partition:
𝑂𝐹𝐼 = 𝑥𝑖 𝑏𝑘𝑛 𝑖𝑏𝑘 𝑁𝑏𝑘 𝑖=1 𝑠 𝑘=1 𝑝 𝑏=1 𝑛𝑖 𝑁 𝑖=1 . (8)
Consequently, the contribution to the global overweight index of the b-th sub-group of the k-th group is:
8 𝐶𝑂𝐹𝐼𝑏𝑘 = 𝑁𝑖=1𝑏𝑘 𝑥𝑖𝑏𝑘𝑛𝑖𝑏𝑘 𝑛𝑖 𝑁 𝑖=1 . (9)
Suppose a first partition of the population K by gender (men, women). Suppose now that each sub-population is divided into a second partition B by age (25-49; 50-64). Then, for example, it is possible to calculate the contribution of the ‟25-49‟ sub-group to the „men‟ sub-group and also the contribution of the sub-sub-group „men between 25 and 49 years old‟ to the global overweight intensity. Precisely, the part of global overweight that is explained by each sub-population.
3
Data
The database used in this study is the Panel Socio-Economique Liewen zu Lëtzebuerg
2008 (PSELL-3, wave 6) which includes information about income, living conditions, employment, education, health and savings in Luxembourg. This survey has been performed every year since 2003 and is representative of the population of households and individuals residing in Luxembourg. In this wave, a new question was introduced in the survey which allows recovering data on the body mass index
according to the height and weight of each individual.
3.1 Descriptive statistics
Our sample includes all natives and immigrants individuals living in Luxembourg aged of 16 years old and more. Due to the population composition of Luxembourg we have divided the total population into four sub-groups: (i) natives from Luxembourg; (ii) Portuguese immigrants (as they represent the most important immigrant group of Luxembourg)4; (iii) immigrants from EU-15 countries; and (iv) immigrants from other countries (non EU-15). In total, we analyzed 7448 individuals (3331 nationals, 1549 Portuguese immigrants, 2094 other EU-15 immigrants and 474 other non EU-15 immigrants).
Table 2 presents some descriptive statistics for our sample, and more specifically, for each sub-population. We can see that Portuguese and non EU-15 immigrants are
4
43.1% of the total population of Luxembourg does not have the Luxembourgish nationality. More precisely, 37% of the immigrant population is Portuguese (Thill-Ditsch, 2010).
9
younger than natives and EU-15 immigrants (respectively 88%, 86%, 71% and 53% of the sub-populations is younger than 50 years old). Concerning education, Portuguese immigrants are less educated than the other sub-populations. This also reflects that the proportion of natives and EU-15 immigrants working in professional activities is more important than the other residents of Luxembourg. The perception of health is similar among different population groups. Finally, the EU-15 group of immigrants is the sub-population that practices more physical exercises (66% of its population practice exercises regularly or occasionally). The Portuguese immigrants are those who practice less exercise (only 24%).
Table 2: Sample composition by nationality group (in percentage)
Nationality
Natives Portuguese EU-15 Non EU-15
Gender 100 100 100 100 Male 49 53 51 39 Female 51 47 49 61 Education 100 100 100 100 None or primary 22 66 12 27 Secondary 55 30 33 38 Post-secondary 23 4 56 35 Age 100 100 100 100 16-24 years old 13 16 11 14 25-49 years old 40 72 60 72 50-64 years old 26 10 22 10 >64 years old 21 1 6 4 Activity 100 100 100 100 Professional 12 2 33 14 Intermediate 20 5 20 9 Workman 12 41 10 18 Manual 3 25 3 14 Inactive 54 27 34 45 Health 100 100 100 100 Very good 74 75 82 81 Good 18 17 13 14 Bad 8 8 5 5 Physical exercises 100 100 100 100 Yes, regularly 34 13 40 25 Yes, occasional 17 11 22 24 Non, health 8 6 5 4 Non, other 41 71 33 47
Sample Size (# individuals) 3331 1549 2094 474
Source: PSELL-3, 2008
3.2 The population sub-groups
In order to identify those sub-populations more affected by overweight, we consider a set of group decompositions which have been proved in several epidemiological studies to have an influence in health: nationality, gender, age, perception of health,
10
physical exercise, level of education and position in the labor market (Paeratakul et al., 2002; Williams and Collins, 1995; Branca et al., 2007; Hernandez-Quevedo et al., 2010).
Regarding age, Hernandez-Quevedo et al. (2010) show that the age is negatively related to the reported health level. However, when adding gender, male tend to show better health status than women. These results motivated us to decompose the global population by gender and by age to compare the intensities of overweight within these sub-groups. Four main groups of ages are considered: 16-24, 25-49, 50-64 and >64 years old.
Based on the study of Paeratakul et al. (2002) which found that perception of overweight was more common in women than in men, we analyse the overweight intensities in three groups of population: those who perceived their health status as „very good‟; those who consider their health as „good‟; and finally, those whose perception of their health is „bad‟.
Another interesting decomposition is by level of physical exercise practice. By analyzing this decomposition we can measure if individuals who practice physical exercise are less affected by overweight than those who don‟t exercise (Branca et al., 2007). Four categories are taken into consideration: individuals who practice physical exercises regularly; individuals who practice physical exercises occasionally; individuals who don‟t do exercises due to health problems; and individuals who don‟t do exercises due to other reasons than health.
We also consider the contribution of education. Different studies show dissimilar results. For example, Williams and Collins (1995) show a relation between lower education and worse health. The inverse trend has being found by Hernandez-Quevedo et al. (2010), the higher is the education level the less self-reported health problems. In our study, three different sub-groups were taken into account: non-educated individuals or with primary school level; individuals with secondary school level; and individuals with post-secondary school education.
The last decomposition is according to the position in the labour market. Hernandez-Quevedo et al. (2010) point out that those who are unemployed, retired or housewife report a worst health than those who work. Besides there are differences
11
among those who work full time (better health) and those who work part time (worse health). Thus we consider the labour market characteristics as another important decomposition of the population. The studied sub-groups are: unemployed, professional and managers, intermediate occupations, skilled workman and craftsman and manual labourers.
4
Empirical study: overweight in Luxembourg
Overweight (and obesity) is a global disease and Luxembourg is not an exception. Table 3 shows that more than 55% of the analyzed population of residents in Luxembourg suffers from at least some degree of overweight with an average overweight value of 0.3174.
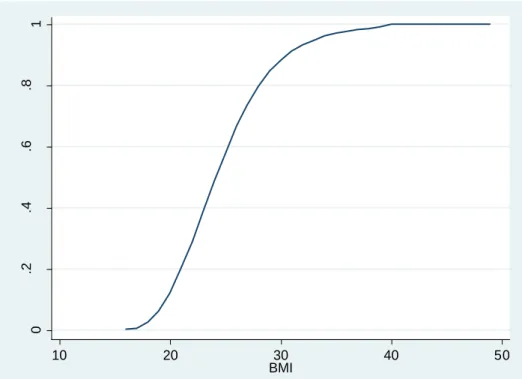
In addition, Figure 2 shows the cumulative distribution of the entire population of Luxembourg by their body mass index level. It is possible to notice the disadvantageous position of Luxembourg residents face to the overweight (and obesity) phenomenon.
Figure 2: Cumulative distribution of residents of Luxembourg by BMI
0 .2 .4 .6 .8 1 To tal po pu la tio n 10 20 30 40 50 BMI
12
Let us now analyse the group decomposition by nationality (see Table 3). For instance, this decomposition shows that the proportion of Portuguese immigrants suffering from some level of overweight is more important than other residents in Luxembourg (60.01%). It also demonstrates that the intensity of overweight is similar between Portuguese residents and nationals on average (intensity levels of 0.3277 and 0.3261 respectively, in the first column). In addition, this methodology allows measuring the contribution of each population group to global overweight. Indeed, the contributions are also useful since they provide suitable statistical information to decision makers as it appears obvious to reduce obesity for the majority of the population which is in need. Then, the group of natives from Luxembourg appears to be the group which contributes most to explain global overweight problem in Luxembourg. Their contribution level is 63.09%.
Table 3:OFI values by nationality
Nationality 𝑶𝑭𝑰 𝑶𝑭𝑰𝟎 𝑪𝑶𝑭𝑰𝒌 (in%)
Luxemburgish (LU) 0.3277 0.5575 63.09
Portuguese (PT) 0.3261 0.6061 14.04
Other EU-15 0.2901 0.5146 18.64
Other non EU-15 0.2766 0.4917 4.24
Total 0.3174 0.5522 100
Note: 𝑂𝐹𝐼 measures the intensity of overweight; 𝑂𝐹𝐼0 measures the proportion of the population with any positive degree of overweight; 𝐶𝑂𝐹𝐼𝑘 measures the contribution levels of each k-th subgroup to the global
overweight index.
Table 4:OFI values by nationality and gender
Nationality Gender 𝑶𝑭𝑰 𝑶𝑭𝑰𝟎 𝑪𝒌𝒃𝒌 (in%) 𝑪𝑶𝑭𝑰𝒃𝒌 (in%)
LU Male 0.3598 0.6250 53.55 33.78 Female 0.2972 0.4933 46.45 29.31 PT Male 0.3334 0.6417 56.16 7.88 Female 0.3172 0.5627 43.84 6.15 EU-15 Male 0.3483 0.6225 59.62 11.11 Female 0.2327 0.4082 40.38 7.53
Non EU-15 Male 0.3329 0.6518 45.46 1.92
Female 0.2424 0.3946 54.54 2.31
Note: 𝑂𝐹𝐼 measures the intensity of overweight; 𝑂𝐹𝐼0 measures the proportion of the population with any positive degree of overweight; 𝐶𝑘𝑏𝑘 measures the contribution level of each bk-th subgroup to the k-th group; 𝐶𝑂𝐹𝐼𝑏𝑘 measures the contribution levels of each bk-thsubgroup to the global overweight index.
Let us now apply the multi-level decomposition technique. We first investigate the multi-level decomposition by nationality and gender (Table 4). The results demonstrate that males are not only more affected by overweight than women in all groups, but their intensity of overweight is also more important. Studying the nationality groups separately, it is possible to notice that the men group has the major contribution level to explain overall overweight except for the non EU-15 where the
13
sub-group of women explains 54.54% of total overweight. Particularly „males, natives from Luxembourg‟, „females, natives from Luxembourg‟ and „males, immigrants from EU-15 countries‟ have the most important contribution to explain total overweight (33.78%, 29.31% and 11.11%, respectively).
Table 5:OFI values by nationality and age
Nationaliy Age 𝑶𝑭𝑰 𝑶𝑭𝑰𝟎 𝑪𝒌𝒃𝒌 (in%) 𝑪𝑶𝑭𝑰𝒃𝒌 (in%)
LU 16-24 0.1182 0.2403 4.84 3.05 25-49 0.2904 0.5053 36.40 22.97 50-64 0.4022 0.6911 28.12 17.74 >64 0.4447 0.7055 30.64 19.33 PT 16-24 0.1329 0.2530 5.61 0.79 25-49 0.3292 0.6328 71.03 9.97 50-64 0.4720 0.7693 20.35 2.86 >64 0.5451 0.9875 3.00 0.42 EU-15 16-24 0.1184 0.1849 3.83 0.71 25-49 0.2345 0.4383 41.54 7.74 50-64 0.3621 0.6440 32.56 6.07 >64 0.4864 0.7909 22.07 4.11 Non EU-15 16-24 0.0649 0.2806 2.84 0.12 25-49 0.2884 0.4675 70.70 2.99 50-64 0.4420 0.7865 23.48 0.99 >64 0.1530 0.4667 2.99 0.13
Note: 𝑂𝐹𝐼 measures the intensity of overweight; 𝑂𝐹𝐼0 measures the proportion of the population with any positive degree of overweight; 𝐶𝑘𝑏𝑘 measures the contribution level of each bk-th subgroup to the k-th group; 𝐶𝑂𝐹𝐼𝑏𝑘 measures the contribution levels of each bk-thsubgroup to the global overweight index.
The next multi-level decomposition is by nationality and age (see Table 5). The results show that the higher proportions of people with some form of overweight are in the sub-groups of „more than 64 years old‟ (except for the non EU-15 countries group). The sub-group with the highest proportion of the population with any form of overweight are the Portuguese immigrants of more than 64 years old (98.75%), and the lowest proportion is in the immigrants from EU-15 countries between 16 and 24 years old (18.49%). In addition, the 25-49 years old sub-group is the most explicative sub-population within each group. Concerning the intensity levels of overweight we can notice that intensity increases with age. For example, in the case of Portuguese immigrants the intensity levels go from 0.1329 (for the sub-group of 16-24) to 0.5451 (for the group of >64).
We also analyze the overweight intensities by nationality and by degree of self-perceive health (Table 6). Regarding the respondents with „bad‟ self-self-perceive health status we cannot attribute these results as a consequence of overweight or obesity as the data doesn‟t show any direct link between them. Nevertheless, some interesting
14
conclusions can be drawn when looking into the individuals who have a „good‟ or a „very good‟ health with a positive relation with the OFI index. In fact, 65.17% of global overweight is explained by individuals who regard their health as „very good‟ (41.44%, 8.97%, 11.70% and 3.06% of Luxemburgish nationals, Portuguese residents, immigrants from EU-15 countries and immigrants from non EU-15, respectively). In other words, only 9.91% of the intensity of overweight in Luxembourg is explained by those individuals perceiving their health as „bad‟. These results put in evidence that different forms of overweight or even obesity are not necessary perceived as a real health problem for residents in Luxembourg.
Table 6:OFI values by nationality and self perception of health
Nationaliy Health 𝑶𝑭𝑰 𝑶𝑭𝑰𝟎 𝑪𝒌𝒃𝒌 (in%) 𝑪𝑶𝑭𝑰𝒃𝒌 (in%)
LU Very good 0.2894 0.5152 65.68 41.44 Good 0.4470 0.6922 24.77 15.63 Bad 0.4193 0.6512 9.55 6.03 PT Very good 0.2895 0.5663 63.88 8.97 Good 0.3886 0.7303 22.56 3.17 Bad 0.4861 0.6619 13.56 1.90 Very good 0.2391 0.4659 62.77 11.70 EU-15 Good 0.4757 0.7061 29.10 5.42 Bad 0.3860 0.5657 8.13 1.52 Very good 0.2530 0.4744 72.22 3.06
Non EU-15 Good 0.3298 0.5107 16.96 0.72
Bad 0.4378 0.6522 10.81 0.46
Note: 𝑂𝐹𝐼 measures the intensity of overweight; 𝑂𝐹𝐼0 measures the proportion of the population with any positive degree of overweight; 𝐶𝑘𝑏𝑘 measures the contribution level of each bk-th subgroup to the k-th group; 𝐶𝑂𝐹𝐼𝑏𝑘 measures the contribution levels of each bk-thsubgroup to the global overweight index.
Table 7:OFI values by nationality and physical activity
Nationaliy Physical exerc. 𝑶𝑭𝑰 𝑶𝑭𝑰𝟎 𝑪𝒌𝒃𝒌 (in%) 𝑪𝑶𝑭𝑰𝒃𝒌 (in%)
LU Yes, regularly 0.2551 0.4807 26.52 16.73 Yes, occasional 0.2509 0.5029 13.44 8.48 No, health 0.4419 0.6616 10.74 6.78 No, other 0.3999 0.6255 49.29 31.10 PT Yes, regularly 0.2211 0.4761 11.94 1.67 Yes, occasional 0.4342 0.6401 14.61 2.05 No, health 0.5201 0.7358 9.00 1.26 No, other 0.3196 0.6241 64.45 9.05 EU-15 Yes, regularly 0.1919 0.4045 24.96 4.65 Yes, occasional 0.2527 0.4981 17.64 3.29 No, health 0.5680 0.8025 11.45 2.13 No, other 0.3684 0.5922 45.95 8.56 Non EU-15 Yes, regularly 0.2637 0.5374 24.32 1.03 Yes, occasional 0.2736 0.4919 21.69 0.92 No, health 0.6950 0.7485 13.00 0.55 No, other 0.2392 0.4390 40.99 1.74
Note: 𝑂𝐹𝐼 measures the intensity of overweight; 𝑂𝐹𝐼0 measures the proportion of the population with any positive degree of overweight; 𝐶𝑘𝑏𝑘 measures the contribution level of each bk-th subgroup to the k-th group; 𝐶𝑂𝐹𝐼𝑏𝑘 measures the contribution levels of each bk-thsubgroup to the global overweight index.
15
The next decomposition concerns the intensity of physical exercise practice. The results presented in Table 7, are those expected. In fact, we find similar results for all the nationality groups of population. Specifically, those individuals practicing some physical exercises have in average less intensity levels of overweight than those individuals who don‟t do physical exercise (except for non EU-15 where the sub-population of people who do not exercise for other reasons than health, has the less important intensity level of overweight). In addition, those who do not practice physical exercise due to health problems not only represent the major proportion of overweight individuals but also they have the most important average overweight value. Concerning the contribution values which explain overweight in each nationality group, the sub-group of individuals who do not practice physical exercises for other reasons than health, have the higher contribution levels. Finally, in Luxembourg, overweight is explained by those Luxembourgish who do not practice physical exercises for other reasons than health problems (31.10%), follow by „natives practicing physical exercises regularly‟ (16.73%) and by „Portuguese not doing physical exercises for other reasons than health‟ (9.05%)
Table 8:OFI values by nationality and education level
Nationaliy Education 𝑶𝑭𝑰 𝑶𝑭𝑰𝟎 𝑪𝒌𝒃𝒌 (in%) 𝑪𝑶𝑭𝑰𝒃𝒌 (in%)
LU None or primary 0.4218 0.6572 28.91 18.24 Secondary 0.3126 0.5383 53.11 33.51 Post-secondary 0.2696 0.5042 17.98 11.35 PT None or primary 0.3596 0.6675 70.88 9.95 Secondary 0.2823 0.5045 27.39 3.84 Post-secondary 0.1385 0.4260 1.73 0.24 None or primary 0.4915 0.7469 29.27 5.45 EU-15 Secondary 0.2944 0.5288 36.70 6.84 Post-secondary 0.2120 0.4175 34.03 6.34 None or primary 0.4045 0.6633 37.81 1.60
Non EU-15 Secondary 0.2588 0.4675 36.55 1.55
Post-secondary 0.2021 0.3922 25.63 1.09
Note: 𝑂𝐹𝐼 measures the intensity of overweight; 𝑂𝐹𝐼0 measures the proportion of the population with any positive degree of overweight; 𝐶𝑘𝑏𝑘 measures the contribution level of each bk-th subgroup to the k-th group; 𝐶𝑂𝐹𝐼𝑏𝑘 measures the contribution levels of each bk-thsubgroup to the global overweight index.
The last two multi-level decompositions are by nationality and educational level (Table 8) and by nationality and type of employment (Table 9). These results show that individuals, for all nationalities, with higher educational level are less affected by overweight. As a consequence, those sub-groups of individuals with (more) higher qualified works present less than average intensity value of overweight.
16
The most important contributions which explain the global overweight problem are the three sub-groups of natives which explains 63.1% (see Table 8) and by Portuguese immigrants with none education level or primary school (9,95%). Regarding the type of employment, manual workmen sub-group for all nationalities has the most important intensity level of overweight. The sub-group of natives inactive is the most explicative one (35.47% of global overweight).
Table 9:OFI values by nationality and type of employment
Nationaliy Activity 𝑶𝑭𝑰 𝑶𝑭𝑰𝟎 𝑪𝒌𝒃𝒌 (in%) 𝑪𝑶𝑭𝑰𝒃𝒌 (in%)
LU Professional 0.2561 0.5461 8.32 5.25 Intermediate 0.2804 0.5012 18.44 11.63 Workman 0.3526 0.6083 12.92 8.15 Manual 0.3897 0.5987 4.10 2.58 Inactive 0.3520 0.5687 56.22 35.47 PT Professional 0.1505 0.5085 1.37 0.19 Intermediate 0.3458 0.4870 7.79 1.09 Workman 0.3331 0.6706 40.15 5.64 Manual 0.3205 0.5879 22.06 3.10 Inactive 0.3344 0.5716 28.62 4.02 Professional 0.2385 0.4687 23.02 4.29 Intermediate 0.2845 0.4893 20.31 3.78 EU-15 Workman 0.3248 0.5378 10.29 1.92 Manual 0.4907 0.6800 6.75 1.26 Inactive 0.3016 0.5392 39.64 7.39 Professional 0.1963 0.3686 8.96 0.38 Intermediate 0.3167 0.5220 12.44 0.53
Non EU-15 Workman 0.2595 0.5144 15.06 0.64
Manual 0.4274 0.5682 18.36 0.78
Inactive 0.2572 0.4907 45.18 1.91
Note: 𝑂𝐹𝐼 measures the intensity of overweight; 𝑂𝐹𝐼0 measures the proportion of the population with any positive degree of overweight; 𝐶𝑘𝑏𝑘 measures the contribution level of each bk-th subgroup to the k-th group; 𝐶𝑂𝐹𝐼𝑏𝑘 measures the contribution levels of each bk-thsubgroup to the global overweight index.
5
Conclusion
This paper proposes a different approach for measuring overweight by differentiating between middle and severs forms of overweight. Fuzzy logic allows constructing an indicator which takes into account the continuous transition from normal weight to obesity. The OFI, initially developed to the measurement of poverty, satisfies the propriety of „sub-group decomposability‟ which permits distinguishing the sub-populations contributions to global overweight. This gives the possibility to policy makers to reduce overall overweight targeting specifically the most affected groups of population.
17
Using the Panel Socio-Economique Liewen zu Lëtzebuerg (PSELL-3) 2008 we measure the extent and the intensity levels of overweight in Luxembourg. Specifically, we concentrate our analysis on the overweight characteristics of four sub-groups of population in Luxembourg: natives, Portuguese immigrants, EU-15 immigrants and immigrants from non EU-15 countries.
The empirical application of the OFI index shows that more than half of residents of Luxembourg suffer from some form of overweight. The different decompositions (by nationality, age, gender, perception of health, level of physical exercise practice, education and occupation) indicate that natives of Luxembourg are those who contribute most to global overweight. Specifically, men are more affected than women, the intensity of overweight is more severe with age and the more educated are less affected by obesity.
6
References
Alkerwi A., Sauvageot N., Donneau A-F., Lair M-L., Couffignal S., Beissel J., Delagardelle C., Wagener Y., Albert A. and Guillaume M., (2010), “First nationwide survey on cardiovascular risk factors in Grand-Duchy of Luxembourg (ORISCAV-LUX)”, BMC Public Health, 10: 468.
Antecol H. and Bedard K., (2006), “Why do immigrants converge to American health status level?”, Demography, vol.43(2), pp.337-360.
Branca F., Nikogosian H. and Lobstein T., (2007), “The challenge of obesity in the WHO European regions and the strategies for response, summary”, Copenhagen: WHO. Cerioli A. and Zani S., (1990), “A Fuzzy Approach to the Measurement of Poverty”, in
Dagum C. and Zenga M. (eds.), Income and Wealth Distribution, Inequality and Poverty, Springer Verlag, Berlin, 272-284.
Cheli B., Ghellini G., Lemmi A. and Pannuzi N., (1994), “Measuring Poverty in the Countries in Transition via TFR Method: The case of Poland in 1990-1991”,
18
Cheli B. and Lemmi A., (1995), “A „Totally‟ Fuzzy and Relative Approach to the Multidimensional Analysis of Poverty”, Economic Notes, 24, 115-134.
Chiappero-Martinetti E., (1994), “A New Approach to Evaluation of Well-Being and Poverty by Fuzzy Set Theory”, Giornale degli economisti e annali di economia, 53, 367-388.
Chiappero-Martinetti E., (2000), “A Multidimensional Assessment of Well-Being Based on Sen‟s Functioning Approach”, Rivista Internazionale di Scienze Sociali, 108(2), pp. 207-239.
Dagum C. and Costa M., (2004), “Analysis and Measurement of Poverty. Univariate and Multivariate Approaches and their Policy Implications. A case of Study: Italy”, in Dagum and Ferrari (Eds). Households Behavior Equivalence Scales, Welfare and Poverty. Springer-Verlag Company.
Dagum C., Gambassi R. and Lemmi A., (1991), “Poverty Measurement for Economies in Transition in Eastern European Countries”, International Multidimensional Poverty Decomposition Scientific Conference, Polish Statistical Association Central Statistical Office, 201-225, Warsaw, 7-9 October.
Finkelstein E.A., Fiebelkorn I.C. and Wang G., (2003), “National Medical Spending Attributable To Overweight And Obesity: How Much, And Who‟s Paying?”, Health affairs, Web exclusive, W3-219.
Fry J. and Finley W, (2005), “The prevalence and cost of obesity in the EU”, Proceedings of the Nutrition Society, vol. 64, pp. 359–362
Hernandez-Quevedo C., Masseria C. and Mossialos E., (2010), “Analyzing the socioeconomic determinants of health in Europe : new evidence for EU-SILC”,
Methodologies and Working papers, Eurostat, Luxembourg.
Hillman G.R., (2005), “Fuzzy Logic and Biomedicine”, UTMB, The University of Texas Medical Branch.
Lemmi A. and Betti G., (2006), Fuzzy set approach to multidimensional poverty measurement, Springer, New York.
Mussard S. and Pi Alperin M.N., (2007), “Multidimensional Poverty Decomposition: A Fuzzy Set Approach”, Statistica & Applicazioni, 5(1), pp. 29-52.
19
Paeratakul S., White A., Williamson D., Ryan D. and Bray G., (2002), “Sex, Race/Ethnicity, Socioeconomic Status, and BMI in Relation to Self-Perception of Overweight”, Obesity Research, Vol. 10 No. 5, pp. 345-350.
Qizilbash M. (2003). “Vague language and precise measurement: the case of poverty”,
Journal of Economic Methodology, 10, pp. 41-58.
Tchicaya A. and Lorentz N., (2010), “ Prévalence du surpoids et de l‟obésité de 1995 á 2008”, Vivre au Luxembourg, CEPS/INSTEAD, Differdange, Luxembourg, Nro 66/2010.
Thill-Ditsch G, (2010), “Regards sur la population par nationalités”, Regards, Statec, Luxembourg, Nro6-2010.
Williams R. and Collins C., (1995), “US Socioeconomic and Racial Differences in Health: Patterns and Explanations”, Annual Review of Sociology, Vol. 21, pp. 349-386.
World Health Organization, (2000), “Obesity: preventing and managing the global epidemic”, Report of a consultation. Monitoring Cardiovascular diseases.
World Health Organization, (2006), “What are the health consequences of being overweight?”, http://www.who.int/features/qa/49/en/index.html
World Health Organization, (2011), “Obesity and overweight”
http://www.who.int/mediacentre/factsheets/fs311/en/
3, avenue de la Fonte L-4364 Esch-sur-Alzette Tél.: +352 58.58.55-801 www.ceps.lu