Deutsches Institut für Wirtschaftsforschung
www.diw.de
Amelie F. Constant • Annabelle Krause •
Ulf Rinne • Klaus F. Zimmermann
Berlin, Dezember 2010
Economic Preferences and Attitudes
of the Unemployed: Are Natives and
Second Generation Migrants Alike?
1088
Opinions expressed in this paper are those of the author(s) and do not necessarily reflect views of the institute.
IMPRESSUM
© DIW Berlin, 2010
DIW Berlin
German Institute for Economic Research Mohrenstr. 58
10117 Berlin
Tel. +49 (30) 897 89-0 Fax +49 (30) 897 89-200 http://www.diw.de
ISSN print edition 1433-0210 ISSN electronic edition 1619-4535
Papers can be downloaded free of charge from the DIW Berlin website: http://www.diw.de/discussionpapers
Discussion Papers of DIW Berlin are indexed in RePEc and SSRN: http://ideas.repec.org/s/diw/diwwpp.html
Economic Preferences and Attitudes
of the Unemployed: Are Natives and
Second Generation Migrants Alike?
∗
Amelie F. Constant Annabelle Krause Ulf Rinne Klaus F. Zimmermann DIW DC, IZA, IZA IZA IZA, DIW Berlin, George Washington University University of Bonn
Abstract
In this paper we study the economic effects of risk attitudes, time preferences, trust and reciprocity while we compare natives and second generation migrants. We analyze an inflow sample into unemployment in Germany, and find differ-ences between the two groups mainly in terms of risk attitudes and positive reciprocity. Second generation migrants have a significantly higher willingness to take risks and they are less likely to have a low amount of positive reciprocity when compared to natives. We also find that these differences matter in terms of economic outcomes, and more specifically in terms of the employment prob-ability about two months after unemployment entry. We observe a significantly lower employment probability for individuals with a high willingness to take risks. Some evidence suggests that this result is channeled through reservation wages and search intensity.
Keywords: Unemployment; Migration; Personality Traits; Risk Attitudes; Time Preferences; Trust; Reciprocity JEL Classification: F22; J15; J61; J64
Corresponding author: Klaus F. Zimmermann, IZA, P.O. Box 7240, D-53072 Bonn. Email: zimmermann@iza.org.
∗Financial support from the German Research Foundation (Deutsche Forschungsgemeinschaft,
DFG) for the project on “Ethnic Diversity and Labor Market Success” in the DFG-Priority Pro-gram “Flexibility in Heterogeneous Labor Markets” (Flexibilisierungspotenziale bei heterogenen
Ar-beitsm¨arkten) is gratefully acknowledged. The IAB (Nuremberg) kindly gave us permission to use
the administrative data employed in this study in the context of theIZA Evaluation Dataset(Caliendo
et al., 2010). We would like to thank Marco Caliendo, Corrado Giuletti, Bas ter Weel and two anony-mous referees for helpful comments and Daniela Geppert for excellent research assistance. All re-maining errors are our own.
1
Introduction
The intensity of the long-standing discussion about migrants’ integration into soci-ety, and in particular into the labor market, has noticeably increased. Based on the observation that migrants experience higher unemployment rates, lower employ-ment rates and lower earnings when compared to natives in many countries (see e.g. Kahanec and Zaiceva, 2009), the debate centers around the question how those native-migrant gaps in economic outcomes can be explained and reduced.
The group of second generation migrants becomes more and more of a con-cern. Over the course of the past century, many countries have accumulated sizeable stocks of migrants and their descendants. Although one would expect differences in economic outcomes between migrants and natives to decrease from one migrant generation to the next, this is generally not the case (see Algan et al., 2010, for ev-idence on France, Germany and the UK). The persistence of native-migrant gaps in economic outcomes is puzzling—in spite of the potential explanations discussed in
the literature1—and it is a serious concern. Successfully addressing this issue
repre-sents one of the major challenges many economies are currently facing. Germany, for instance, will sooner rather than later be faced with the consequences of demo-graphic change. Shortages of skilled workers are already reported by an increasing number of industries. Therefore, qualifying and integrating migrants in general and the second generation migrants in particular becomes even more important.
In this paper we focus on entrants into unemployment in Germany and compare natives and second generation migrants in terms of their labor market reintegration. We follow this approach for two main reasons. The first reason is that, over time, employment biographies have become more unstable and more fragmented, while the German labor market has become more flexible (Eichhorst et al., 2010). Job search, whether successful or not, is of critical importance. Short periods of unem-ployment incurred while transitioning from one job to the next are nowadays more the rule than the exception. Research on unemployment duration and frictions in the labor market has become even more pertinent in light of the recent economic crisis. Second, Germany represents a prime example of a country with a sizeable stock of second generation migrants and persistent gaps in economic outcomes be-tween natives and second generation migrants. In 2007, almost 19 percent of the
German population (or 15.4 million individuals) had a migration background (R¨uhl,
2009). Among them, about one third were born in Germany, and are thus second generation migrants. Today’s second generation migrants are mostly the offspring
1Potential explanations are e.g. based on ethnic or institutional discrimination (Kaas and Manger,
2010; Kogan, 2007), on differences in ethnic or human capital (Kalter and Granato, 2007), and on concepts of ethnic identity (Heath et al., 2008; Blackaby et al., 2005; Constant and Zimmermann, 2009).
of the so-called guest workers.2 In light of its post-war economic boom, Germany’s
migration policy had focused on the recruitment of low-skilled foreign labor, mainly from Southern Europe, the guest workers. By 1973, however, and with the economic crisis, the influx of guest workers from Southern Europe had ceased. The persistent and substantial gaps between natives and the first or the second generation migrants in Germany are manifested in a number of economic outcomes, such as unemploy-ment rates. Since the early 1970s, the unemployunemploy-ment rates of natives and migrants have been drifting apart. In 2008, the average unemployment rate of migrants was more than twice as high as that of natives (18.1 percent vs. 8.0 percent, Statistik der
Bundesagentur f¨ur Arbeit, 2009). This is partially due to differences in job search
behavior. For instance, Uhlendorff and Zimmermann (2006) show that unemployed migrants find less stable positions than natives with the same observable and unob-servable characteristics. Moreover, migrants need more time to find jobs. Constant et al. (2009) also analyze the labor market reintegration of migrants in Germany in comparison to natives. They find that “separated” migrants need more time to find
employment.3 This finding seems to be related to the migrants’ exerted search effort
and to their reservation wage levels.
We analyze the economic preferences and attitudes of unemployed second gen-eration migrants in Germany, and we compare them with unemployed native Ger-mans with regard to risk attitudes, time preferences, trust and reciprocity. These are traits that lately have garnered the attention of economists. The recent economic literature highlights the importance of “non-cognitive” skills (see Heckman and Ru-binstein, 2001, for an early contribution on this topic and Borghans et al., 2008, for a recent overview). More importantly, non-cognitive skills can influence economic outcomes above and beyond factors such as human capital or household composi-tion. However, while the latter determinants are frequently analyzed and relatively robust findings have been established, research on preferences and attitudes—and more generally on personality traits—and their influence on economic outcomes has started only recently. Further research is needed in this area: for instance, if there are non-cognitive differences between natives and second generation migrants who become unemployed, one can (and should) take such differences into account—e.g. when designing active and passive labor market policies. A better understanding of these factors can certainly help improve the labor market integration of second generation migrants. Recent contributions that explore the link between person-ality traits, unemployment and job search include e.g. Caliendo et al. (2010) and McGee (2010), who investigate the influence of locus of control, as well as Uysal and Pohlmeier (2010), who analyze the role of the “Big Five” taxonomy to classify personality traits.
2Other large groups of migrants in Germany are ethnic Germans from Eastern Europe, recent
immigrants from the EU and accession countries, and humanitarian migrants.
3Separated migrants have a strong ethnic identity of the home country and a weak ethnic
Our research question is whether and how unemployed second generation mi-grants differ from unemployed natives in terms of economic preferences and at-titudes. If such differences exist, they may explain at least part of the persistent native-migrant gap in economic outcomes. We base our analysis on rich survey data
of an inflow sample into unemployment from the IZA Evaluation Dataset(Caliendo
et al., 2010). We show that there are indeed differences between the two groups with respect to these characteristics. Moreover, non-cognitive differences appear to matter in terms of job search and labor market reintegration. Specifically, we first find that unemployed second generation migrants have a significantly higher will-ingness to take risks and that they are less likely to have a low amount of positive reciprocity when compared to natives. Second, we also find a significantly lower employment probability two months after unemployment entry for individuals with a high willingness to take risks. However, the significantly lower employment prob-ability of second generation migrants remains rather stable across specifications.
Our contribution to the literature is that we provide novel and direct evidence on the relationship between economic preferences, attitudes and labor market rein-tegration of natives and second generation migrants. In this paper we only consider early exits from unemployment. These exits are very important because they prevent individuals from becoming long-term unemployed. It is widely accepted that longer spells of unemployment invoke a number of undesired consequences such as depre-ciation of skills, qualifications and capabilities (see e.g. Edin and Gustavsson, 2008), and a number of dire ramifications such as a thin labor market with fewer available jobs which, in turn, perpetuates a downward spiral of continuing unemployment (Pissarides, 1992), as well as stigmatization and unhappiness.
This paper is organized as follows. Section 2 discusses the literature on the rela-tionship between preferences, attitudes and economic outcomes. After a description of our data and the sample in Section 3, empirical evidence on economic preferences and attitudes of unemployed second generation migrants in comparison to natives is presented in Section 4. Section 5 analyzes the relationship between non-cognitive characteristics and labor market reintegration. Finally, Section 6 concludes.
2
Preferences, Attitudes and Economic Outcomes
In this paper we compare unemployed natives and unemployed second generation
migrants with respect to four non-cognitive traits, namely a) risk attitudes, b) time
preferences, c) trust and d) reciprocity. We thus study the role of these four traits
in determining economic outcomes in the labor market, especially in the job search process. We also discuss potential differences in the distribution of these character-istics between natives and migrants (and second generation migrants, if applicable) and briefly review the existing empirical evidence.
This does not imply that we rule out any demand side effects that could very well be simultaneously present. For instance, if employers prefer employees with certain inclinations and attitudes, this would affect the job offer arrival rate or the wage offer distribution. The presence of such effects would, further, also be reflected in the job seekers’ search intensity and reservation wages.
2.1
Risk Attitudes
Almost every economic decision involves risk. Acting in an environment of uncer-tainty, the willingness to take risks influences the decisions which are taken as well as the resulting economic outcomes. Examples include investment decisions (stocks, home ownership) or decisions about educational attainment.
Job search is also a risky activity. In the standard model of job search (McCall, 1970; Mortensen, 1970), a job seeker decides at a given point in time about whether to accept a job offer. He or she thus faces a trade-off between the current wage that is offered and the expected future gains of continued search. While this decision is made under uncertainty, the standard model assumes risk neutral individuals. If this assumption is relaxed (see e.g. Pissarides, 1974), it can be shown that more risk averse individuals will terminate the job search at an earlier stage because they are less selective and will thus spend less time in unemployment—at the cost of a lower expected wage conditional on employment. The more risk averse a given job seeker is, the less value he or she attaches to expected, yet uncertain, future gains of search. Consequently, a higher risk aversion leads to a lower reservation wage. Empirical evidence on the latter relationship can be found in Pannenberg (2010), who shows that risk aversion and reservation wages are negatively correlated.
Migration is a risky activity, too. The prior is that individuals who are relatively more willing to take risks are more likely to migrate. A recent study on intra-German mobility (Jaeger et al., 2010) seems to concur. However, there is no clear-cut the-oretical predictions with respect to risk attitudes of international migrants. On the one hand, standard migration models predict a lower risk aversion for migrants com-pared to the native population (Heitmueller, 2005). On the other hand, in as far as
risk aversion is correlated with cognitive ability,4 self-selection models of migration
(Borjas, 1987; Chiswick, 1978) predict a differentiated distribution of risk aversion among migrants: high-skilled migrants are more willing to take risks, while low-skilled migrants are more risk averse than natives. Depending on the distribution of the cognitive abilities of migrants and of their risk attitudes in both the host and home country, the average migrant may be more or less willing to take risks. Finally, the distribution of risk attitudes in the host and home country may be fundamentally different, e.g. because of cultural differences.
4Dohmen et al. (2010) find that risk aversion systematically varies with cognitive ability.
It is therefore an empirical question whether, and to what extent, the risk atti-tudes of migrants and natives differ. Bonin et al. (2009) use a representative sample of the population in Germany and show that first generation migrants are more risk averse than native Germans. The authors provide a few possible explanations of this finding. First, the migration decision of guest workers involved a rather low amount of risk, since they were given a job immediately upon arrival in Germany. Second, migrants with a higher willingness to take risks might have already returned to their country of origin, or may have migrated to other countries. Third, migrants in Germany might in general be rather low-skilled and thus relatively more risk averse than the average migrant in other destination countries. However, Bonin et al. (2009) also find that the difference between natives and migrants disappears in the second generation migrants. In another study, Bonin et al. (2006) find that when German migrants adapt to the attitudes, culture and behavior of native Ger-mans the immigrant-native gap in risk proclivity closes, but when migrants remain committed to their home country’s culture the gap is preserved. As risk attitudes are behaviorally relevant, and vary by ethnic origin, these results could explain differ-ences in the economic assimilation of immigrants.
2.2
Time Preferences
Economic decisions are frequently characterized by immediate costs and delayed benefits. An example is saving for retirement. Whenever such a scenario arises, time preferences are relevant. The degree to which people discount the future obviously matters. In this context, a growing literature has challenged the conventional view; hyperbolic discounting turns out to be an important empirical phenomenon. In this framework, agents are allowed to discount time-inconsistently (see e.g. Laibson, 1997). Such behavior also seems to matter for fertility decisions (Wrede, 2010).
Time preferences are a critical factor in the job search process. Searching for a job is an unpleasant activity, where costs arise immediately, and benefits materialize only in the future. However, the effect of impatience on exit rates from unemploy-ment is theoretically unclear: more impatient job seekers search less intensively, but they also set lower reservation wages (DellaVigna and Paserman, 2005). It is thus an empirical question which of the two opposing effects dominates. DellaVigna and Paserman (2005) and Paserman (2008) both support the model of hyperbolic time preferences. Hyperbolic job seekers are particularly sensitive to the direct cost of searching and devote (too) little search effort. The latter study, however, detects heterogeneity in this regard for US job seekers; whereas the degree of hyperbolic discounting for low and medium wage workers is substantial, high wage workers exhibit only a moderate degree of short-run impatience.
The decision to migrate also entails short-run costs and long-run benefits, and therefore time preferences matter in this regard. The typical expectation is that more patient individuals are more likely to migrate, other things equal—at least
from the source country’s perspective. From the destination country’s perspective, similar arguments hold as in the case of migration and risk attitudes. For instance,
if time preferences are correlated with cognitive abilities,5 self-selection models of
migration predict a differentiated distribution of time preferences among migrants. Moreover, the distribution of time preferences could potentially be very different in the source and destination country.
Gibson and McKenzie (2009) examine the source country’s perspective, and more precisely three Pacific countries (Tonga, Papua New Guinea and New Zealand). They show that a high-skilled individual’s decision to migrate is strongly associated with the degree of patience. More patient individuals are significantly more likely to
migrate.6
2.3
Trust
Interactions among humans usually involve, and are based on, trust. From an indi-vidual’s perspective, trust captures something fundamental about the way that other people are approached. Interactions often involve vulnerability to betrayal. Trust is an important factor whether an individual enters those situations at all, and how he or she behaves in them (Dohmen et al., 2006). More specifically, economic transac-tions are typically characterized by incomplete contracts, and thus trust plays a key role in this context.
The literature generally agrees that informal job search channels are popular and also effective methods (Granovetter, 1973, 1974; Holzer, 1988; Blau and Robins, 1990; Montgomery, 1991). Such methods have the advantage of being relatively less costly and can provide comparatively reliable information about jobs. During job search, both the access to informal channels as well as the actual use of these channels are central to future employment success. Informal search involves to some extent an implicit and incomplete contract, and it draws on the individuals’ network or social capital. Defining social capital as the “density of trust existing within a group” (Paldam and Svendsen, 2000), trusting behavior positively influences the
size as well as the quality of a person’s social network.7 Finally, informal search
also relies on trust between the involved parties. The job seeker has to trust his or her social contact—otherwise, he or she would not ask this friend or relative for assistance in the first place.
Although typically it is the individual who migrates from one country to another, recent migration research takes into account the importance of the family and
house-5Dohmen et al. (2010) find that time preferences are systematically correlated with cognitive
ability. Individuals with higher cognitive ability are significantly more patient in their experiment.
6Gibson and McKenzie (2009) measure patience with a binary variable. It indicates whether
individuals prefer $1,100 in one year compared to $1,000 today.
7See e.g. Caliendo et al. (2010) for empirical evidence on the relationship between network size
hold as the relevant decision-making unit (see e.g. Massey et al., 2005; Rabe, 2010). The family often supports the migrant around the time of his or her migration. In return, the migrant sends remittances back home to them. This implicit contract involves an informal system of exchange, and it is obviously based to a large extent on trust. Therefore—at least in such circumstances—trust can be an important de-terminant of migration. However, the question whether natives or migrants exhibit a higher degree of trust is uncertain. Most likely, the distribution of trust in the host country and in the country of origin are very different. In fact, Butler et al. (2009) document systematic differences in the distribution of trust across 26 Euro-pean countries.
Empirical evidence on potential differences between natives and migrants in the degree of trust is scarce. An exception is Hooghe et al. (2009), who find in a sample of 20 European countries that individuals who were born abroad are significantly less trustful than individuals who were born in the respective country of residence. Dinesen and Hooghe (2010) find that second generation migrants exhibit similar levels of trust to natives than the first generation do. A process of adaptation or assimilation thus seems to take place over the migrant generations.
2.4
Reciprocity
Many people deviate from purely self-interested behavior in a reciprocal manner
(Fehr and G¨achter, 2000). This has two implications: a) individuals may react in
response to nice behavior much nicer than standard models would predict (positive
reciprocity), and b) their response to unkind actions may be retaliation or
punish-ment (negative reciprocity). This, of course, also matters for economic outcomes. Examples include the provision of public goods or, more generally, how social norms are established and maintained.
Reciprocity also influences labor market outcomes. Dohmen et al. (2009) find, among other things, that positively reciprocal individuals are significantly less likely to be unemployed. In contrast, negatively reciprocal individuals are significantly more likely to be unemployed. Those findings can be explained as follows: whereas positive reciprocity may help to establish successful long-term employment relation-ships, negative reciprocity may lead to an early termination of such relationships.
When comparing natives’ and migrants’ degree of reciprocity, there are no clear theoretical predictions and empirical evidence is scant. Cox and Orman (2010), however, provide experimental evidence. The authors highlight the interaction of trust and reciprocity in their study. They show that people are in general reciprocal, and that this may lead to a self-fulfilling prophecy for migrants. As migrants are trusted less than natives (even by other migrants), they react with (negative) recip-rocal behavior in response. Therefore, they indeed appear to be less trustworthy. The lack of trust may thus hinder migrants’ assimilation or integration with the host country’s society.
3
Data
We use data from theIZA Evaluation Dataset(Caliendo et al., 2010) and concentrate
on one of its two pillars. Namely, a survey of almost 18,000 individuals who entered unemployment between June 2007 and May 2008. Our analysis is based on the first
wave of the survey, which took place about two months after unemployment entry.8
This has the advantage that individual characteristics, attitudes and preferences are unlikely to have changed in response to unemployment entry. Another advantage
of our data is the specific focus on entrants into unemployment. The IZA Evaluation
Dataset is thus very appropriate for studying the processes of job search and labor market reintegration. Similar household surveys are generally designed to be rep-resentative of the whole population (e.g. the German Socio-Economic Panel Study, GSOEP), which has an important drawback when studying unemployed individuals because sample sizes decrease substantially.
Our data address a large variety of topics. The questions cover many impor-tant individual characteristics, which are rarely available for economic research but have been shown to influence economic outcomes nonetheless. Among these char-acteristics are the four economic preferences and attitudes that this paper focuses on. These characteristics have been elicited for individuals who were born in
Ger-many, in order to keep sample attrition tractable.9 This explains why we compare
the second generation migrants with natives and not the first generation migrants. Moreover, the questions for these characteristics were only included for individuals who entered unemployment in June 2007, October 2007 and February 2008. This reduces the size of our initial sample to fewer than 4,000 individuals.
For our analysis, we select individuals who are between 18 and 55 years old at the time they enter unemployment. We exclude individuals with missing infor-mation on important characteristics. After applying these criteria, our final sample consists of 2,875 individuals. Among those there are 2,609 natives and 266 second
generation migrants. We define second generation migrants to include a)
individ-uals who are German-born but do not have German citizenship, and b) individuals
who are German-born but at least one of their parents is not German-born. Com-pared to the entire German population, second generation migrants are thus slightly
over-represented in our sample of entrants into unemployment.10
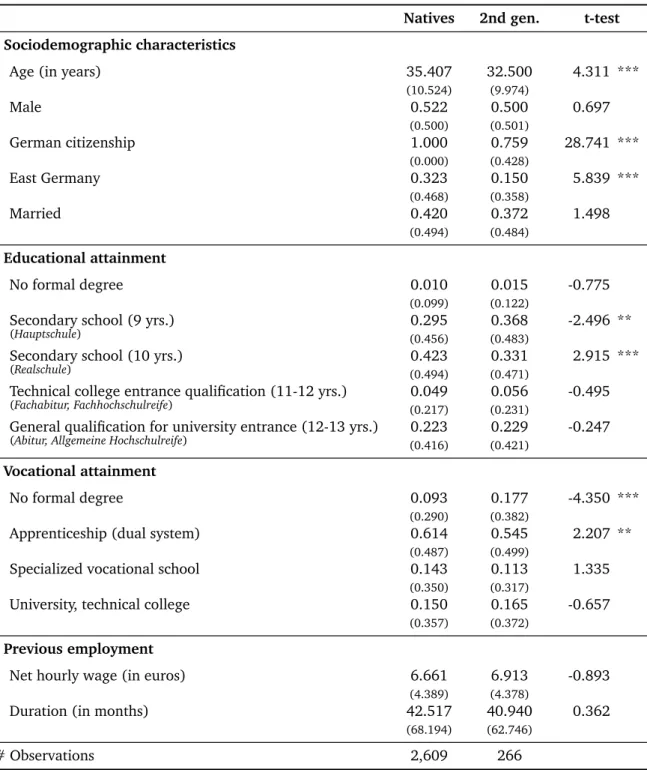
Table 1 displays descriptive statistics of our sample of entrants into unemploy-ment, separately for natives and second generation migrants. Second generation
8The survey consists of two additional rounds of interviews. Respondents are interviewed again
one year and three years after unemployment entry, respectively.
9The entry cohorts into unemployment which are analyzed in our paper have been surveyed in an
(additional) intermediate wave of interviews (Caliendo et al., 2010). Sample attrition is therefore of particular concern for this group.
10The share of second generation migrants in the German population is about 7 percent (R¨uhl,
migrants are significantly younger than natives—on average about three years. The gender distribution is similar: in both groups, slightly less than half of the sample are females. Obviously, every native in our sample has German citizenship, but this is also the case for the majority of second generation migrants. Only about one in four individuals in this group has citizenship other than German. This can be explained by the fact that our sample, by construction, only includes individuals who were born
in Germany.11 The share of natives living in East Germany is significantly larger than
the fraction of second generation migrants in this part of Germany. A more de-tailed assessment of the individuals’ migration background reveals that the majority of second generation migrants in West Germany has a migration background. While the migration background of the West German migrants can be traced back to the so-called guest worker countries, the origins of the second generation migrants in
East Germany are mainly in Central and Eastern European countries.12 The share of
married individuals is similar for both natives and second generation migrants. With respect to the educational and vocational attainment of natives and sec-ond generation migrants, two differences stand out. First, the fraction of secsec-ond
generation migrants with a degree from a 9-year secondary school (Hauptschule) is
significantly larger than the fraction of natives. In contrast, a significantly larger
proportion of natives have a 10-year secondary school degree (Realschule) than the
second generation migrants. Second, the share of second generation migrants with-out a formal vocational degree is substantial and significantly larger than that of natives. Almost one in five migrants has no such degree, while it is only about one in ten natives with no degree. On the other hand, the fraction of natives with a vocational degree obtained through the apprenticeship system is significantly larger when compared to second generation migrants. These two differences with respect to the educational and vocational attainment are most likely related. It appears that
completingHauptschuleoften does not provide the necessary prerequisites to obtain
an apprenticeship position or, more generally, to enter vocational education.13
These differences in the human capital endowment between natives and second generation migrants are, however, not reflected in characteristics of the previous employment position. Prior to entering unemployment both groups were earning
11The German citizenship law was reformed in 2000. Before the reform, primarily the principle of
descent (ius sanguis) and naturalization after at least 15 years of residence were the possibilities of
obtaining German citizenship. After the reform also the law of soil (ius soli) is available to immigrant children born in Germany, and years of residence required to apply for naturalization were reduced to eight (with exceptions, such as three years for those with a German spouse). For a more detailed description and analysis of the naturalization process in Germany, see Zimmermann et al. (2009).
12We assign the origin of second generation migrants through their country of citizenship (if they
do not have German citizenship) or through their parents’ country of birth. If both parents were born abroad but in different countries, we take the father’s country of birth (Card et al., 1998; Jonsson, 2007). Guest worker countries include Turkey, former Yugoslavia, Italy, Spain and Greece. Central and Eastern European countries include Poland, the former USSR, the former CSSR and Romania.
13See e.g. Worbs (2003) for more details. She also stresses the importance of the increasing
similar hourly wages. Also the duration of previous employment differs, on average, by only about one month between the two groups.
Table 1: Descriptive Statistics I (Selected Variables)
Natives 2nd gen. t-test Sociodemographic characteristics
Age (in years) 35.407 32.500 4.311 ***
(10.524) (9.974) Male 0.522 0.500 0.697 (0.500) (0.501) German citizenship 1.000 0.759 28.741 *** (0.000) (0.428) East Germany 0.323 0.150 5.839 *** (0.468) (0.358) Married 0.420 0.372 1.498 (0.494) (0.484) Educational attainment No formal degree 0.010 0.015 -0.775 (0.099) (0.122)
Secondary school (9 yrs.) 0.295 0.368 -2.496 **
(Hauptschule) (0.456) (0.483)
Secondary school (10 yrs.) 0.423 0.331 2.915 ***
(Realschule) (0.494) (0.471)
Technical college entrance qualification (11-12 yrs.) 0.049 0.056 -0.495
(Fachabitur, Fachhochschulreife) (0.217) (0.231)
General qualification for university entrance (12-13 yrs.) 0.223 0.229 -0.247
(Abitur, Allgemeine Hochschulreife) (0.416) (0.421)
Vocational attainment
No formal degree 0.093 0.177 -4.350 ***
(0.290) (0.382)
Apprenticeship (dual system) 0.614 0.545 2.207 **
(0.487) (0.499)
Specialized vocational school 0.143 0.113 1.335
(0.350) (0.317)
University, technical college 0.150 0.165 -0.657
(0.357) (0.372) Previous employment
Net hourly wage (in euros) 6.661 6.913 -0.893
(4.389) (4.378)
Duration (in months) 42.517 40.940 0.362
(68.194) (62.746)
# Observations 2,609 266
Source: IZA Evaluation Dataset, own calculations.
Note:Sample of individuals who were born in Germany. Second generation migrants either do not have German citizen-ship or at least one of their parents is not German-born. Standard deviations in parentheses.
4
Are Natives and Second Generation Migrants Alike?
Unemployed natives differ from unemployed second generation migrants mainly with regard to their average age, place of residence, and human capital endowment. These differences can be relevant when designing appropriate policies and measures that aim to provide a quick return into employment. Besides these characteristics, there are also a number of preferences and attitudes which appear to be relevant in this context. Unemployed natives and unemployed second generation migrants might very well differ in this respect.
We thus analyze four economic preferences and attitudes which are available in
our data. They are obtained from the IZA Evaluation Datasetand based on the
fol-lowing questions (translated from German):14
• Risk attitudes: How do you estimate yourself personally: are you generally
pre-pared to take risks or do you try to avoid risks?
• Time preferences: How do you regard yourself as an individual: are you someone
who generally gets impatient or someone who always has a lot of patience?
• Trust: How do you regard yourself as an individual: are you someone who
gener-ally trusts others or are you someone who does not trust others?
• Reciprocity: To what extent does the following statement apply to you? I am
pre-pared to accept costs to help someone who has helped me previously.
Responses to the questions on risk attitudes, time preferences and trust are mea-sured on an 11 point scale, which ranges in each case from 0 to 10. An answer of 0 indicates complete unwillingness to take risks, complete impatience, and com-plete unwillingness to trust others, respectively. An answer of 10 indicates comcom-plete willingness to take risks, complete patience, and complete willingness to trust
oth-ers, respectively. The wording of the questions in theIZA Evaluation Dataset is very
similar to questions in other large and representative surveys (e.g. European Social Survey, ESS, or German Socio-Economic Panel, GSOEP), and at least some of the
questions have been experimentally validated.15 In the following, we use three
al-ternative measures for each of the three characteristics: a) actual responses on the
11 point scale (“raw index”), b) a binary indicator for a value of 6 or higher on
the 11 point scale (“binary indicator”), and c) a classification into three categories,
where values of 3 and lower compose the lowest category, values of 4, 5 and 6 the in-termediate category, and values of 7 and higher the highest category on the 11 point
scale (“three categories”).16
14The interviews were generally conducted in German, but depending on the language skills of the
interviewee also in Turkish and Russian.
15The question about time preferences is the same as in the GSOEP. See e.g. Dohmen et al. (2005)
for an experimental validation of a similar risk measure included in the GSOEP.
16See e.g. Jaeger et al. (2010), who also use this binary indicator for risk attitudes based on the
The response to the question regarding reciprocity is measured on a 7 point scale, ranging from 1 to 7. An answer of 1 indicates that the statement does not apply at all, and 7 means that the statement applies perfectly. Importantly, the question only addresses positive reciprocity, i.e. whether someone reacts in response to nice behavior with nice actions. Also note that the statement explicitly addresses whether
the respondent would incur costs to be positive reciprocal.17 Again, we use three
alternatives measures: a) actual responses on the 7 point scale (“raw index”), b) a
binary indicator for a value of 5 or higher on the 7 point scale (“binary indicator”),
and c) a classification into three categories, where values of 3 and lower compose
the lowest category, values of 4 and 5 the intermediate category, and values of 6 and 7 the highest category on the 7 point scale (“three categories”).
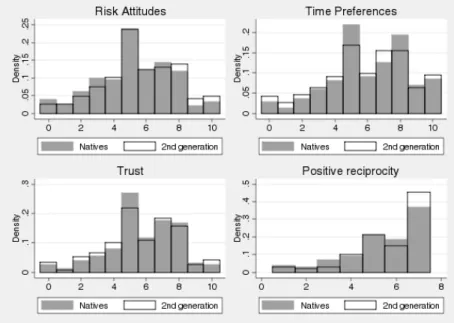
Figure 1 illustrates the distributions of the four preferences and attitudes in our sample. Each characteristic is measured by the raw index. We juxtapose the re-spective distribution among natives to that among second generation migrants. The distributions of risk attitudes look fairly similar, at least at first glance. In both groups, about one in four responses takes the value of 5, indicating an intermediate willingness to take risks. Extreme values at both ends of the distribution are rarely picked by the respondents, i.e. in both distributions the values 0 and 1 as well as 9 and 10 have very little mass. However, it appears to be the case that there is more mass at higher values of the distribution of risk attitudes among second generation migrants. In particular, the value of 8 is picked more frequently.
When comparing the distributions of time preferences, they appear similar for values lower than 5. In both groups, the value of 2 is chosen the least. Natives have a peak at 5 and 8, whereas the migrants’ responses are more smoothly distributed in the higher segments. The values 5, 7 and 8 are rather frequently selected. The distri-butions for trust look relatively similar to the distridistri-butions of time preferences. Na-tives have a peak at the value of 5. This is also the value that the second generation migrants pick most frequently, but not as often as natives. Similar to risk attitudes, extreme values such as 1 and 2 rarely belong to the responses of the two groups. In contrast to the first preferences and attitudes, positive reciprocity is measured on a 7 point scale. Both distributions have more mass at higher values. However, second generation migrants respond more frequently with the highest value of 7 and less frequently with the lowest three values, compared to native Germans.
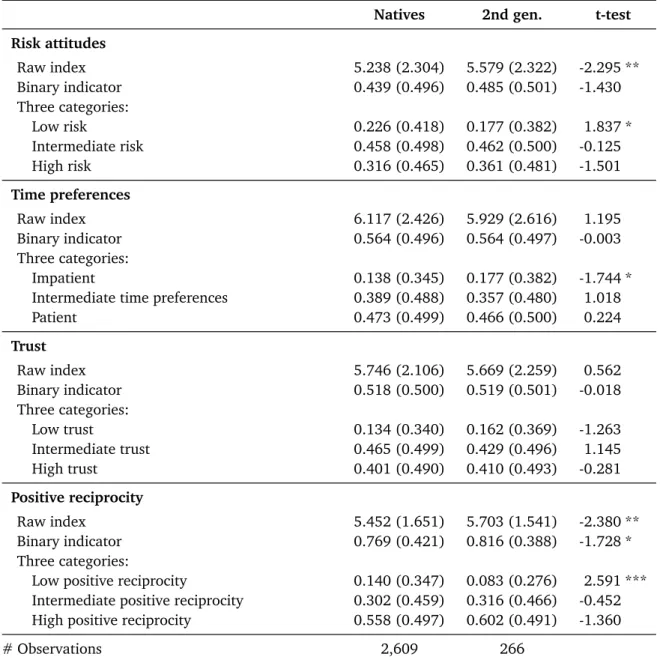
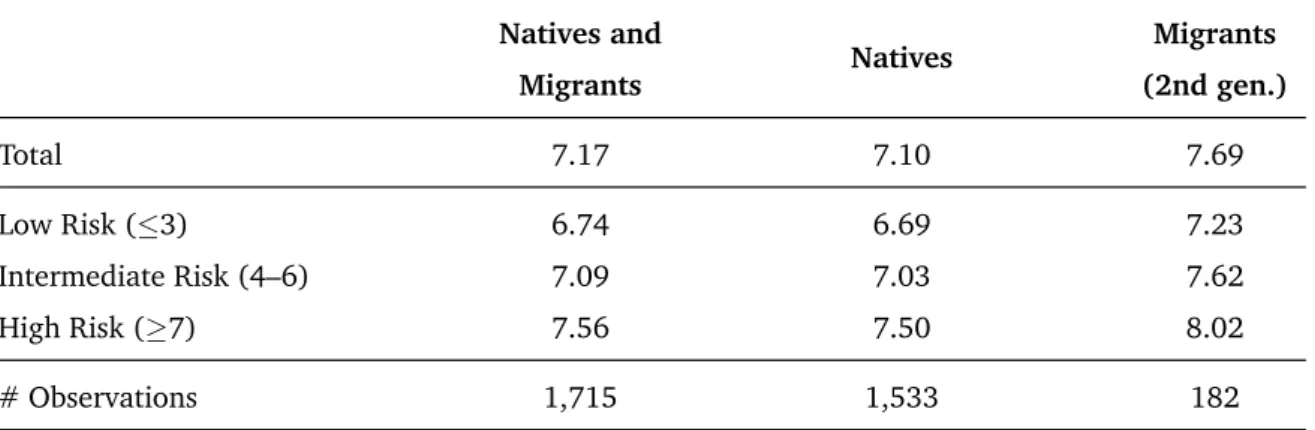
Table 2 summarizes information about all three measures of the four preferences and attitudes. It displays the means for the raw index, the binary indicator and the three categories (in each case separately for natives and second generation mi-grants). Starting with risk attitudes, the raw index and the low risk category indicate that natives are significantly more risk averse than second generation migrants. The binary indicator also points to this result. However, the difference is not significant. This result seems somewhat surprising, taking into account that second generation
Figure 1: Preferences and Attitudes of Natives and Second Generation Migrants
Source: IZA Evaluation Dataset, own calculations.
Note:Sample of individuals who were born in Germany. Second generation migrants either do not have German citizen-ship or at least one of their parents is not German-born. Risk attitudes, time preferences and trust are measured on an 11 point scale (from 0 to 10); reciprocity is measured on a 7 point scale (from 1 to 7).
migrants are relatively less educated than natives. Therefore, it is at odds with the hypothesis that higher educated individuals are more willing to take risks.
With respect to time preferences, there is a significant difference between na-tives and second generation migrants in the lowest of the three categories. In the latter group, a significantly larger fraction is relatively impatient. This finding is also reflected in most other numbers, although those differences are not significant. The numbers for trust display no significant differences between the distributions of the two groups. None of the two groups shows a distinct tendency regarding their level of trust when compared to the other group. Finally, the three measures for positive reciprocity show clear differences between natives and second generation migrants. They indicate that second generation migrants have a significantly larger extent of positive reciprocity than natives. When differentiating among the three categories of positive reciprocity, there is a significant difference in the category indicating a low amount of positive reciprocity. A significantly larger share of natives has a relatively low amount of positive reciprocity when compared to second generation migrants in our sample.
Table 2: Descriptive Statistics II (Economic Preferences and Attitudes)
Natives 2nd gen. t-test Risk attitudes Raw index 5.238 (2.304) 5.579 (2.322) -2.295 ** Binary indicator 0.439 (0.496) 0.485 (0.501) -1.430 Three categories: Low risk 0.226 (0.418) 0.177 (0.382) 1.837 * Intermediate risk 0.458 (0.498) 0.462 (0.500) -0.125 High risk 0.316 (0.465) 0.361 (0.481) -1.501 Time preferences Raw index 6.117 (2.426) 5.929 (2.616) 1.195 Binary indicator 0.564 (0.496) 0.564 (0.497) -0.003 Three categories: Impatient 0.138 (0.345) 0.177 (0.382) -1.744 *
Intermediate time preferences 0.389 (0.488) 0.357 (0.480) 1.018
Patient 0.473 (0.499) 0.466 (0.500) 0.224 Trust Raw index 5.746 (2.106) 5.669 (2.259) 0.562 Binary indicator 0.518 (0.500) 0.519 (0.501) -0.018 Three categories: Low trust 0.134 (0.340) 0.162 (0.369) -1.263 Intermediate trust 0.465 (0.499) 0.429 (0.496) 1.145 High trust 0.401 (0.490) 0.410 (0.493) -0.281 Positive reciprocity Raw index 5.452 (1.651) 5.703 (1.541) -2.380 ** Binary indicator 0.769 (0.421) 0.816 (0.388) -1.728 * Three categories:
Low positive reciprocity 0.140 (0.347) 0.083 (0.276) 2.591 ***
Intermediate positive reciprocity 0.302 (0.459) 0.316 (0.466) -0.452
High positive reciprocity 0.558 (0.497) 0.602 (0.491) -1.360
# Observations 2,609 266
Source: IZA Evaluation Dataset, own calculations.
Note: Sample of individuals who were born in Germany. Second generation migrants either do not have German citi-zenship or at least one of their parents is not German-born. Risk attitudes, time preferences and trust are measured on an 11 point scale (from 0 to 10); reciprocity is measured on a 7 point scale (from 1 to 7). Theraw indexdisplays those scales; thebinary indicatorindicates a value of 6 or higher (11 point scale) or a value of 5 or higher (7 point scale); and thethree categoriesreflect values of 3 and lower (3 and lower) for the lowest category, values of 4, 5 and 6 (4 and 5) for the intermediate category, and values of 7 and higher (6 and 7) for highest category on the 11 point scale (7 point scale). Standard deviations in parentheses.
5
Do Differences Make a Difference?
To analyze the differences in preferences and attitudes between natives and second generation migrants in more detail and to assess their impact on economic outcomes, we perform a multivariate regression analysis in which we control for differences in other observable characteristics. The outcome variable in this analysis is being (self-)employed at the first interview, which took place on average two months after
unemployment entry.18
One issue deserves further attention before we continue with our analysis. Our sample of entrants into unemployment is subject to a dynamic endogenous selection process. This may have consequences for the economic attitudes and preferences at the core of our interest, which may be affected by the incidence of unemployment as well as the unemployment duration. It thus implies a potential problem of reverse causality, as individuals may adjust preferences and attitudes, e.g. in response to un-successful job search. However, we are confident that in our case, such effects are small—if present at all. First, interviews were conducted very shortly after unem-ployment entry. As we expect preferences and attitudes to be stable, at least in the short-run, we do not expect substantial adjustments in this regard over a period of two months. Second, all individuals were interviewed at a similar point in time rel-ative to unemployment entry. Hence, any potential adjustments should be similarly
present for all individuals in our data.19
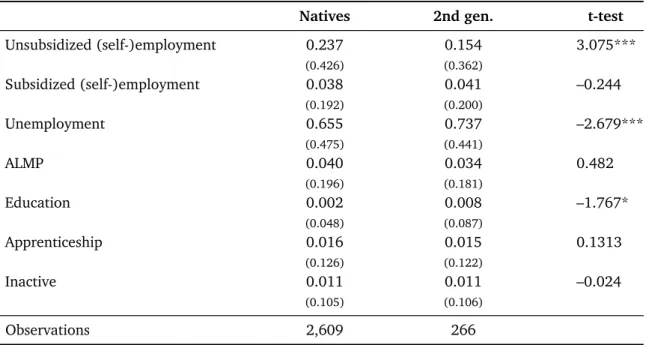
Table 3 summarizes the status at the first interview for natives and second gener-ation migrants in our sample. Our subsequent outcome variable differs significantly between the two groups. A larger proportion of natives than second generation migrants had already found employment when the first interview took place. No significant difference is found for subsidized (self-)employment. Second generation migrants are significantly more likely to be unemployed. Furthermore, a significantly larger share of second generation migrants is enrolled in education. This might be related to the fact that they are, on average, younger than natives. Similar shares of individuals in both groups either participated in active labor market policy (ALMP), were in an apprenticeship, or were inactive when the first interview took place.
18When we use an indicator for regular employment at the first interview as dependent variable
(i.e. not additionally including self-employment), results remain virtually the same.
19Caliendo et al. (2010) argue along similar lines when they discuss the issue of potential reverse
Table 3: Descriptive Statistics III (Status at the First Interview)
Natives 2nd gen. t-test
Unsubsidized (self-)employment 0.237 0.154 3.075*** (0.426) (0.362) Subsidized (self-)employment 0.038 0.041 –0.244 (0.192) (0.200) Unemployment 0.655 0.737 –2.679*** (0.475) (0.441) ALMP 0.040 0.034 0.482 (0.196) (0.181) Education 0.002 0.008 –1.767* (0.048) (0.087) Apprenticeship 0.016 0.015 0.1313 (0.126) (0.122) Inactive 0.011 0.011 –0.024 (0.105) (0.106) # Observations 2,609 266
Source: IZA Evaluation Dataset, own calculations.
Note:Sample of individuals who were born in Germany. Second generation migrants either do not have German citizen-ship or at least one of their parents is not German-born. Standard deviations in parentheses.
Mean difference: *** significant at 1%; ** significant at 5%; * significant at 10%.
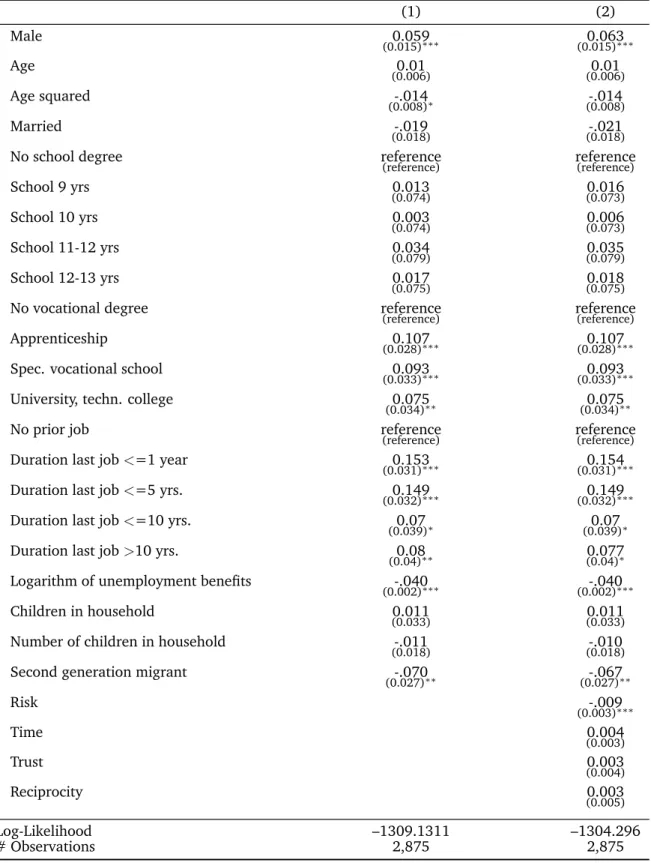
Table 4 presents the results of our baseline probit regression, where the depen-dent variable indicates whether the individual is employed at the first interview. The first column reports estimates without including preferences and attitudes; in the second column they are included. Male individuals are significantly more likely to be employed at the first interview in both regressions. The coefficients on age, mari-tal status and schooling have the expected signs, but are in general not significantly different from zero. In contrast, the variables indicating different categories of vo-cational attainment have a strong and significant impact on the probability of being employed at the first interview. Interestingly and somewhat surprisingly, individuals who have completed an apprenticeship or graduated from a specialized vocational school have an even higher probability of being employed than university graduates. It should, however, be kept in mind that only two months since unemployment entry have passed. This picture might change over time.
The duration of last employment also plays a large role in explaining reemploy-ment patterns in our data. Respondents with a former job duration of less than five years have a higher employment probability than individuals with more than five years. A potential explanation might be that individuals who have been previously employed for relatively shorter durations are more flexible and thus faster in finding new jobs, which might also be related to lower expectations for future employment. The amount of unemployment benefits and the probability of being employed at the
first interview show a significantly negative relationship: the higher the amount of unemployment benefits, the lower is the probability of employment. This is con-sistent with theory and previous empirical findings (see e.g. Cahuc and Zylberberg, 2004, Chapter 3, and references therein). The presence and number of children does not significantly influence the outcome variable in our regression.
Second generation migrants have on average—even after controlling for the characteristics mentioned before—a significantly lower employment probability at the first interview. This difference, however, slightly decreases when we additionally control for preferences and attitudes in the second column of Table 4. When we test the equality of the coefficient estimates, we cannot reject the null hypothesis of equality. Although the effect on the native-migrant difference appears to be moder-ate, a likelihood ratio test indicates a better model fit of the regression in the second column.
In this regression, risk attitudes have a significantly negative influence on the employment probability. The more risk loving an individual is, other things equal, the less likely he or she is employed shortly after unemployment entry. This finding is consistent with theory and previous empirical findings. Pannenberg (2010) shows that a higher willingness to take risks is associated with a higher reservation wage, and thus with a lower employment probability.
To test whether economic preferences and attitudes have a differential impact on second generation migrants and natives, we estimate an additional model specifica-tion that includes interacspecifica-tion effects of the dummy variable for second generaspecifica-tion migrants, with the four measures of economic preferences and attitudes. The coef-ficient estimates on the interaction terms are not significantly different from zero. Hence, we do not find support for a differential impact across the two groups. Simi-larly, we do not find large differences across gender. When estimating the regressions separately for men and women, we find, in general, no substantial differences com-pared to the results reported in Table 4. The only difference is a significantly positive influence of trust in the female regression, which is not the case for men.
Table 4: Probit Regressions I (Baseline: Employed at the First Interview) (1) (2) Male 0.059 0.063 (0.015)∗∗∗ (0.015)∗∗∗ Age 0.01 0.01 (0.006) (0.006) Age squared -.014 -.014 (0.008)∗ (0.008) Married -.019 -.021 (0.018) (0.018)
No school degree reference reference
(reference) (reference) School 9 yrs 0.013 0.016 (0.074) (0.073) School 10 yrs 0.003 0.006 (0.074) (0.073) School 11-12 yrs 0.034 0.035 (0.079) (0.079) School 12-13 yrs 0.017 0.018 (0.075) (0.075)
No vocational degree reference reference
(reference) (reference)
Apprenticeship 0.107 0.107
(0.028)∗∗∗ (0.028)∗∗∗
Spec. vocational school 0.093 0.093
(0.033)∗∗∗ (0.033)∗∗∗
University, techn. college 0.075 0.075
(0.034)∗∗ (0.034)∗∗
No prior job reference reference
(reference) (reference)
Duration last job<=1 year 0.153 0.154
(0.031)∗∗∗ (0.031)∗∗∗
Duration last job<=5 yrs. 0.149 0.149
(0.032)∗∗∗ (0.032)∗∗∗
Duration last job<=10 yrs. 0.07 0.07
(0.039)∗ (0.039)∗
Duration last job>10 yrs. 0.08 0.077
(0.04)∗∗ (0.04)∗
Logarithm of unemployment benefits -.040 -.040
(0.002)∗∗∗ (0.002)∗∗∗
Children in household 0.011 0.011
(0.033) (0.033)
Number of children in household -.011 -.010
(0.018) (0.018)
Second generation migrant -.070 -.067
(0.027)∗∗ (0.027)∗∗ Risk -.009 (0.003)∗∗∗ Time 0.004 (0.003) Trust 0.003 (0.004) Reciprocity 0.003 (0.005) Log-Likelihood –1309.1311 –1304.296 # Observations 2,875 2,875
Source: IZA Evaluation Dataset, own calculations.
Note: Probit regressions. Average marginal effects. Robust standard errors in parentheses. Dependent variable: (self-)employed at first interview. Preferences and attitudes are included by the raw index in model (2). Additional control variables are dummies for German federal states, month of entry into unemployment and time between unem-ployment entry and interview (7-14 weeks).
Table 5: Probit Regressions II (Risk Attitudes: Employed at the First Interview)
Baseline (1) (2) (3)
Risk: raw index (0, 1, 2, . . . , 10) -.008
(0.003)∗∗
Risk: binary indicator (1 if≥6) -.041
(0.015)∗∗∗
Risk: low (1 if≤3) 0.014
(0.018)
Risk: intermediate (1 if 4–6) reference
(reference)
Risk: high (1 if≥7) -.034
(0.017)∗∗
Second generation migrant -.070 -.067 -.067 -.067
(0.027)∗∗ (0.027)∗∗ (0.027)∗∗ (0.027)∗∗
Log-Likelihood –1309.1311 –1306.2475 –1305.236 –1305.8124
# Observations 2,875 2,875 2,875 2,875
Source: IZA Evaluation Dataset, own calculations.
Note: Probit regressions. Average marginal effects. Robust standard errors in parentheses. Dependent variable: (self-)employed at first interview. Additional control variables are male, age and age squared, married, educational and vocational variables, dummies of duration of last employment, logarithm of unemployment benefits, children in household, dummies for German federal states, month of entry into unemployment and time between unemployment entry and interview (7-14 weeks). Full estimation results are available upon request.
*** significant at 1%; ** significant at 5%; * significant at 10%.
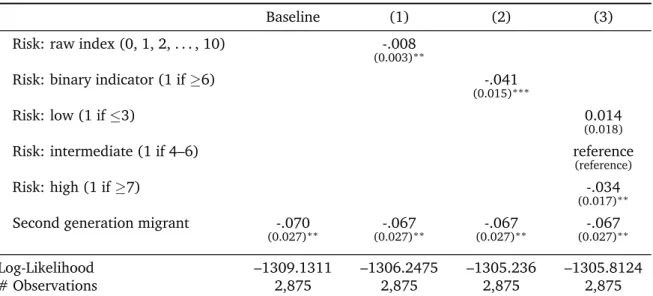
Table 5 reveals the results of the baseline regression when we include the three different measures of risk attitudes in three separate regressions. The first column shows the results of the baseline regression (without controlling for preferences and attitudes) and is added to facilitate comparison. The coefficients of the raw index and the binary indicator are both negative and significant, and the coefficient es-timate on the second generation dummy decreases slightly. When we include the low and high risk categories and take the intermediate category as reference, we find that it is individuals with a particularly high willingness to take risks who drive the overall effect. Furthermore, the coefficient estimate on the indicator for second generation migrants also decreases, albeit slightly in this regression.
To shed more light on the underlying mechanism behind these findings, we vestigate the relationship between risk attitudes, reservation wages and search
in-tensity in more detail.20 First, we find support for the hypothesis that more risk
averse individuals are less selective, i.e. that they have lower reservation wages— which then lead to higher employment probabilities. This is true for both native
job seekers and unemployed second generation migrants.21 Thus we cannot reject
the hypothesis that higher reservation wages is the mechanism through which a
sig-20See Tables A1, A2 and A3 in the Appendix. The number of observations decreases in this exercise
because reservation wages, the number of search channels used, and the number of applications sent out are only elicited for those individuals who are actively searching for employment at the time of the first interview. Individuals who had already found employment are not included.
21It appears that second generation migrants generally have higher reservation wages than natives,
nificantly lower employment probability for individuals with a high willingness to take risks results. Second, we find that the number of search channels used—as an approximation of search intensity—is virtually the same for both natives and sec-ond generations migrants in our sample. Moreover, the number of search channels decreases very slightly in the willingness to take risks. However, a second approx-imation of search intensity, the number of applications sent out by the individuals,
indicates that search intensity increases in the willingness to take risks.22 This
lat-ter finding is in line with the observation of lower reservation wages for more risk averse individuals. Search intensity may thus be a channel through which the direct effect of risk attitudes on reservation wages is reinforced.
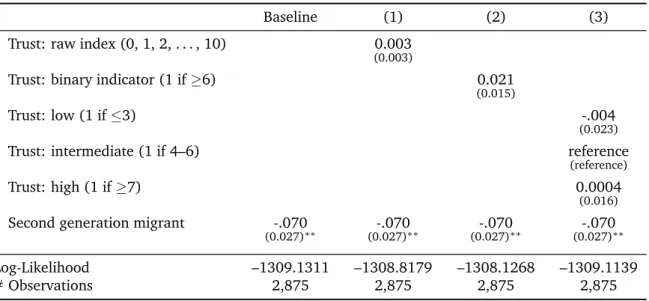
Furthermore, we investigate in more detail the influence of time preferences, trust and positive reciprocity on the probability of being employed at the first in-terview. In those additional regressions, we individually include the three different
measures for each of the preferences and attitudes.23 Interestingly, and
indepen-dently of the measure used, none of the three characteristics exhibits significant explanatory power in these regressions. The coefficient estimates on the indicator for second generation migrants remain virtually the same in all regressions. It thus appears that among the preferences and attitudes we examine, only the measures of risk attitudes enter statistically significantly in the regressions. That is, risk attitudes explain the probability of being employed at the first interview. Despite descriptive differences between natives and migrants, which are to some extent present in the case of the three other preferences and attitudes, these do not appear to signifi-cantly influence the employment probability—at least not beyond those characteris-tics which are also controlled for in our regressions.
6
Conclusions
In this paper we study four types of preferences and attitudes that individuals who
enter into unemployment in Germany exhibit; namely, a) risk attitudes, b) time
preferences, c) trust and d) positive reciprocity. We further distinguish between
natives and second generation migrants to analyze whether there are differences between these two groups in this regard, and whether such differences matter in terms of subsequent employment prospects.
Our results indicate that there are differences between natives and second gen-eration migrants with respect to preferences and attitudes, and these differences mainly lie in attitudes towards risk and in positive reciprocity. Second generation migrants show a significantly higher willingness to take risks, and they are less likely to have a low amount of positive reciprocity when compared to natives. Those
dif-22Second generation migrants with intermediate risk attitudes have, on average, the lowest number
of applications sent out. We cannot explain this finding, but it is rather striking.
ferences also matter in terms of economic outcomes, and more specifically in terms of employability two months after unemployment entry. We observe a significantly lower employment probability for individuals with a high willingness to take risks, even when controlling for other observable characteristics. The mechanism through which this occurs is very likely the reservation wage, which is found to be higher for individuals with a lower degree of risk aversion. Search intensity may be an-other channel through which the direct effect of risk attitudes on reservation wages is reinforced. Therefore, our findings offer interesting perspectives, e.g. with regard to the design and targeting of active labor market policy. It may be reasonable to specifically focus on less risk averse individuals with measures such as job search requirements and monitoring, which potentially lower the expectations and reserva-tion wages of those unemployed individuals.
However, our findings are not the answer to the question why second genera-tion migrants still lag behind natives in numerous economic outcomes. Including preferences and attitudes in our regressions only moderately shrinks the natives and second generation migrants disparity in terms of their employment probabil-ity two months after they enter unemployment. It may be worth investigating the long-term effects of these non-cognitive characteristics on reemployment probabili-ties, although the issue of reverse causality becomes more of a concern in this case. Moreover, our data do not include first generation migrants. Nonetheless, an inter-esting avenue for future research would be to include those individuals, e.g. to study the potential patterns of adaptation over the migrant generations in the job search process—and beyond.
It should also be kept in mind that our data are not representative of the entire
population of second generation migrants and natives in Germany. The IZA
Eval-uation Dataset is comprised of a representative inflow sample into unemployment. There are, however, underlying dynamics of the process of becoming unemployed, which, while they go beyond the scope of this paper, may cause the distribution of preferences and attitudes to be different in our sample from that in the population. For instance, it has been shown that public sector employees are more risk averse than employees in the private sector (Buurman et al., 2009). Assuming that pub-lic sector employees are less likely to become unemployed and less likely to have a migration background, this is one channel through which an inflow sample into un-employment would not be representative of the population in terms of preferences and attitudes. This may well be an important explanation to why our findings are, in some aspects, in contrast to previous findings in the literature on preferences and attitudes of migrants and natives.
When considering the broader picture and the context of our paper, the slow reintegration of second generation migrants into the labor market may also be re-lated to other characteristics than preferences and attitudes. For instance, we know that there are substantial differences in human capital. Furthermore, migrants might have different access to social networks that are important in the job search process,
especially in informal job search. Beyond access to such networks, the size and qual-ity of migrants’ networks may also be very different from natives’ networks. Second generation migrants may very likely be affected by racial or ethnic discrimination. Lastly, ethnic identity is also an important factor influencing an array of economic outcomes through various channels. The extent to which those potential explana-tions apply, and how they potentially interact, deserves further research.
References
Algan, Y., C. Dustmann, A. Glitz, and A. Manning (2010). The Economic Situation of First- and
Second-Generation Immigrants in France, Germany, and the United Kingdom. The Economic
Jour-nal 120(542), 4–30.
Blackaby, D., D. Leslie, P. Murphy, and N. O’Leary (2005). Born in Britain: How are Native Ethnic
Minorities Faring in the British Labour Market? Economics Letters 88(3), 370–375.
Blau, D. M. and P. K. Robins (1990). Job Search Outcomes for the Employed and Unemployed.
Journal of Political Economy 98(3), 637–655.
Bonin, H., A. F. Constant, K. Tatsiramos, and K. F. Zimmermann (2006). Ethnic Persistence, As-similation and Risk Proclivity. IZA Discussion Paper 2537, Institute for the Study of Labor (IZA), Bonn.
Bonin, H., A. F. Constant, K. Tatsiramos, and K. F. Zimmermann (2009). Native-Migrant Differences
in Risk Attitudes. Applied Economics Letters 16(15), 1581–1586.
Borghans, L., A. L. Duckworth, J. J. Heckman, and B. ter Weel (2008). The Economics and Psychology
of Personality Traits.Journal of Human Resources 43(4), 972–1059.
Borjas, G. (1987). Self-Selection and the Earnings of Immigrants. American Economic Review 77(4),
531–553.
Butler, J. V., P. Giuliano, and L. Guiso (2009). The Right Amount of Trust. IZA Discussion Paper 4416, Institute for the Study of Labor (IZA), Bonn.
Buurman, M., R. Dur, and S. van den Bossche (2009). Public Sector Employees: Risk Averse and Altruistic? IZA Discussion Paper 4401, Institute for the Study of Labor (IZA), Bonn.
Cahuc, P. and A. Zylberberg (2004). Labor Economics. MIT Press.
Caliendo, M., D. A. Cobb-Clark, and A. Uhlendorff (2010). Locus of Control and Job Search Strategies. IZA Discussion Paper 4750, Institute for the Study of Labor (IZA), Bonn.
Caliendo, M., A. Falk, L. C. Kaiser, H. Schneider, A. Uhlendorff, G. J. van den Berg, and K. F. Zim-mermann (2010). The IZA Evaluation Dataset: Towards Evidence-based Labour Policy-Making. Working Paper, Institute for the Study of Labor (IZA), Bonn.
Caliendo, M., R. Schmidl, and A. Uhlendorff (2010). Social Networks, Job Search Methods and Reservation Wages: Evidence for Germany. IZA Discussion Paper 5165, Institute for the Study of Labor (IZA), Bonn.
Card, D., J. DiNardo, and E. Estes (1998). The More Things Change: Immigrants and the Children of Immigrants in the 1940s, the 1970s, and the 1990s. NBER Working Paper 6519, National Bureau of Economic Research, Inc, Cambridge, MA.
Chiswick, B. R. (1978). The Effect of Americanization on the Earnings of Foreign-born Men. Journal
of Political Economy 86(5), 897–921.
Constant, A. F., M. Kahanec, U. Rinne, and K. F. Zimmermann (2009). Ethnicity, Job Search and Labor Market Reintegration of the Unemployed. IZA Discussion Paper 4660, Institute for the Study of Labor (IZA), Bonn.
Constant, A. F. and K. F. Zimmermann (2009). Work and Money: Payoffs by Ethnic Identity and
Gender.Research in Labor Economics 29, 3–30.
Cox, J. C. and W. H. Orman (2010). Immigrant Assimilation, Trust and Social Capital. IZA Discussion Paper 5063, Institute for the Study of Labor (IZA), Bonn.
DellaVigna, S. and M. D. Paserman (2005). Job Search and Impatience. Journal of Labor
Eco-nomics 23(3), 527–588.
Dinesen, P. T. and M. Hooghe (2010). When in Rome, Do as the Romans Do: The Acculturation of
Generalized Trust among Immigrants in Western Europe. International Migration Review 44(3),
697–727.
Dohmen, T., A. Falk, D. Huffman, and U. Sunde (2006). The Intergenerational Transmission of Risk and Trust Attitudes. IZA Discussion Paper 2380, Institute for the Study of Labor (IZA), Bonn. Dohmen, T., A. Falk, D. Huffman, and U. Sunde (2009). Homo Reciprocans: Survey Evidence on
Prevalence, Behavior and Success.The Economic Journal 119(536), 592–612.
Dohmen, T., A. Falk, D. Huffman, and U. Sunde (2010). Are Risk Aversion and Impatience Related to
Cognitive Ability? American Economic Review 100(3), 1238–1260.
Dohmen, T., A. Falk, D. Huffman, U. Sunde, J. Schupp, and G. G. Wagner (2005). Individual Risk Attitudes: New Evidence from a Large, Representative, Experimentally-Validated Survey. IZA Dis-cussion Paper 1730, Institute for the Study of Labor (IZA), Bonn.
Edin, P.-A. and M. Gustavsson (2008). Time Out of Work and Skill Depreciation.Industrial and Labor
Relations Review 61(2), 163–180.
Eichhorst, W., A. Kuhn, E. Thode, and R. Zenker (2010). Traditionelle Besch¨aftigungsverh¨altnisse im
Wandel. IZA Research Report 23, Institute for the Study of Labor (IZA), Bonn.
Fehr, E. and S. G¨achter (2000). Fairness and Retaliation: The Economics of Reciprocity. Journal of
Economic Perspectives 14(3), 159–181.
Gibson, J. and D. McKenzie (2009). The Microeconomic Determinants of Emigration and Return Migration of the Best and Brightest: Evidence from the Pacific. IZA Discussion Paper 3926, Institute for the Study of Labor (IZA), Bonn.
Granovetter, M. (1973). The Strength of Weak Ties.American Journal of Sociology 78(6), 1360–1380.
Granovetter, M. (1974). Getting a Job: A Study of Contacts and Careers. London and Chicago:
University of Chicago Press.
Heath, A. F., C. Rothon, and E. Kilpi (2008). The Second Generation in Western Europe: Education,
Unemployment, and Occupational Attainment. Annual Review of Sociology 34(1), 211–235.
Heckman, J. J. and Y. Rubinstein (2001). The Importance of Noncognitive Skills: Lessons from the
GED Testing Program.American Economic Review 91(2), 145–149.
Heitmueller, A. (2005). Unemployment Benefits, Risk Aversion, and Migration Incentives. Journal of
Population Economics 18(1), 93–112.
Holzer, H. J. (1988). Search Method Use by Unemployed Youth. Journal of Labor Economics 6(1),
1–20.
Hooghe, M., T. Reeskens, D. Stolle, and A. Trappers (2009). Ethnic Diversity and Generalized Trust
in Europe: A Cross-National Multilevel Study.Comparative Political Studies 42(2), 198–223.
Jaeger, D. A., H. Bonin, T. Dohmen, A. Falk, D. Huffman, and U. Sunde (2010). Direct Evidence on
Risk Attitudes and Migration. Review of Economics and Statistics 92(3), 684–689.
Jonsson, J. O. (2007). The Farther They Come, the Harder They Fall? First- and Second-Generation
immigrants in the Swedish Labour Market. In A. F. Heath and S. Y. Cheung (Eds.), Unequal
Chances: Ethnic Minorities in Western Labour Markets, pp. 451–505.
Kaas, L. and C. Manger (2010). Ethnic Discrimination in Germany’s Labour Market: A Field Experi-ment. IZA Discussion Paper 4741, Institute for the Study of Labor (IZA), Bonn.
Kahanec, M. and A. Zaiceva (2009). Labor Market Outcomes of Immigrants and Non-citizens in the
EU: An East-West Comparison.International Journal of Manpower 30(1/2), 97–115.
Kalter, F. and N. Granato (2007). Educational Hurdles on the Way to Structural Assimilation in
Germany. In A. F. Heath and S. Y. Cheung (Eds.),Unequal Chances: Ethnic Minorities in Western