„Comparative biology of the pollen-ovule ratio”
D i s s e r t a t i o n
zur Erlangung des akademischen Grades
doctor rerum naturalium (Dr. rer. nat)
vorgelegt der
Naturwissenschaftlichen Fakultät I
Biowissenschaften
der Martin-Luther-Universität Halle-Wittenberg
von
Herrn Lars Götzenberger
geb. am: 02.06.1976 in: Viersen
Gutachter /in
1. Dr. Ingolf Kühn
2. Prof. Dr. Isabell Hensen
3. Prof. Dr. Christoph Oberprieler
verteidigt am 09.09.2008
urn:nbn:de:gbv:3-000014269
Contents
Chapter 1 General Introduction 1
1.1 Mating systems of flowering plants _______________________1
1.2 The pollen-ovule ratio ___________________________________3
1.3 Objectives of the PhD thesis ______________________________8
1.4 The comparative method and phylogenetic “correction” _____9
1.5 Brownian motion and phylogenetic independent
contrasts – an excurse __________________________________10
1.6 References_____________________________________________13
Chapter 2 The relationship between seed size and the pollen-ovule
ratio – a comparative test of sex allocation theory 18
Chapter 3 The relationship between pollen size and the pollen-ovule
ratio – another comparative test of sex allocation theory 19
Chapter 4 The effect of habitat disturbance and pollination type
on the inter-specific variation in pollen-ovule ratios 20
Chapter 5 Can we use seed size to estimate pollen-ovule ratios – an approach using mixed effect models to
incorporate taxonomical information 21
Chapter 6 Synthesis 22
6.1 Pollen-ovule ratios and Charnov’s model _________________22
6.2 The effect of phylogeny and taxonomy ____________________25
6.3 Correlated evolution____________________________________25 6.4 Conclusions ___________________________________________26 6.5 References_____________________________________________28 Danksagung 31 Appendix 32 Curriculum Vitae_______________________________________32 Publications ___________________________________________33 Eigenständigkeitserklärung______________________________34
Chapter 1 General introduction
The flowers of plants have long fascinated humans, mainly because of their tremen-dous diversity in morphology, colour and scent. Flowers are one of the main reasons why people in many cultures construct and maintain gardens. But also from a scien-tific viewpoint the enormous variation in floral design and function is intriguing if one considers that all this variation is committed to one fundamental biological pur-pose: to transmit genes from one generation to the next. The diversity in floral design reflects the vast diversity in the mating biology of flowering plants that is greater than in any other group of organisms (Barrett 2002). The focal points in early studies of floral biology were on floral morphology and pollination phenomena, especially how floral structures promote the visitation by insects. Darwin (1862; 1876; 1877) wrote three entire volumes about plant reproductive biology and was the first to re-alize the function and relevance of outcrossing mechanisms in flowering plants. His work can be regarded as the foundation of an experimental approach to the subject. Darwin, along with Knight (1799), also discovered inbreeding depression. The Dar-win-Knight law states that outbreeding species prevail over selfing species. Under theinfluence of the Darwin-Knight law, following researchers like Knuth (1898-1904) failed to recognize the importance of selfing. Until then, most work on reproductive biology was conducted in a descriptive way and there was no groundbreaking re-search in the early 20th century. It took several decades before botanists begun
pick-ing up Darwin’s ideas and experimental approach, and developed new perspectives on the matter. The promotion of Baker’s rule by Stebbins (1957), based on the work of Baker (1955), can be seen as an initiation for the revival of reproductive biology, fol-lowed by many botanists who devoted a great part of their work to the subject. Today, the reproductive biology of plants is still a very vivid and active study subject for many botanists (see recent books by de Jong and Klinkhammer 2005; Harder and Barrett 2006). The main interest remains in answering the question how the enor-mous variation in plant mating biology could evolve and how mating strategies in turn influence the life history, ecology and genetic variation in plant species and their populations.
1.1 Mating systems of flowering plants
The mating system is “the mode of transmission of genes from one generation to the next through sexual reproduction” (Barrett 1998). In plants, this mode of transmis-sion is governed by numerous attributes of floral morphology and function. For ample, showy flowers are thought to attract pollinators and thus promote the ex-change of genes between individuals. In contrast, the occurrence of cleistogamous flowers, i.e. flowers that remain in the stage of a flower bud and do not open, prevent pollen from getting transported by pollen vectors.
Table 1.1 Mating system categories for flowering plants (modified from Durka 2002)
Mating system Explanation
Xenogamy Seeds sired through outcrossed pollen,
for some species obligate (dioecious and self-incompatible species)
Facultative xenogamy Predominantly outcrossed, but selfing is
possible. E.g. species that assure mating by selfing if pollinators fail to outcross pollen
Facultative autogamy Predominantly selfed, but outcrossing is
possible.
Obligate autogamy Mostly selfed, outcrossing might occur
but is not common. A special form are cleistogamous species, in which selfing is promoted by flower buds that do not open The most precise method to determine the mating system of a single individual plant would be to assess the number of seeds that are sired through male gametes (pollen) from other individuals versus the number of seeds that are sired through male gam-etes of the same individual. Botanists refer to these two pathways as “outcrossed” and “selfed”, respectively. Species that outcross are referred to as having a xenoga-mous mating system and species that self as having an autogaxenoga-mous mating system. In many cases, however, plants are capable of siring seeds through both pathways. This fact is reflected by two further, intermediate mating system categories that are often used nowadays (Cruden et al. 1989; Durka 2002; see Table 1.1).
In practice, there are many morphological and phenological, pollination-ecological and genetical features of a plant species that can be taken into account to infer its mating system. The groups of biological attributes are reflected by three major groups of methods applied by botanists to draw conclusion about the mating system of a plant species or a population:
(1) measuring of morphological and phenological features like flower size, spatial or temporal separation of female and male sexual function (2) observation of pollinators and pollination experiments
(3) genetic markers like Isoenzymes, DNA fingerprinting, microsatellites
Genetic markers are particularly helpful when estimating outcrossing rates at a lower level of biological organization, i.e. within and between populations of a plant spe-cies. Pollination experiments are set up in a way that allows to infer effects of cross- and self pollination on seed set. This is done by emasculating flowers, excluding pol-linators and pollinating flowers by hand. For instance, a species or population is thought to be obligately outcrossing if it fails to set seed after flowers have been hand pollinated with pollen from the same individual. The visitation of flowers by insects
and other animals that are able to carry pollen are also an indication of outcrossing. The third category, measuring morphological and phenological attributes that corre-late with the mating system, is less precise then the methods in the other categories. Those attributes, however, are in most cases easy to obtain and can be a strong clue, especially if information on closely related species is available.
1.2 The pollen-ovule ratio
Pollen-ovule ratios and the efficiency of pollination
The pollen-ovule ratio is calculated by dividing the number of pollen grains in a flower by the number of ovules in the same flower. Thus, pollen-ovule ratio values for a plant species are mostly average values of several aggregations from different individuals and/or populations.
In a paper that has been cited nearly 500 times until today (March 2008), Cruden (1977) proposed that the ratio of pollen to ovules in a flower are an reliable mating system estimate. The pollen-ovule ratio was mentioned in former botanical literature, but it was not before Cruden’s article entitled “Pollen-ovule ratios - conservative in-dicator of breeding systems in flowering plants” that this subject attracted profound interest. Actually, Cruden’s view that the pollen-ovule ratio reflects the efficiency of pollination was earlier anticipated by Lloyd (1965). In his PhD thesis about the evolu-tion of self-compatibility and racial differentiaevolu-tion in Leavenworthia crassa he stated that “… trends towards the decrease in the anther lengths and pollen:ovule indices perhaps reflect increased efficiency in (self-) pollination in these races …” (p. 68). While Lloyd studied races of a single plant species, Cruden advanced Lloyd’s idea by approaching the question with an interspecific, i.e. comparative analysis. He col-lected data on pollen-ovule ratios for 96 species and inferred mating systems of the species from characteristics of the flower and floral behavior. Cruden found that the pollen-ovule ratios of his 96 plant species correlated positively with the degree of outcrossing as defined by the mating system. The ratio increased from each mating system category to the next; from cleistogamy to obligate autogamy, to facultative autogamy, to facultative xenogamy, to xenogamy. The resulting table of mating sys-tems and their average pollen-ovule ratios (see Table 1.2) has been adopted by many authors to infer mating systems from pollen-ovule ratios. Cruden stated “… that P/O’s are a better predictor of a plants breeding system than other morphological characteristics.”
In his subsequent research, Cruden examined a syndrome of attributes that are con-nected to the probability of pollen grains reaching a stigma, and the relation of these attributes to pollen-ovule ratios. He found that pollen-ovule ratios are smaller for species that disperse their pollen grains in polyads or pollinia (3 to several hundred pollen grains clumped together) compared to species with the same mating system but who disperse their pollen grains as monads (Cruden and Jensen 1979). Another study (Cruden and Miller-Ward 1981) focused on bee-pollinated species and showed a negative correlation between stigma area relative to the pollen bearing area of
the pollinator and pollen-ovule ratio. Those studies confirmed Cruden to propose that the pollen-ovule ratio reflects pollination efficiency (Cruden 1997).
The general trend that plants with predominantly inbreeding mating systems have lower pollen-ovule ratios compared to species with predominantly outbreeding mat-ing systems has consistently been found in numerous studies (see references in Cruden 2000; Erbar and Langlotz 2005). This general trend holds within families, genera, species, and populations. Conversely, there are several authors that object using Cruden’s table as a single standard for comparison (Preston 1986; Philbrick and Anderson 1987; Vasek and Weng 1988) because a number of studies observed pollen-ovule ratios that are not in accordance with Cruden’s generalization. For in-stance, it was found that for some taxonomic groups pollen-ovule ratios are relatively low when special pollen-transporting mechanisms are involved (Cruden and Jensen 1979; Preston 1986; Philbrick and Anderson 1987; Vasek and Weng 1988; Wyatt et al. 2000). However, such findings do not generally put the pollination efficiency theory of Cruden into question as they just reflect factors that additionally influence varia-tion in pollen-ovule ratios. In consequence, it was advocated that pollen-ovule ratios as mating systems indicators have to be considerer in a taxonomical context (Vasek and Weng 1988; Erbar and Langlotz 2005).
Cruden (1977) also showed for 85 species in his study that species of disturbed or early succesional habitats have lower pollen-ovule ratios compared to species of natural or late succesional habitats. Because of the correlation between pollen-ovule ratios and mating system he interpreted this result as a support for the reproductive asurance hypothesis. This hypothesis states that selfing is in advantage over out-crossing if pollinators are unreliable in delivering pollen to outcross, a condition that is met by disturbed and early succesional habitats.
Pollen-ovule ratios and sex allocation theory
Sex allocation theory is the area of plant reproductive biology that studies the trade-off in resource allocation to male and female sex function with the tools of optimiza-tion theory, especially evoluoptimiza-tionary stable strategies (Maynard-Smith 1982). Charnov (1982) was among the first who applied EES theory to the allocation to sex function in plants. He also reviewed the pollen-ovule ratio under the light of sex allocation. In his book “The theory of sex allocation” he devoted one chapter to “Sex types in higher plants”. In this chapter he criticized Cruden’s pollination efficiency theory for two reasons: Firstly, because it presumes that male function, i.e. the production of
Table 1.2 Mating systems categories and corresponding average pollen-ovule ratios (after Cruden, 1977)
Mating system Pollen-ovule ratio (standard error)
Cleistogamy 4.7 (0.7)
Obligate autogamy 27.7 (3.1)
Facultative autogamy 168.5 (22.1)
Facultative xenogamy 796.6 (87.7)
pollen, is the only means toward fitness gain. According to Cruden, pollen exists to maximize seed set. The allocation to ovules is not considered although it should also contribute to fitness gain. Secondly, Cruden’s theory only focuses on the numbers of pollen grains produced in relation to the numbers of ovules. It omits the amount of resources that is invested per allocation unit, i.e. the investment per ovule and the investment per pollen grain. Based on this critique Charnov formulated a mathe-matical model that relates the pollen-ovule ratio to ovule size, pollen grain size and the ratio of the proportion allocated to pollen and the proportion allocated to seeds. It is derived from the simple statement that the number of pollen grains P is defined by dividing the proportion r of resources R allocated to male function by the amount of resources invested in one pollen grain C1.
1
C rR
P= (Equation 1.1)
Likewise, the number of ovules O is defined by dividing the complementary propor-tion 1-r of resources R allocated to female funcpropor-tion and the amount of resources in-vested in one ovule C2.
2 ) 1 ( C R r O= − (Equation 1.2)
Dividing Equation 1 by Equation 2 and taking the logarithm at both sides of the re-sult gives 1 2 log log 1 log log C C r r O P − + − = (Equation 1.3)
Because attributes of the mature seeds are very important for successful establish-ment, and hence the success of ovule genes, the investment C2 in an ovule should
also include investment in maturing seeds. This can be done by assuming for simplicity that ovule number equals seed number and taking C2 to be seed size
(Queller 1984). According to the mathematical model, the pollen-ovule ratio is not governed by the efficiency of pollination but by the relative allocation to male vs. female function, i.e. seed size and pollen size. Furthermore, Charnov argued that the relative allocation term (r/1-r) can assumed to be a constant within a mating system. Given that there is no systematic variation of seed size with pollen size, positive and negative relationships with pollen-ovule ratio are expected from the model for seed size and pollen size, respectively (see Box 1 for details).
In contrast to the great number of studies that have adopted Cruden’s view on varia-tion in pollen-ovule ratios, studies that explicitly tested the predicvaria-tions from Char-nov’s model are relatively scarce. In support of his hypothesis Charnov (1982) found a significant negative relationship of pollen-ovule ratio with pollen grain volume with a functional regression slope of -1.42 among 19 bee-pollinated species. The data of this preliminary analysis stemmed from an analysis of Cruden and Miller-Ward (1981) who also predicted decreasing pollen-ovule ratios with increasing pollen grain size. This prediction, however, was embedded in the “efficiency hypothesis” of Cruden. The authors argued that bigger pollen grains contain more compounds that are necessary for germination on and penetration of the stigmatic surface by the pol-len tube. Thus “fewer large grains should be required per seed than small grains”. Uma Shaanker and Ganeshaiah (1984) asked “Does pollination efficiency shape the pollen-ovule ratio?” and found that within 10 Phyllantus (Euphorbiaceae) species seed mass indeed correlates positively with seed size. Gallardo et al. (1994) obtained correlation results between ovule ratios and autofertility, and between pollen-ovule ratios and pollen grain size within 6 taxa of the genus Epiglottis (Fabaceae) that corroborated predictions from Charnov’s model. Among several Solanum species, Mione and Anderson (1992) reported correlations between pollen-ovule ratios, seed size, and pollen size that were ambiguous with regard to predictions from Charnov’s model. There is also qualitative evidence in the literature that large pollen-ovule ra-tios coincide with small pollen grains and vice versa (e.g. Mazer and Hultgard 1993; Barrett et al. 1996; Affre and Thompson 1998). Preston (1986) analysed the largest data set so far, comprising 49 crucifer taxa. He divided the data into autogamous and allogamous taxa and found a positive correlation within both of the groups.
While most of these studies provide evidence that pollen-ovule ratios are governed by allocation to male and female sex function they focus on small data sets and nar-row taxonomical ranges. Despite the comparative approach the phylogenetic relat-edness of the studied species is not accounted for and the predicted slope of the re-gression of pollen-ovule ratio on seed mass and pollen size (see Box 1.1) is only tested in two studies (Charnov 1982, Uma Shaanker and Ganeshaiah 1984). In the works of Lopez et al. (2000) and Bosch et al. (2001) the model was not explicitly tested and the finding of a positive relationship between seed size and the pollen-ovule ratio is only discussed briefly. The same holds for Rodriguez-Riana et al. (1999) and Tate and Simpson (2004) who found positive correlations between pollen size and pollen-ovule ratio, contradicting predictions form Charnov’s model.
Box 1.1: Implications of Charnov’s model for pollen-ovule ratios
pollen ovule ratio = 1000 seed size = 100
pollen ovule ratio = 10000 seed size = 1000 1.0 1.5 2.0 2.5 3.0 3.5 4.0 2 .0 2 .5 3 .0 3 .5 4 .0 4 .5 5 .0
log [seed size]
lo g [ p o ll e n o v u le r a ti o ] R 1 – r (seeds), O = 1 C2= 1000 r (pollen), P = 10000 C1= 0.001 Species X R 1 – r (seeds), O = 10 C2= 100 r (pollen), P = 10000 C1= 0.001 Species Y
To demonstrate the implications of Equation 3, I present a worked example of the model for two hypothetical species. Let R be the proportion of resources of a plant that is allocated to generative reproduction. R is further divided into a proportion that is allocated to male function r and a complimentary proportion 1-r that is allocated to female function. For species X we set C1 in Equation 1 to
0.001 mm³, using volume as an approximation for invested resources so that C1
= pollen size. C2 (seed size) is set to 1000 mm3, the number of pollen grains P to
10,000, and the ovule number O to 1. For species Y C1 and P equal 0.001 and
10,000, respectively. C2 and O are 100 and 10, respectively. By choosing those
values we also implement the assumption that the (r/1-r) term in Equation 1 is equal for both species. Calculated from the given values, the pollen-ovule ratio for species X is 10,000, and for species Y 1000. Taking the logarithm of the pol-len-ovule ratios and seed sizes of both species and regressing polpol-len-ovule ratio on seed size results in a unity regression slope. The same logic works for pollen size. While holding C2 constant, this time the slope of the regression line is a
1.3 Objectives of the PhD thesis
The work of Cruden (1977) and Charnov (1982) form the basis of this PhD thesis. The contrasting views of Cruden and Charnov might be best demonstrated by an exam-ple: Pollen-ovule ratios in orchids are known to be lower than in many other taxa, spanning from only a few to several dozen pollen grains per ovule (Mehrhoff 1983; Neiland and Wilcock 1995; Lehnebach and Riveros 2003), even for species that are outcrossing. The comparably low pollen-ovule ratio could be interpreted in terms of Cruden’s efficiency theory by stating that the evolution of highly specific pollination syndromes in orchids has lead to a very low requirement of pollen per ovule for suc-cessful pollination. On the other hand, orchids have some of the lightest seeds among angiosperm species (Moles et al. 2005), a detail that is in direct accordance with Char-nov’s model.
I have pointed out in the introduction that studies of variation in pollen-ovule ratios, may it be in terms of pollination efficiency or in terms of sex allocation, have mostly focused on small datasets. Moreover, I am not aware of any study that adopted an explicitly evolutionary approach, i.e. conducted analysis that account for the phy-logenetic relationships of the species.
Using the comparative method (see following secions) as the tool of choice, I try to shed light on the question of what governs the enormous interspecific variation in pollen-ovule ratios. To answer this question I focus on the following main objectives:
• Does interspecific data on pollen-ovule ratio, seed size and pollen size support Charnov’s model of allocation to male and female sex function? (chapters 2 and 3)
• Does data on pollen-ovule ratios support the reproductive assurance hypothe-sis? (chapter 4)
• Does pollination efficiency influence variation in pollen-ovule ratios? (chapter 4)
• Are correlations of traits with pollen-ovule ratios only evident among current species or do these correlations hold throughout evolutionary history? (chap-ters 2, 3 and 4)
• Drawing on the results from our analysis of the relationship between seed size and pollen-ovule ratio (chapter 2) the question was raised if seed size can serve as a reliable estimator of pollen-ovule ratios (chapter 5)
1.4 The comparative method and phylogenetic “correction”
The comparative method is an investigative principal for asking questions about common patterns of evolutionary change. The main idea behind this principal is that the biology of a species may be better understood by comparing and contrasting it to the biology of other species (Harvey and Pagel 1991; Sanford et al. 2002). A classical example are “Darwin’s finches”, a group of closely related finch species living on the Galapagos archipelago, that mainly differ in their beak sizes. The meaning of the beak size for the food source spectrum of one species only becomes fully apparent in the light of comparing it to beak sizes and food sources of the other species while keeping in mind the phylogeny of all the species. If applied to large datasets that comprise a wide taxonomical range the comparative approach allows searching for general biological and ecological patterns. After Silvertown and Dodd (1997) there are two fundamental questions for any comparative analysis:
(1) Which traits are correlated with one another?
(2) Are trait correlations the result of common descent or of convergent evolu-tion?
In general, the investigated correlations are correlations between biological or eco-logical factors. That is, the traits can be attributes of the species as well as environ-mental conditions that are encountered by the species under study. While the first question has been asked in different contexts repeatedly among biologist throughout the decades, the second question was not tackled before the last 25 years in compara-tive analyses. The reason why we have to ask the second question as a consequence of asking the first, is that extant species may share common ancestors. Closely related species have a similar genome due to their shared common lineage. Therefore, closely related species also are likely to be similar in their phenotype and lifestyle. A fact that has direct implications for the statistical analyses of comparative data: If the probability that sister taxa have similar trait values is higher than for non sister taxa then the trait values of species in comparative analyses, i.e. the data points, can not be viewed as statistically independent – a basic assumption that is made by many commonly applied statistical tests (regression, ANOVA, etc).
In the case of comparative data that focus on continuous variables, Felsenstein (1985) was the first to suggest a method that accounts for the phylogenetic relationship of the studied species. This method is explicitly based on the Brownian model of char-acter evolution (Felstenstein 1985), a model that assumes that trait values change randomly during time according to a Brownian motion. In short, the algorithm calcu-lates contrasts (i.e. differences) between pairs of trait values and theoretical trait val-ues of higher nodes in a phylogenetic tree (see next section for a detailed descrip-tion). Felsenstein termed the resulting values phylogenetically independent contrasts (PIC), a term that has also become the name of the statistical method per se. Though other statistical methods have been developed since Felsenstein’s invention PICs still
are the most applied technique to control for phylogenetic dependence in compara-tive analyses.
A drawback of the PIC method, however, is that it can only deal with continuous variables. Purvis and Rambout (1995) presented a method derived from PIC that im-plements categorical explanatory variables but they have to be binary or need to be recoded to a binary form. Also, this method has a reduced statistical power because only species pairs whose linking lines in a phylogeny do not cross can be used. An-other statistical way of accounting for phylogenetic relationships in comparative analyses is to use generalized least squares (Grafen 1989; Martins and Hansen 1997) or generalized estimating equations (Paradis and Claude 2002), the former being a special case of the latter. In this framework, a variance/covariance matrix that re-flects the phylogenetic relationships of the species enters the formula of the statistical model. These methods allow a greater flexibility regarding the variables that can be analyzed. For GLS, both categorical and continuous explanatory variables can be analyzed in the same model and for GEE even the response variable is allowed to deviate from a normal distribution and take a logistic or Poisson distribution.
Finnally, several methods exist that allow to study the evolutionary association be-tween two or more binary variables. Early methods (Ridely 1993; Maddison 1990) are not based on a certain type of evolutionary model and branch lengths of the phy-logenetic tree can not be incorporated. More developed methods were presented by Pagel (1994) and Pagel et al (2004). These methods use a continuous-time Markov approach to model the evolution of two binary variables along a given phylogenetic tree. The approach via a Markovian process reflects the probability of evolutionary change along a branch from one state in the character to the other state.
1.5 Brownian motion and phylogenetic independent contrasts – an excurse
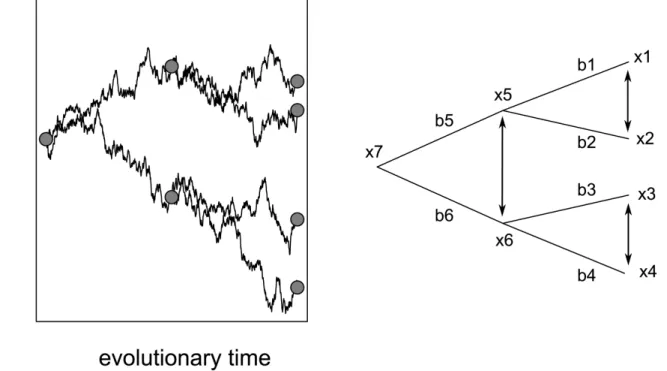
Brownian motion is named after the English botanist Robert Brown who discovered in 1827 (Brown 1828) that pollen grains suspended in water move around in a zigzag motion. Later on scientists suggested that the motion of the molecules of the liquid causes such a movement of the suspended particles. The molecules bump into the particle irregularly and with different strength resulting in a motion of the particle that can be described as a “random walk”. The mathematical model describing Brownian motion is a continuous-time stochastic process named Wiener process. In its one-dimensional form it can be visualized on a graph with time on the x-axis and a random movement downward or upward on the y-axis resulting in a zigzag line. The net movement in relation to the starting point is the sum of all infinitely small steps. The steps are independent of each other, i.e. the direction of one step does not influence the direction of the following step.
In biological science, the Wiener process was applied by Edwards and Cavalli-Sforza (1964) to analyze gene frequencies within populations and to describe evolution un-der random genetic drift. Based on this approach, Felsenstein (1985; 1988) used Brownian motion to develop a statistical method that intends to solve the problem of
dependent data points in comparative analyses. According to the Brownian motion model of character evolution, the y-axis in Figure 1.1 would represent the value of a quantitative trait that changes by a random amount from each generation to the next along a lineage and each of these trait changes is independent of each other. Because of the randomness of the process, the mean net change in the trait value is zero and the variance of the change is the same no matter what the actual trait value is. This means that if we were to run a process like this 1000 times, the “final” trait values would be distributed following a normal distribution with mean zero and a variance that is defined by the time span of the process (Figure 1.1); the larger the time span the greater the variance. If we take any step of the process and define it as a new starting point for two new process runs, we can interpret such a point as a speciation event, resulting in two new processes that behave exactly as the single process ex-plained above (Figure 1.2 a).
When looking at a phylogenetic tree (Figure 1.2 b) it becomes intuitively clear why species cannot be regarded as independent. For instance, x1 and x2 have a greater probability of being similar to each other than to any of the other species because they evolved from the same starting point, i.e. the same ancestor. The only trait value change of x1 that is independent of the change in x2 during evolutionary time is the
Figure 1.1 250 independent random walks that represent the evolution of trait values due to random genetic drift. The histogram shows that the 250 trait values at the “end” of evolu-tionary time are normally distributed. See text for details.
change that occurred since the speciation event. This is where the contrast method comes in; by subtracting x1 from x2, and x3 from x4 two values are calculated that are independent of each other. The contrast (i.e. difference) x1 – x2 depends only on changes in the branches 1 and 2 while the contrast x3 – x4 depends only on changes in branches 3 and 4. Contrasts are not only calculated for trait values of the “tip” cies of the tree (i.e. the extant species) but also for theoretical values of “node” spe-cies (i.e. extinct ancestral spespe-cies). The theoretical values of the ancestral spespe-cies are obtained on grounds of the Brownian motion model by taking a weighed average of the daughter species where the weight is given by the branch length of the daughter species. Thus, from a fully resolved phylogeny a set of n – 1 contrasts can be calcu-lated, with n being the number of tip species.
Usually, the contrasts are standardized by dividing each contrast by the square root of its variance, i.e. the branch length shared by the two species between which the contrast was calculated. Since the standardized contrasts are independent, their val-ues can be analyzed with standard statistical methods.
The method of PIC makes several evolutionary assumptions that are unlikely to be all met by biological data. Most importantly, the process of the Brownian motion model as used in Felsenstein’s PIC method approximates the gradual evolution of quantitative characters under mutation and random genetic drift alone. Other
Figure 1.2 A phylogeny of seven species represented by random walks (a) and a phyloge-netic tree (b). The circles in (a) depict the species x1 to x7 from the phylogephyloge-netic tree in (b). Arrows between species in (b) show pairs for which phylogenetically independent contrasts are calculated. See text for details.
tionary forces like directional or stabilizing selection are omitted by PIC. Although violating these assumptions seems rather severe, it has been shown by simulation studies that assuming a wrong model of evolution is still better than not considering the phylogeny at all (Diaz-Uriarte and Garland 1996; Diaz-Uriarte and Garland 1998; Martins et al. 2002). The same holds for wrong assumptions on particular prop-erties of the used phylogeny like branch lengths (Martins and Garland 1991; Purvis et al. 1994; DiazUriarte and Garland 1996; Diaz-Uriarte and Garland 1998), soft polyto-mies (Purvis et al. 1994), and the topology of the phylogenetic tree (Martins and Housworth 2002).
1.6 References
Affre, L., and Thompson, J.D. (1998). Floral trait variation in four Cyclamen (Primu-laceae) species. Plant Systematics and Evolution, 212, 279-293.
Baker, H.G. (1955). Self compatibility and establishment after long distance dispersal.
Evolution, 9, 347-349.
Barrett, S.C.H. (1998). The evolution of mating strategies in flowering plants. Trends in Plant Science, 3, 335-341.
Barrett, S.C.H. (2002). The evolution of plant sexual diversity. Nature Reviews Genetics, 3, 274-284.
Barrett, S.C.H., Harder, L.D., and Worley, A.C. (1996). The comparative biology of pollination and mating in flowering plants. Philosophical Transactions of the Royal Soci-ety of London Series B-Biological Sciences, 351, 1271-1280.
Bosch, M., Simon, J., Molero, J., and Blanche, C. (2001). Breeding systems in tribe Del-phinieae (Ranunculaceae) in the western Mediterranean area. Flora, 196, 101-113. Brown, R. (1828). A brief account of microscopical observations made in the months of June, July and August, 1827, on the particles contained in the pollen of plants; and on the general existence of active molecules in organic and inorganic bodies. Philoso-phical Magazine, 4, 161-173.
Charnov, E.L. (1982). The theory of sex allocation. Princeton, New Jersey: Princeton University Press.
Cruden, R.W. (1977). Pollen-ovule ratios - conservative indicator of breeding systems in flowering plants. Evolution, 31, 32-46.
Cruden, R.W. (1997). Implications of evolutionary theory to applied pollination ecol-ogy. Acta Horticulturae, 437, 27-51.
Cruden, R.W. (2000). Pollen grains: why so many? Plant Systematics and Evolution, 222, 143-165.
Cruden, R.W., and Jensen, K.G. (1979). Viscin threads, pollination efficiency and low pollen-ovule ratios. American Journal of Botany, 66, 875-879.
Cruden, R.W., Lyon, D.L., Bock, J.H., and Linhart, Y.B. (1989). Facultative xenogamy: examination of a mixed mating system. In: J.H. Bock, and Y.B. Linhart (Eds.), The evo-lutionary ecology of plants (pp. 171-207). San Francisco: Westview Press.
Cruden, R.W., and Miller-Ward, S. (1981). Pollen-ovule ratio, pollen size, and the ra-tio of stigmatic area to the pollen-bearing area of the pollinator: an hypothesis. Evolu-tion, 35 964-974.
Darwin, C.R. (1862). The various contrivances by which orchids are fertilised by insects.
London: Murray.
Darwin, C.R. (1876). The effects of cross and self fertilisation in the vegetable kingdom.
London: Murray.
Darwin, C.R. (1877). The different form of flowers on plants of the same species. London: Murray.
de Jong, T., and Klinkhammer, P. (2005). Evolutionary ecology of plant reproductive strategies. New York: Cambridge University Press.
Diaz-Uriarte, R., and Garland, T. (1998). Effects of branch length errors on the per-formance of phylogenetically independent contrasts. Systematic Biology, 47, 654-672. Diaz-Uriarte, R., and Garland, T. (1996). Testing hypotheses of correlated evolution using phylogenetically independent contrasts: Sensitivity to deviations from Brownian motion. Systematic Biology, 45, 27-47.
Durka, W. (2002). Blüten- und Reproduktionsbiologie. In: S. Klotz, I. Kühn, and W. Durka (Eds.), BIOLFLOR - Eine Datenbank mit biologisch-ökologischen Merkmalen zur Flora von Deutschland (pp. 133-175). Bonn, Bad Godesberg: Bundesamt für Natur-schutz.
Edwards, A.W.F., and Cavalli-Sforza, L.L. (1964). Reconstruction of evolutionary trees. In: V.H. Heywood, and J. McNeill (Eds.), Reconstruction of evolutionary trees (pp. 67-76). London: Systematics Association.
Erbar, C., and Langlotz, M. (2005). Pollen to ovule ratios: standard or variation - a compilation. Botanische Jahrbücher, 126, 71-132.
Felsenstein, J. (1985). Phylogenies and the comparative method. American Naturalist, 125, 1-15.
Felsenstein, J. (1988). Phylogenies and quantitative characters. Annual Review of Ecol-ogy and Systematics, 19, 445-471.
Gallardo, R., Dominguez, E., and Munoz, J.M. (1994). Pollen-ovule ratio, pollen size, and breeding system in Astragalus (Fabaceae) subgenus Epiglottis - a pollen and seed allocation approach. American Journal of Botany, 81, 1611-1619.
Grafen, A. (1989). The phylogenetic regression. Philosophical Transactions of the Royal Society of London Series B-Biological Sciences, B326, 119-157.
Harder, L.D., and Barrett, S.C.H. (Eds.). (2006). Ecology and evolution of flowers. New York: Oxford University Press.
Harvey, P.H., and Pagel, M.D. (1991). The comparative method in evolutionary Biology.
Oxford: Oxford University Press.
Knight, T.A. (1799). An account of some experiments on the fecundation of vegeta-bles. Philosophical Transactions of the Royal Society of London, 89, 195-204.
Knuth, P. (1898-1904). Handbuch der Blütenbiologie. Vol1, 2.1, 2.2. Leipzig.
Lehnebach, C., and Riveros, M. (2003). Pollination biology of the Chilean endemic orchid Chloraea lamellata. Biodiversity and Conservation, 12, 1741-1751.
Lloyd, D.G. (1965). Evolution of self-compatibility and racial differentiation in Leav-enworthia (Cruciferae). Contributions from the Gray Herbarium of Harvard University, 195, 3-134.
Lopez, J., Devesa, J.A., Ortega-Olivencia, A., and Ruiz, T. (2000). Production and morphology of fruit and seeds in Genisteae (Fabaceae) of south-west Spain. Botanical Journal of the Linnean Society, 132, 97-120.
Maddison, W.P. (1990). A method for testing the correlated evolution of two binary characters: are gains and losses concentrated on certain branches of a phylogenetic tree. Evolution 44: 539-557.
Martins, E.P., Diniz, J.A.F., and Housworth, E.A. (2002). Adaptive constraints and the phylogenetic comparative method: A computer simulation test. Evolution, 56, 1-13. Martins, E.P., and Garland, T. (1991). Phylogenetic analyses of the correlated evolu-tion of continuous characters: a simulaevolu-tion study. Evolution, 45, 534-557.
Martins, E.P., and Hansen, T.F. (1997). Phylogenies and the comparative method: A general approach to incorporating phylogenetic information into the analysis of in-terspecific data. American Naturalist,
Martins, E.P., and Housworth, E.A. (2002). Phylogeny shape and the phylogenetic comparative method. Systematic Biology, 51, 873-880.
Maynard-Smith, J. (1982). Evolution and the theory of games. Cambridge: Cambridge University Press.
Mazer, S.J., and Hultgard, U.M. (1993). Variation and covariation among floral traits within and among 4 species of Northern European Primula (Primulaceae). American Journal of Botany, 80, 474-485.
Mehrhoff, L.A. (1983). Pollination in the genus Isotria (Orchidaceae). American Journal of Botany, 70, 1444-1453.
Mione, T., and Anderson, G.J. (1992). Pollen-ovule ratios and breeding system evolu-tion in Solanum section Basarthrum (Solanaceae). American Journal of Botany, 79, 279-287.
Moles, A.T., Ackerly, D.D., Webb, C.O., Tweddle, J.C., Dickie, J.B., and Westoby, M. (2005). A brief history of seed size. Science, 307, 576-580.
Neiland, M.R.M., and Wilcock, C.C. (1995). Maximisation of reproductive success by European Orchidaceae under conditions of infrequent pollination. Protoplasma, 187, 39-48.
Paradis, E., and Claude, J. (2002). Analysis of comparative data using generalized estimating equations. Journal of Theoretical Biology, 218, 175-185.
Philbrick, C.T., and Anderson, G.J. (1987). Implications of pollen-ovule ratios and pollen size for the reproductive biology of Potamogeton and autogamy in aquatic an-giosperms. Systematic Botany, 12, 98-105.
Pagel, M. (1994). Detecting correlated evolution on phylogenies: a general method for the comparative analysis of discrete characters. Proceedings of the Royal Society B - Bio-logical Science,255, 37-45
Pagel, M., Meade, A., and Barker, D. (2004). Bayesian estimation ofancestral character states on phylognies. Systematic Biology, 53, 673-684.
Preston, R.E. (1986). Pollen-ovule ratios in the Cruciferae. American Journal of Botany, 73, 1732-1740.
Purvis, A., Gittleman, J.L., and Luh, H.K. (1994). Truth or consequences - effects of phylogenetic accuracy on 2 comparative methods. Journal of Theoretical Biology, 167, 293-300.
Purvis, A., and Rambaut, A. (1995). Comparative analysis by independent contrasts (Caic) - an Apple-Macintosh application for analyzing comparative data. Computer Applications in the Biosciences, 11, 247-251.
Queller, D.C. (1984). Pollen-ovule ratios and hermaphrodite sexual allocation strate-gies. Evolution, 38, 1148-1151.
Ridley, M. (1983). The explanation of organic diversity: the comparative method and adapta-tions for mating. Oxford: Oxford University Press.
Rodriguez-Riano, T., Ortega-Olivencia, A., and Devesa, J.A. (1999). Biologia floral en Fabaceae. Madrid: CSIC.
Sanford, G.M., Lutterschmidt, W.I., and Hutchison, V.H. (2002). The comparative method revisited. Bioscience, 52, 830-836.
Silvertown, J., and Dodd, M. (1997). Comparing plants and connecting traits. In: J. Silvertown, M. Franco, and J.L. Harper (Eds.), Plant life histories: Ecology, phylogeny and evolution (pp. 3-16). Cambridge: Cambridge University Press.
Stebbins, G.L. (1957). Self-fertilization and population variability in the higher plants.
American Naturalist, 91, 337-354
Tate, J.A., and Simpson, B.B. (2004). Breeding system evolution in Tarasa (Malvaceae) and selection for reduced pollen grain size in the polyploid species. American Journal of Botany, 91, 207-213.
Uma Shaanker, R., and Ganeshaiah, K.N. (1984). Does pollination efficiency shape the pollen grain to ovule ratio. Current Science, 53, 751-753.
Vasek, F.C., and Weng, V. (1988). Breeding systems of Clarkia sect. Phaeostoma (Ona-graceae) .1. Pollen-ovule ratios. Systematic Botany, 13, 336-350.
Wyatt, R., Broyles, S.B., and Lipow, S.R. (2000). Pollen-ovule ratios in milkweeds (As-clepiadaceae): an exception that probes the rule. Systematic Botany, 25, 171-180.
Chapter 2 The relationship between seed size and the pollen-ovule ratio – a comparative test of sex allocation theory
Authors: Lars Götzenberger, Ingolf Kühn, Walter Durka, Stefan Klotz
Published in Evolutionary Ecology Research 8: 1101-1116
Abstract
Hypothesis: Sex allocation theory predicts that the pollen-ovule ratio should increase linearly with increasing seed size among seed plants (Charnov 1982).
Data examined: We retrieved data for pollen-ovule ratio, seed size and possible con-founding variables (ovule number, plant height, mating system) from a database and additional literature for 299 angyosperm plant species of the German flora.
Methods: We analyzed uncorrected cross species data as well as phylogenetically independent contrasts (PIC) with model II regressions and (partial) correlations. Results: A linear positive correlation between pollen-ovule ratio and seed size exists across all plant species analyzed and within different mating systems for phyloge-netically corrected and uncorrected data. This positive correlation remained valid when we controlled for the effect of possible confounding variables.
Conclusions: The interspecific variation of the pollen-ovule ratio depends – at least partly – on the allocation of resources to female sexual function.
Chapter 3 The relationship between pollen size and the pollen-ovule ratio – another compara-tive test of sex allocation theory
Authors: Lars Götzenberger, Walter Durka, Ingolf Kühn, Stefan Klotz
Published in Evolutionary Ecology Research 9: 1145-1161
Abstract
Hypothesis: Sex allocation theory predicts that the pollen-ovule ratio should decrease linearly with increasing pollen size among seed plants (Charnov 1982).
Data examined: We retrieved data for pollen-ovule ratio, pollen size, pollen grain number and mating system from published literature for 311 angiosperm plant spe-cies.
Methods: We used model II regressions on cross species data as well as on phyloge-netically independent contrasts (PIC) to quantify the relationship between pollen-ovule ratio and pollen size. Partial correlations were applied to test if an association between these two traits arises because of correlation with a third variable, the pollen grain number.
Results: A linear negative correlation between pollen-ovule ratio and pollen size does exist for these plant species, both in phylogenetically corrected and uncorrected data. However, the correlation was not consistently found at the taxon and mating system levels. For virtually all groups investigated, the correlation disappeared when we controlled for the effect of pollen grain number. Thus the correlation between pollen-ovule ratio and pollen size is spurious.
Conclusions: Considering male function, the pollen-ovule ratio depends on the num-ber of pollen grains produced by a flower but not on the size of the pollen grains. For the “male part” of Charnov’s model, the validity is put into question.
Chapter 4 The effect of habitat disturbance and pol-lination type on the inter-specific varia-tion in pollen-ovule ratios
Author: Lars Götzenberger, Ingolf Kühn, Stefan Klotz
Submitted to Preslia
Abstract
In this study WE examined two important factors that are thought to govern inter-specific variation in pollen-ovule ratios. First, WE wanted to know if habitat distur-bance has an effect on pollen-ovule ratio variation. The second factor studied was the pollination type, used as an approximation for the efficiency of pollination. Because seed mass is known to be strongly correlated with the pollen-ovule ratio it was also included in the analyses to examine if a possible effect of habitat disturbance or pol-lination type is still valid after accounting for the effect of seed mass. Furthermore, phylogenetically comparative methods were applied to investigate whether correla-tive patterns between traits were maintained through evolutionary history or are only present in recent species data, i.e. in analyses that do not consider phylogenetic relationships between species. In conflict with the reproductive assurance hypothe-sis, habitat disturbance did not have any significant effect on interspecific pollen-ovule ratio variation. In contrast, pollination type could explain a significant portion of variation in pollen-ovule ratios, even when the strong effect of seed mass was ac-counted for. General results do not differ between the cross species and the phyloge-netic comparative method approach. These results are in line with predictions from sex allocation theory but simultaneously agree with the proposition that the chance of a pollen grain reaching a stigma governs the pollen-ovule ratio.
Chapter 5 Can we use seed size to estimate pollen-ovule ratios - An approach using mixed effect models to incor-porate taxonomical information
Authors: Lars Götzenberger, Ingolf Kühn, Stefan Klotz
Submitted to American Journal of Botany
Abstract
The pollen-ovule ratio, the number of pollen grains produced per ovules in a flower, is correlated with a plants mating system. Therefore, pollen-ovule ratios are often used as an easily obtainable estimator of mating systems. The pollen-ovule ratio is also highly correlated with seed size. Since data on pollen-ovule ratios is restricted to some 1400 species but seed size data is available for a manifold number of species, we asked the question if seed size could serve as an estimator for the pollen-ovule ratio. We set up a linear mixed effects model for 264 species with the taxonomy of the species as a nested random effect. With this type of regression model we could ac-count for the taxonomical variation in the seed size-pollen-ovule relationship. As a result, we were able to predict pollen-ovule ratios from seed size with high accuracy. We propose to apply the method to further datasets to validate its potential as a tool for the estimation of pollen-ovule ratios.
Chapter 6 Synthesis
In this chapter I discuss the results obtained in chapters 2 to 5 and highlight the most important findings. Throughout this chapter, I point out which further approaches in studying variation in pollen-ovule ratio appear meaningful.
6.1 Pollen-ovule ratios and Charnov’s model
Charnov’s (1982) idea that pollen-ovule ratios are a direct consequence of resource allocation to female and male sex function has only been considered further on a theoretical basis in a small number of articles. Queller (1984) pointed out that while most of the theoretical work on sex allocation is grounded in an intraspecific context, pollen-ovule ratios and the mathematical model of Charnov provide an interesting opportunity to put sex allocation in an interspecific context.
Furthermore, Queller showed theoretically that though Charnov’s and Cruden’s views appear to be contradictive at first, they are in fact not mutually exclusive and the findings of Cruden (1977; Cruden and Jensen 1979; Cruden and Miller-Ward 1981) are in line with sex allocation theory.
For some further considerations recall equation 1.3, which can be rewritten as
− + = r r C C O P 1 log log log 1 2 Equation 6.1
since log C2 – log C1 = log(C2/C1). The log(r/1-r) term accounts for variation in pol-len-ovule ratios caused by different ways of packaging male and female resources within any given log(C2/C1). In the analyses in chapter 2 and 3 I have assumed that within a given mating system log(r/1-r) is constant, based on the notion of Charnov (1982) that within a mating system allocation reflects an evolutionary stable strategy. This assumption seemed to be valid as no significant differences between slopes of the pollen-ovule ratio – seed size relationship or between slopes of the pollen-ovule ratio – pollen size relationship were found.
De Jong and Klinkhammer (2005, p. 137) extended the mathematical model of Char-nov by adding a term to account for the fact that in many plants not all ovules de-velop into a seed. There was not sufficient data on seed/ovule ratios for the species in our analyses to explicitly account for such a possible effect. However, such an ef-fect does not seem to influence our general results. Given that outcrossing species are expected to have smaller seed ovule ratios than selfing species (Wiens 1984), we would expect the slope parameters predicted by Charnov’s model to differ between these groups. As mentioned above, a difference among slopes of different mating systems was not found for the relationship between seed size and pollen-ovule ratio (chapter 2) neither for the relationship between pollen size and pollen-ovule ratio (chapter 3).
There are two further factors that might influence the trait relationships predicted by Charnov’s model that were not studied in detail in this thesis. Firstly, the assumption of sex allocation theory, that male and female investments are drawn from the same limited resource pool may be wrong because investment in maturing seeds can also be assimilated from post-flowering photosynthesis (Seger and Eckhart 1996). We could not account for a possible effect of this phenomenon in our comparative analy-ses. Second, allocation to male and female function is hypothesized to alter with plant size for several reasons (see review in de Jong and Klinkhammer 2005, chapter 9). In the case of the seed size – pollen-ovule relationship we could not detect an in-fluence of plant size (chapter 2).
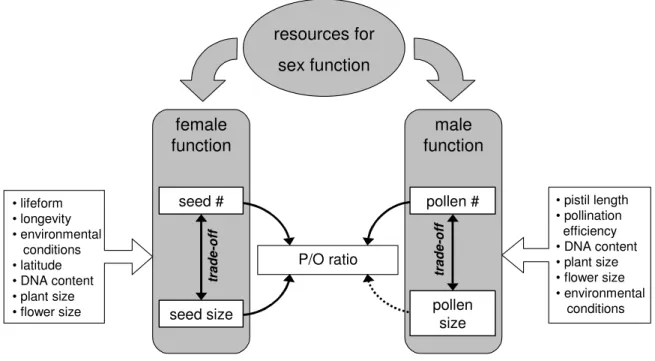
Clearly, the relationship between seed size and pollen-ovule ratio and pollen size and pollen-ovule ratio is less clear-cut than would be expected from Charnov’s model. The deviation of the data from the predictions are caused by two major as-pects: (1) The assumptions of the model are not met by the actual biological data and (2) the pollen-ovule ratio is part of a complex system of intercorrelated traits which are subject to different selection pressures. I suppose that Charnov’s “mechanistic” model of the allocation to seeds and pollen grains and its resulting pollen-ovule ra-tios provide the basis for understanding interspecific variation in pollen-ovule rara-tios but that this basis is altered according to the way the size and number of ovules/seeds and pollen grains adapt to a wide spectrum of specific conditions (Fig-ure 6.1). There is strong evidence for a size/number trade off for seeds (Shipley and Dion 1992; Jakobsson and Eriksson 2000; but see Moles et al. 2004a; Greenway and Harder 2007) as well as for pollen grains (Vonhof and Harder 1995; Yang and Guo 2004). Hence, a factor influencing pollen size indirectly affects pollen number and vice versa, and a factor influencing seed size indirectly affects seed number and vice versa. Some factors, like DNA content or plant size, may influence seed and pollen characteristics, while others primarily affect either seed traits or pollen traits (e.g. pistil length). Since the pollen-ovule ratio is a mere mathematical construct, none of the factors governs the pollen-ovule ratio directly. The effect is always mediated through sizes and numbers of pollen and ovules/seeds. However, I found a striking difference between analyses of the correlation of pollen-ovule ratio with seed size, and the correlation of pollen-ovule ratio with pollen size. The latter could be ex-plained by the trade off between pollen size and number alone (chapter 3) while for the former, seed size had an effect on pollen-ovule ratios independent of the seed size/seed number trade-off (chapter 2).
The direct relation between seed size and pollen-ovule ratio (chapter 2) is especially intriguing. This relationship suggests a possible link that connects mating system biology and seed ecology as was already mentioned by Preston (1986). He stated that “if this correlation [between seed size and the pollen-ovule ratio] indicates that re-sources allocated to male and female function are not independent, then factors in-fluencing variation in seed size, such as seed dispersability and seedling establish-ment, might also influence the pollen-ovule ratio.” The positive association between seed mass and the pollen-ovule ratio is also interesting from a plant’s strategic view-point. Species with large seeds, i.e. a high competition ability but low dispersal
tential and short longevity in the soil, tend to be predominantly outcrossing. Small seeded species with low competition ability, high dispersal potential, and high lon-gevity in the soil are predominantly selfing. This view may be simplistic. For in-stance, also relatively heavy seeds can disperse over great distances with the help of assisting structures like wings. However, it shows a general pattern that has not re-ceived much attention though it might bear implications for the reproductive strate-gies found in plants. Except for the well studied correlation between dioecy and fleshy fruits (Bawa 1980; Thomson and Brunet 1990; Vamosi and Vamosi 2004), polli-nation ecology and seed ecology are rarely studied in an integrated approach, maybe as a result of the traditional separation of these two subjects. Though the processes of pollination, seed dispersal, and establishment are phenologically separated, the in-volved characters are affected by similar factors and are components of the same functional and morphological structures. For further studying interspecific variation in pollen-ovule ratios more data should be collected to be able to analyze the factors involved (see Figure 6.1) in a fully integrated approach.
P/O ratio resources for sex function female function male function pollen size pollen # seed # seed size • pistil length • pollination efficiency • DNA content • plant size • flower size • environmental conditions • lifeform • longevity • environmental conditions • latitude • DNA content • plant size • flower size tr a d e -o ff tr a d e -o ff
Figure 6.1 Empirical and hypothetical relationships between seed size, seed number, pollen size, pollen number, and pollen-ovule ratio. The traits are shown as components of an inte-grated complex. Investment of resources to male and female function is limited to investment in seeds and pollen grains. The size and number of pollen grains and seeds are governed by numerous factors that indirectly also influence variation in pollen-ovule ratios. Solid lines depict established direct relationships (chapters 1 and 2). A negative relationship between pollen size and pollen-ovule ratio (dashed arrow) is predicted by Charnov’s model, but only exists indirectly (chapter 2).
6.2 The effect of phylogeny and taxonomy
This thesis provides the first study of the relationship between pollen-ovule ratio and other plant traits that is explicitly based on phylogenetically informed comparative analyses. In a critical review of PIC, Price (1997) objected as a major problem of any PIC analysis and cross species analysis that correlation between traits may be spuri-ous, i.e. confounded by unmeasured variables and thus correlation does not imply causal relationships. That is, a correlation between two traits may simply be observed because both traits are associated with one or several other traits that are not in-cluded in the analyses. I tried to minimize this problem by including variables that were likely to covary with the traits studied and by using partial correlation (chap-ters 2 and 3), and multiple regression and hierarchical partitioning (chapter 4) to ana-lyze trait associations. Price (1997) also opposed authors that advocate to use only PCM for evolutionary questions by stating that “Differences between species and contrast correlations are likely to be of biological significance, suggesting predictable patterns of change…”. Throughout chapter 2 - 4 most of the results for cross species analysis are similar or even nearly identical to the results of PCM. Hence, the ob-served patterns are not only a product of current adaptation but of processes that maintained throughout evolutionary history. This is especially the case when data were analyzed with PIC (chapters 2 and 3) because a correlation of contrasts meas-ures if the change in a variable is correlated with the change in another variable along the branches of a phylogenetic tree.
In chapter 5 a statistical approach was applied that could also be used to account for the effect of phylogeny, especially when the phylogeny of the studied species is un-known. The method of mixed effect models divides the explanatory variables into random and fixed effects, allowing to account for variation within groups that are defined by the random effects. In chapter 5, however, the method of linear mixed effect models was used to increase the accuracy of predicting pollen-ovule ratios from seed mass by accounting for the variation in the seed size – pollen-ovule ratio relationship within taxonomical groups. Predicted pollen-ovule ratios from mixed effect models were in deed more accurate than predicted pollen-ovule ratios from regression models that did not account for the effect of taxonomy. This result reflects the different patterns in the relationship between the pollen ovule ratio and seed size and emphasizes the importance of considering pollen-ovule ratios and its relation-ship with other traits in a taxonomical context. It is possible to find major general patterns across a great range of taxonomic groups but investigated at lower taxa lev-els these patterns can be absent or even reversed (chapter 2 and 3).
6.3 Correlated evolution
The traits that I found to correlate with the pollen-ovule ratio can evolve in a corre-lated way with the pollen-ovule ratio for two general reasons (Felsenstein 2004, p. 420): (1) The traits are genetically correlated or (2) the selection pressure on the traits are correlated or identical. These two possibilities are not mutually exclusive.
Genetic correlation is given when a selection for the increase or decrease in one trait is followed by a systematic change in the second trait because the two traits are linked by two or more genes or because of pleiotropic effects, i.e. two or more traits are the product of one single gene (Lande and Arnold 1983). A possible genetic corre-lation between seed size or pollen size and the pollen-ovule ratio has not been inves-tigated so far. Whether such correlations should be expected remains speculation since studies of genetic correlations between male and female investment have gained equivocal results (Charlesworth and Morgan 1991; Brunet 1992; Fenster and Carr 1997; Mazer et al. 1999; Campbell 2000). Mazer (1998) also proposed that results for such investigations may be dependent on whether the study was conducted on an intra-floral or an intra-individual level. Evidence for genetic correlation can only be provided by selection experiments. The results for the interspecific phenotypic correlation between seed size and pollen-ovule ratio (chapter 2) suggest that selection experiments could be a next step for investigating the relationship of the pollen-ovule ratio with floral traits on an intraspecific level.
A possible common selection pressure on seed size and pollen-ovule ratio was inves-tigated in chapter 4, studying the effect of habitat disturbance on interspecific varia-tion in pollen-ovule ratios. However, different degrees of habitat disturbance only affect seed size but not pollen-ovule ratios. Though the intentional question of this paper, if an effect of habitat disturbance on pollen-ovule ratio is accounted for by co-variation with seed size, was not directly suited to answer the problem mentioned above, the unexpected result suggests that habitat disturbance is not a common selec-tion pressure on seed size and pollen-ovule ratios. Other environmental variables are conceivable as selection pressure on both, seed size and pollen-ovule ratios. For in-stance, seed size is correlated with latitude (Moles and Westoby 2003; Moles et al. 2004b). Although the foundations for this correlation are not yet completely under-stood it would be interesting to investigate if a correlation with latitude also exists for the pollen-ovule ratio.
6.4 Conclusions
This thesis is the first work that attempts to explain the interspecific variation in pol-len-ovule ratios by analyzing large numbers of species with help of the comparative method while including information on the phylogeny of the species under study. With this approach it was possible to analyse which factors govern pollen-ovule ra-tios among current species but also if correlation between pollen-ovule rara-tios and other traits are the result of evolutionary history.
The following conclusions can be drawn from results in chapters 2-5:
• Charnov’s model for the allocation of resources to seeds and pollen grains can only partially explain variation in pollen-ovule ratios. Contradicting the model, pollen-ovule ratios do not decline with increasing pollen size after ac-counting for the effect of pollen grain number. In contrast, pollen-ovule ratio does scale with seed size as predicted by Charnov’s model, even after
ing for the effect of seed number. Because it suggests a link between pollina-tion/mating system biology and seed ecology, the association between seed size and pollen-ovule ratio merits further research.
• There is no difference in average pollen-ovule ratios between disturbed and undisturbed habitats. Thus, pollen-ovule ratios do not support the reproduc-tive assurance hypothesis. Instead, pollen-ovule ratios reflect a wide range of sexual reproduction strategies in both types of habitat.
• Pollination type, which can be viewed as a qualitative measure of pollination efficiency, influences pollen-ovule ratios. Since this relationship is also evident when accounting for the effect of seed size, Cruden’s statement that “pollen-ovule ratios reflect the likelihood of sufficient pollen grains reaching each stigma to result in maximum seed set” is valid. Cruden’s and Charnov’s view on variation in pollen-ovule ratios are not mutually exclusive and complement each other.
• The detected patterns in pollen-ovule ratio variation are not only evident for current species but also are evolutionary correlated. That is, changes in pollen-ovule ratios through evolutionary time are accompanied by changes in traits like seed size or pollination type.
• When taxonomical variation is accounted for, seed size can be used as an ac-curate estimator of pollen-ovule ratios.
6.5 References
Bawa, K.S. (1980). Evolution of dioecy in flowering plants. Annual Review of Ecology and Systematics, 11, 15-39.
Brunet, J. (1992). Sex allocation in hermaphroditic plants. Trends in Ecology and Evolu-tion, 7, 79-84.
Campbell, D.R. (2000). Experimental tests of sex-allocation theory in plants. Trends in Ecology and Evolution, 15, 227-232.
Charlesworth, D., and Morgan, M.T. (1991). Allocation of resources to sex functions in flowering plants. Philosophical Transactions of the Royal Society of London, Series B., 332, 91-102.
Charnov, E.L. (1982). The theory of sex allocation. Princeton: Princenton University Press.
Cruden, R.W. (1977). Pollen-ovule ratios - conservative indicator of breeding systems in flowering plants. Evolution, 31, 32-46.
Cruden, R.W., and Jensen, K.G. (1979). Viscin threads, pollination efficiency and low pollen-ovule ratios. American Journal of Botany, 66, 875-879.
Cruden, R.W., and Miller-Ward, S. (1981). Pollen-ovule ratio, pollen size, and the ra-tio of stigmatic area to the pollen-bearing area of the pollinator: an hypothesis. Evolu-tion, 35 964-974.
de Jong, T., and Klinkhammer, P. (2005). Evolutionary ecology of plant reproductive strategies. New York: Cambridge University Press.
Felsenstein, J. (2004). Inferring Phylogenies. Sunderland: Sinauer Associates.
Fenster, C.B., and Carr, D.E. (1997). Genetics of sex allocation in Mimulus (Scrophu-lariaceae). Journal of Evolutionary Biology, 10, 641-661.
Greenway, C.A., and Harder, L.D. (2007). Variation in ovule and seed size and asso-ciated size-number trade-offs in angiosperms. American Journal of Botany, 94, 840-846. Jakobsson, A., and Eriksson, O. (2000). A comparative study of seed number, seed size, seedling size and recruitment in grassland plants. Oikos, 88, 494-502.
Lande, R., and Arnold, S.J. (1983). The measurement of selection on correlated char-acters. Evolution, 37.