June 2, 2009
COMMISSION ON THE MEASUREMENT
OF ECONOMIC PERFORMANCE AND SOCIAL PROGRESS
___________________________________________
DRAFT SUMMARY
______________
(PROVISIONAL AND INCOMPLETE)1. The Commission on the Measurement of Economic Performance and Social Progress (CMEPSP, also called “the commission” in the following text) has been launched in February 2008 by the President of the French Republic. It started its work at the end of April 2008. After one year, the commission has nearly completed its tas, but its members are still working on issues raised during former plenary meetings or subgroup meetings. The present document is hence a provisional summary of the commission’s work. Its aim is to collect comments and suggestions from the civil society at a time when it is still possible to consider them.
2. If readers of the present draft summary want to communicate comments and/or suggestions to the commission, they have to click on the place indicated at the end of the homepage of the commission. They will access an e-mail form where to write and send their comments and/or suggestions to the secretariat of the commission. The deadline is July 5, 2009.
TABLE OF CONTENTS
INTRODUCTION... 3
CHAPTER 1 – CLASSICAL GDP ISSUES... 6
1. GDP, prices and living standards... 6
2. Imputations – comprehensiveness versus comprehensibility... 9
3. What can be done within the existing measurement framework?... 11
3.1. Emphasize national accounts aggregates other than GDP... 11
3.2. Improving the measurement of government-provided services... 14
3.3. Revisit the concept of ‘defensive’ expenditures... 17
3.4. Income and wealth come together... 19
4. Bringing out the household perspective... 21
4.1. Adjusting household income measures for government services in kind... 21
4.2. Medians and means - distribution of market income... 24
4.3. Broader measures of households’ economic activity... 29
4.4. Distribution of full income... 35
CHAPTER 2 – QUALITY OF LIFE... 36
1. Introduction... 36
2. Conceptual approaches to measuring quality of life... 37
3. Subjective measures of quality of life... 39
4. Objective features shaping quality of life... 42
4.1. Health... 42
4.2. Education... 44
4.3. Personal activities... 46
4.4. Political voice and governance... 49
4.5. Social connections... 51
4.6. Environmental conditions... 52
4.7. Personal insecurity... 54
4.8. Economic insecurity... 55
5. Cross-cutting issues... 57
5.1. Assessing links across quality of life dimensions... 57
5.2. Inequalities in quality of life... 58
5.3. Aggregating across quality of life dimensions... 60
CHAPTER 3 – SUSTAINABLE DEVELOPMENT AND ENVIRONMENT... 62
1. Introduction... 62
2. Taking stock... 64
2.1. Dashboards or sets of indicators... 65
2.2. Composite indexes... 67
2.3. Adjusted GDPs... 69
2.4. Indexes focusing on overconsumption or underinvestment... 74
2.4.1. Adjusted net savings (ANS)... 74
2.4.2. Footprints... 78
3. Summarizing sustainability with a single number: why is it so difficult ?... 81
3.1. What do we want to measure ?... 81
3.2. What would be the requirements of an appropriate index ?... 84
3.3. Technological uncertainties argue in favor of a more hybrid approach... 86
3.4. Uncertainty is also normative... 88
3.5. An additional source of complexity: the transnational dimension... 90
I
NTRODUCTION3. The Issues Paper produced by the commission in July 2008 has played an important role in the organization of the work of the commission. It underlined the existence of a huge distance between standard measures of important socio economic variables like growth, inflation, inequalities, etc. and widespread perceptions by the population; the gap is so large and so universal that it cannot be explained by reference to money illusion and/or to psychological characteristics of human nature. Our statistical apparatus, which may have served us well in a not too distant past, is in need of serious revisions.
4. The creation of the commission is reflecting this concern. As its name suggests, its focus is on the measurement of economic performance and social progress. Currently, the most widely used metric is GDP (gross domestic product.) Its aim is to identify the limits of GDP as an indicator of economic performance and social progress, to consider additional information required for the production of more relevant indicators, to discuss how to present this information in an appropriate way, and to assess the feasibility of alternative measurement tools.
5. Indeed, for a long time there have been increasing concerns about the adequacy of current measures of economic performance, in particular those based on GDP figures. Moreover, there are even broader concerns about the relevance of these figures as measures of societal well-being. The inadequacies of these figures from the perspective of sustainability-- economic, environmental, and social sustainability-- have been of particular concern.
6. One outcome of the Commission’s work will be suggestions for alternative indicators which may provide a better description of economic performance and social progress. Taking stock of similar work conducted in the past, the Commission will be cautious about the number of indicators proposed. Here, as elsewhere in economics, there are trade-offs: a larger number of indicators may better reflect the diversity of issues and individual situations, but an excessively large number may provide a confused picture of the overall situation. On the other hand, a single figure mixing a large number of socio-economic phenomena provides an inadequate basis for appropriate policy measures.
7. Any statistical indicator has to aggregate variables that are, in some sense, incommensurate. In estimating GDP, we add up apples and oranges; and we aggregate them together using relative prices. If an orange sells for twice the price of an apple, then each orange is counted as two apples. The justification of this is that in competitive markets, relative prices reflect marginal relative valuations. An orange is valued by all consumers as “worth” twice as much as an apple. While even in market transactions, this assumption may be questioned (for instance, when markets are imperfect), when moving beyond GDP to areas where there are limited or no market transactions, the relevance of a monetary metrics becomes more questionable. The choice of alternative metrics has to be assessed both from a conceptual and practical point of view.
8. To organize its work, the Commission selected three main directions of study which correspond to three of the already identified main causes of divergences between perceptions and measures. (i) Classical GDP issues. Limits of GDP as an indicator of socio-economic progress or economic performance can be addressed by investigating possible extensions or modifications of the current conceptual framework; (ii) Quality of life. This direction of study is approaching the measurement of social progress from a broader perspectives on well-being, taking also into account metrics derived from asking 4
people about how they themselves feel; (iii) Sustainable development and environment. As noted above, one of the biggest concerns about current measures of economic performance and social progress is related to sustainability and one of the areas where sustainability is most questioned is the environment.
9. The present Draft Summary is accordingly structured into three summary chapters based on the work of the three sub-groups created by the Commission on the occasion of its first plenary meeting:
- Classical GDP issues - Quality of life
- Sustainable development and environment
C
HAPTER1 – C
LASSICALGDP I
SSUES1. GDP, prices and living standards
10. Gross domestic product (GDP) is the most widely used measure of economic activity. There are international standards for its calculation and much thought has gone into its statistical and conceptual bases. But GDP is a measure of mainly market production, though it has often been treated as if it were a measure of economic well-being. Doing so can lead to misleading indications about how well-off people are and entail the wrong policy decisions.
11. One of the reasons why money measures of performance and living standards have come to play such an important role in our societies is that monetary valuation of goods and services makes it easy to add up quantities of a very different nature. When we know the prices of apple juice and of DVD players, we can add up the values of apple juice and DVD players and make statements about production and consumption in a single figure. But market prices are more than an accounting device. Economic theory tells us that when markets are functioning, the ratio of one market price to another is reflective of the relative appreciation of the two products by those who purchase them. GDP captures all final goods in the economy, whether they are consumed by households, firms or government. Valuing them with their prices would thus seem to be a good way of capturing, in a single number, how well-off society is at a particular moment. And keeping prices unchanged while observing how quantities of goods and services that enter GDP move over time would seem like a reasonable way of making a statement about how society’s living standards evolve in real terms.
12. As it turns out, things are more complicated. First, prices may not exist for some goods and services (if for instance government provides free health insurance or if households are engaged in child care) and there is a question how to value these services. Second, even where there are market prices, they may deviate from society’s underlying valuation. In particular, when the acts of consumption or production of individuals affect society as a whole, the price that individuals pay for a product will differ from its value to society at large. Environmental damage caused by production or consumption activities that is not reflected in market prices is a well-known example.
13. There is yet another problem. While it is straight forward to talk about ‘prices’ and ‘quantities’ in concept, defining and measuring price and quantity changes in practice is altogether a different matter. As it happens, many products change over time – they disappear entirely or there are new features added to them. Quality change can be very rapid in areas like information and communication technologies. And there are products whose quality is complex, multi-dimensional and hard to measure such as medical services, education services, research activities or financial services. There are also problems associated with the collection of data, in an era where an increasing fraction of sales are done over the internet and at sales as well as discount stores. As a consequence, capturing quality change correctly is a tremendous challenge for statisticians and yet it is vital to measuring real income and real consumption, some of the key determinants of people’s well-being. Under-estimating quality improvements is equivalent to over-estimating the rate of inflation and therefore equivalent to under-over-estimating real income. For instance, in the mid-90s, a report reviewing the measurement of inflation in the United States (Boskin Commission Report) estimated that insufficient accounting for quality improvement of goods and services led to an annual over-estimation of inflation by 0.6%.
14. The debate in Europe has tended to go the opposite way: official price statistics have been criticized for under-estimating inflation. Partly, this has been because people’s perception of inflation differs from the national averages that are presented in the consumer price index. Partly, this has been because it is felt that statisticians over-adjust for quality improvements of products, thereby painting too rosy a picture of the real income situation of citizens.
15. For market prices to be reflective of consumer’s appreciation of goods and services it is also necessary that consumers are free to choose and dispose of the necessary information. It takes little imagination to argue that this is not always the case. Complex financial products are an example where consumer ignorance prevents market prices from playing their role as carriers of correct economic signals. Complex and ever-changing bundles of services offered by telecommunication companies are another case in point where it is difficult to ensure transparency and comparability of price signals.
16. All the above considerations imply that in temporal and spatial comparisons, price signals have to be interpreted with care. For a number of purposes, they do not provide a useful vehicle for aggregation of quantities. This does not imply that the use of market prices in constructing measures of economic performance is generally flawed. But it suggests prudence, in particular with regard to the single, and often over-emphasized measure, GDP.
17. This Chapter suggests five ways of dealing with some of the deficiencies of GDP as an indicator of living standards. First, inside the national accounts emphasize other, and normally well-established - indicators than GDP. Second, improve the empirical measurement of key production activities, in particular the provision of health and education services. Third, bring out the household perspective which is most pertinent for
considerations of living standards. Fourth, add information about income and wealth distribution to data on the average evolution of income and wealth. Finally, we can think about widening the scope of what is being measured. In particular, a significant part of economic activity happens outside markets and is often not reflected in established national accounts. However, when there are no markets, there are no market prices and valuing such activities requires estimates (‘imputations’). These are meaningful but they come at a cost, and we shall discuss them before turning to the other proposals...
2. Imputations – comprehensiveness versus comprehensibility
18. Imputations exist for two related reasons. First is for reasons of comprehensiveness. There are productive activities and associated income flows (typically non-monetary) that take place outside the market sphere and some of them have been incorporated into GDP. The single most important imputation is a consumption value for the services that home owners derive from living in their own dwellings. There is no market transaction and no payment takes place but the national accounts treat this situation as if home-owners paid a rent to themselves. Most people would agree that two persons with the same money income but one of them living in his/her own house and the other renting are not equally well off - hence the imputation to better compare incomes over time or between countries. This brings us to the second reason for imputations, the invariance principle: the value of main accounting aggregates should not depend on the institutional arrangements in a country. For example, if exactly the same medical services are provided in one case by the public sector and in another case by the private sector, overall measures of production should be unaffected by a switch between the two institutional settings. The main advantage of adhering to the invariance principle is better comparability, over time and
between countries. Therefore, for instance, measures of ‘adjusted disposable income’ for households (see below) include an imputation for government services provided directly to citizens.
19. Imputations are more or less sizeable, depending on the country and on the national accounts aggregate considered. The table below indicates that the main imputations account for about one third of adjusted disposable income of households in the two European countries and for just over 20% in the United States, with a rising tendency in all three countries. Thus, the living standards of French and Finnish households would be understated relative to the United States in the absence of imputations.
Table 1: Major imputed and non-imputed components of adjusted disposable household income
1985 2007 1985 2007 1985 2006
Imputed rents 6.9% 10.1% 8.8% 10.1% 9.2% 12.2%
Financial services including FISIM 3.3% 1.5% 2.9% 4.3% 1.9% 2.3%
Social transfers in kind 17.3% 19.0% 7.9% 8.3% 19.5% 22.3%
Total imputations 27.4% 30.6% 19.6% 22.8% 30.6% 36.8%
Other disposable income (not imputed) 72.6% 69.4% 80.4% 77.2% 69.4% 63.2% Total adjusted disposable income 100.0% 100.0% 100.0% 100.0% 100.0% 100.0%
France USA Finland
Source: OECD annual national accounts.
20. But imputations come at a price. One is data quality: imputed values tend to be less reliable than observed values because they require assumptions about implicit transactions. The other is the effect of imputations on the comprehensibility of national accounts. Not all imputations are perceived as income-equivalent by people and the result may be a discrepancy between the changes in perceived and the changes in measured income. This problem is reinforced when we widen the scope of economic activity to include other services that are not mediated by the market. Our estimates below for household work amount to around 30% of conventionally-measured GDP. And another
80% or so are added when leisure is valued as well. It is undesirable to have assumption-driven data so massively influencing overall aggregates.
21. There is no easy way out of the tension between comprehensiveness and comprehensibility except keeping both elements of information available for users and keeping a distinction between core and satellite accounts. A full set of household accounts, for example, may not be well placed in the core of national accounts aggregates. But a satellite account that comes up with a valuation of comprehensive forms of household production can be useful information.
3. What can be done within the existing measurement framework?
3.1. Emphasize national accounts aggregates other than GDP
22. A first step towards mitigating some of the criticism of GDP as a measure of living standards is to emphasize national accounts aggregates other than GDP. For example, one would like to account for depreciation and thus deal with net rather than gross measures
of economic activity.
23. Gross measurestake no account of depreciation of capital goods. If a large amount of output produced has to be set aside to renew machines and other capital goods, society’s ability to consume is less than it would have been if only a small amount of set-aside were needed. The reason that economists have relied more heavily on GDP than on net domestic product (NDP) is, in part, that depreciation is hard to estimate. When the structure of production remains the same, GDP and NDP move closely together. But in recent years, the structure of production has changed. Information technology (IT) assets have gained importance as capital goods. Life expectancy of computers and software is 11
shorter than of steel mills. On those grounds, the discrepancy between GDP and NDP may be increasing, and by implication, volume NDP may be increasing less rapidly than GDP. For example, real GDP in the United States rose by about 3% per year during the period 1985-2007. Depreciation rose by 4.4% over the same period. As a consequence, real net national product grows at a slower rate than GDP.
24. Of greater concern for some countries is that the standard depreciation measures have not taken into account the depletion of scarce natural resources, and the degradation in quality of the natural environment. There have been various attempts to widen the scope of depreciation to reflect environmental degradation (or improvement if such is the case) but without much success. The hurdle is reliable measurement. In market-based accounting, market prices are used for valuation. Thus, a ton of coal extracted is valued by the market price for coal. But the main point of introducing environmental assets is to alert to the social costs of the consequences of a ton of coal extracted, and these are not normally reflected in market prices for coal. Taking into account resource depletion would, for instance, suggest a smaller role in NDP for sectors like coal mining and timber than in GDP, and in some instance, there has been lobbying against the development of more comprehensive accounts that would reflect resource depletion, and especially adverse environmental effects.
25. In a world of globalization, there may be large differences between income of the citizens of a country and measures of domestic production, and the former is clearly more relevant for measuring the well being of citizens. We shall argue later that the household sector is particularly relevant for our considerations and for households, the income perspective is much more appropriate than measures of production. Some of the income generated by residents is sent abroad, and some residents receive income from abroad. These flows are captured by net national disposable income, a standard variable in 12
countries’ national accounts. The figure below shows how Ireland’s income declines relative to its GDP – a reflection of an increasing share of profits that are re-patriated by foreign investors. While the profits are included in GDP, these profits do not enhance the spending power of the citizens of the country. For a poor developing country to be told that its GDP has gone up may be of little relevance. It wants to know if its citizens are better off and national income measures are more relevant to this question than GDP. Figure 1: Net national disposable income as percentage of gross domestic product
70.0 75.0 80.0 85.0 90.0 95.0 France USA Ireland
26. Moreover, prices of imports evolve very differently from the prices of a country’s exports, and these changes in relative prices have to be taken into account in assessing living standards. The figure below shows the divergence between income and production for Norway, an oil-rich OECD country whose income has risen faster than GDP in times of rising oil prices. In many developing countries, whose export prices fall relative to the prices of imports, the opposite will be true. These effects are captured by measures of real
net national disposable income, available from most countries’ national accounts but
much more rarely used in the public debate than GDP.
Figure 2: GDP and disposable income in Norway 70.0 90.0 110.0 130.0 150.0 170.0 190.0 210.0 230.0
Norway GDP at constant prices Norway real Net national disposable income
Source: OECD Annual National Accounts.
3.2. Improving the measurement of government-provided services
27. Governments play an important part in today’s economies. Broadly speaking, they provide two types of services – those of a ‘collective’ nature such as security and those of an ‘individual’ nature such as medical services or education. This does not imply that government is necessarily the only provider of these services and indeed, the mix between private and public provision of individual services varies significantly across countries. And while one can argue about the contributions of collective services to citizens’ living standards, individual services – education, medical services or public sports facilities – are almost certainly positively valued by citizens. These services tend to be important in size and at the same time badly measured. Traditionally, for government-provided non-market services, measures have been based on the inputs used to produce these services rather than on the actual outputs produced. An immediate consequence of this procedure is that multifactor productivity change for government-provided services is ignored because outputs are taken to move at the same rhythm as inputs. It follows that if there is faster productivity growth in the public sector than in the private, our measure under-estimates growth, and conversely if there is slower growth.
28. Work has started in many countries to develop output measures that are independent from inputs but the task is tremendous. Take the following example: the United States spend more per capita on health care, and yet in terms of standard health indicators, health outcomes are worse than in many European countries. Does this mean that Americans get less health care? Or does it mean their health care is more expensive and/or delivered less efficiently? Or does it mean that health outcomes also depend on factors specific to the American society other than health expenditures? We need to be able to break the change in health expenditures into a price and an output effect. But what exactly are the volumes of output that one is looking for? It is tempting to measure them by the state of the health of the population. The problem is that the link between expenditures on health care and health status is tenuous at best: expenditures relate to the resources that go into the institutions providing health and education services whereas the health status of the population is driven by many factors, all of which together form the health or education system. For example, people’s lifestyle will affect health outcomes or the time parents spend with their children will affect exam scores. Attributing changes in the health or education status only to hospitals and schools and the money spent on them neglects all these factors and can be misleading.
29. The quest is for more accurate measures of the volume growth of public services. A number of European countries as well as Australia and New Zealand have developed output-based measures for key government-provided services. A major challenge in these efforts is again capturing quality change. Without a good measure of quality (or equivalently, a good estimate of the increase in productivity) it is impossible to ascertain whether the conventional input measures under- or overestimate growth. If undifferentiated quantity measures such as a simple number of students or of patients are used, changes in the composition of output and in its quality may be missed. But one has 15
to start somewhere and the issue cannot be ignored because the numbers involved are important. For example, with output-based measures, the U.K. economy grew at the rate of 2.75% per year between 1995 and 2003, whereas if the previous convention had continued to be used, the growth rate would have been 3% (Atkinson 2005). Similar effects could be observed in the case of France. A Danish study on measurement of health output points the other way: output-based prices of hospital services grew less rapidly than input-based prices (Figure 3), indicating that real growth of medical services has been understated.
30. An important criterion for the reliability of output-based measures is that they are based on observations that are detailed enough to avoid obfuscation of the results because true volume changes are mixed up with compositional effects. We can ask: how many students are educated and simply count their numbers. If spending per student increases, one might conclude that the unit cost of education services has increased. This may, however, be misleading if costs have gone up because students are taught in smaller classes. Or if there is a larger share of students that take up more costly engineering studies. The measurement mistake is that the simple number of students is too undifferentiated an output measure to be meaningful. A more detailed structure is needed for measurement. This helps treating for instance one hour taught to a graduate engineering student as a different product from one hour taught to a first year student in arts. In so doing, we manage to account for some quality and compositional change. A similar reasoning applies for health care where the treatments of different diseases have to be considered as different medical services. As it turns out, health care policies in some countries have actually helped making available the administrative data needed to obtain this detailed information. We conclude that despite it being a daunting task, better
measurement of government-provided individual services is central to our assessment of
living standards. Exploitation of new administrative sources to deepen the level of information detail is one way of progressing in this direction.
Figure 3: Unit cost indices for general hospitals in Denmark
90.0 95.0 100.0 105.0 110.0 115.0 120.0 2000 2001 2002 2003 2004 2005 Input based Output based
Source: Deveci, Heurlén and Sørensen (2008). 3.3. Revisit the concept of ‘defensive’ expenditures
31. Expenditures required to maintain consumption levels or the functioning of society could be viewed as a sort of intermediate inputs – there is no direct benefit and in this sense they do not give rise to a final good or service. Many such ‘defensive expenditures’ are incurred by government, others are incurred by the private sector. By way of example, expenditure on prisons could be considered a government-incurred defensive expenditure, and costs of commuting to work serves as an example for typically privately-incurred defensive expenditures. A number of authors suggested treating these expenditures as intermediate rather than final products. Consequently, they would not be part of GDP. 32. Defensive expenditures not only concern government activity. Nordhaus and Tobin’s
(1973), for example, identify as ‘defensive’ those activities that "are evidently not directly sources of utility themselves but are regrettably necessary inputs to activities that may
yield utility". In particular, they adjust income downwards for expenditures that arise as a consequence of urbanization and a complex modern life.
33. At the same time, difficulties abound when it comes to identifying which expenditures are ‘defensive’ and which are not. What are possible ways forward? Options include:
- First, focus on household consumption rather than total final consumption. For many purposes, this can be a meaningful variable. And all of governments’ collective consumption expenditures (which would include things like prisons, military expenditure or the clean-up of oil spills), are automatically excluded from households' final consumption.
- Second, widen the asset boundary. In many cases, there are elements of investment, and capital goods, and in those cases, we can treat defensive expenditures much like maintenance expenditures in the case of conventional production. Expenditure on security could be taken as an investment in social capital, akin to health expenditures that can be seen as investment in human capital. If there is an asset that captures environmental quality, the consequences of economic activity that is detrimental to this asset could be captured in an extended measure of depreciation or depletion so that the net measure of income or production is reduced accordingly. And net measures, it was argued earlier, should be our benchmark for living standards rather than a gross measure.
- Third, widen the household production boundary. Some ‘defensive’ expenditures cannot reasonably be treated as an investment. Take the case of commuting to work. Households produce transportation services – they use their time (labour input) and money (commuter ticket) for this purpose. These transportation services are provided to employers for whom they constitute a free intermediate input. With 18
the exception of the consumer’s purchase of the ticket for a commuter train, none of the above flows enter measures of production and income. This could be remedied by allowing for household production of transportation services and simultaneously imputing a flow of intermediate inputs from household producers to firms. The additional imputed purchase would reduce firm’s measured profits by the amount of transportation services produced by households with offsetting effects on overall income. However, commuter train tickets would now figure as intermediate inputs into household production rather than as final household consumption and the value of GDP under this new treatment would be lower by exactly the defensive expenditure ‘commuter ticket’ than the value of GDP under present accounting practice.
34. The biggest obstacle to these approaches lies in their implementation. How exactly should the scope of defensive expenditures be determined? How should the new assets and in-kind flows be valued? And of course, widening the scope of asset and production measures brings with it more imputations.
3.4. Income and wealth come together
35. Income flows are an important gauge for the standard of living but in the end, it is wealth that determines how well off people are. The best indicator of the financial status of a firm is its balance sheet, and the same holds for the economy as a whole. To construct the balance sheet of an economy, we have to have comprehensive accounts of its assets (physical capital - and perhaps even human, natural and social capital) and its liabilities (what is owed to other countries.) To know what is happening to the economy, we need to ascertain changes in wealth. In some instances, it may be easier to account for changes in wealth than to estimate the total value of wealth. Changes in wealth entail gross
investments (in physical and human capital) minus depreciation and depletion (of physical, human, and natural capital.)
36. Although the information about some central aspects of household wealth is in principle available from national accounts balance sheets, information is often incomplete. Furthermore, certain assets are not recognized as such in the standard accounting framework. A particular important one is human capital. Those studies that computed human capital stocks found that they account for an overwhelming part (80% and more) of all wealth1. A systematic measurement of human capital stocks is of interest from a number of perspectives. It constitutes an integral part of an extended measure of household production (see below), and it is an input for the construction of sustainability indicators.
37. Note a fundamental problem with valuing stocks. When there are markets for assets, the prices at which assets are bought and sold serve to value the stock as a whole. There may be no markets or no trading on markets as has recently been the case for certain financial assets and the question arises how to value them. Even when there are market prices, they only correspond to the small fraction of the stock that is really transacted and they may be so volatile as to put a question mark on the interpretability of balance sheets. That said, basic information on assets and liabilities is key to assessing the economic health of sectors and to the financial risks to which they are exposed.
1
See, for example, Jorgenson and Fraumeni (1989).
4. Bringing out the household perspective
38. Income can be computed for the economy as a whole but also for private households. Some of the income of citizens is taken away in the form of taxes. This is money that is not at their disposal. But the government takes this money away for a reason: to provide public goods and services, to invest for example in infrastructure and to transfer income to other (normally more needy) individuals. Thus other households receive transfers from government, and all households receive benefits. A commonly employed measure adds and subtracts these transfer payments. The resulting measure is referred to as a measure of
disposable income for households. However, disposable income only captures monetary
transfers between households and the government, thereby neglecting the in-kind services that government provides.
4.1. Adjusting household income measures for government services in kind
39. Earlier in this text we mentioned the invariance principle according to which a movement of an activity from the public to the private sector, or vice versa, should not change our measure of performance, except to the extent that there is an effect in quality or access. This is where a purely market-based measure of income or economic performance meets its limits and where a measure that corrects for differences in institutional set-up may be warranted for comparisons over time or across countries. Adjusted disposable income is a national accounts measure that goes some way towards accommodating the invariance principle, at least where ‘social transfers in kind’ by government are concerned.
40. The meaning of adjusted disposable income is best explained by way of an example. Assume that labour income in society equals 100 and that individuals that are active in the 21
labour market buy private health insurance. They make an annual payment for the insurance equal to 10, which can be decomposed into 8 units of insurance premiums (an actuarial value of losses of 8) and 2 units of consumption of insurance services. At the same time, persons who are sick receive 8 units as a reimbursement of their health expenditures. This is Case A in the table below: no taxes are paid and insurance claims and premiums just offset each other so that disposable income for households equals 100. Now, assume that the government decides to provide the same amount of health insurance coverage to everyone, funded through a tax of 10 units. Nothing has changed, other than that the government is now collecting the insurance payment and distributing the benefits (Case B). But according to standard national accounts statistics, disposable income has fallen, to 90 currency units. Thus, disposable income yields a distorted comparison. If one adds in the social transfers in kind that households receive from the government under Case B (8 units corresponding to the reimbursement of health expenditures and 2 units corresponding to the running costs of the insurance), the adjusted measure of household disposable income indicates equality between the two cases.
41. The above example leaves, however, aside any consideration about which insurance regime operates more cost effectively and about profits that can be made by private insurance companies– it was simply assumed that private and public insurance services are equivalent to 2 currency units. In practice, this is almost certainly not the case although it is difficult to establish a general observation on relative efficiency of schemes. If the financial services industry is not perfectly competitive (a reasonable assumption in most countries), the transfer of responsibility from the private to the public sector will be reflected in decreased profits, decreased value-added and decreased income. But the profits are simply a transfer payment from households to firms. Society is not better off as a result of these profits.
Private insurance scheme (Case A) Public insurance scheme (Case B) Labour income 100 100 Tax 0 -10 Insurance premiums (excluding insurance services) -8 0 Insurance claims +8 0 Household disposable income 100 90 Social transfers in kind :
reimbursements running costs of the insurance 0 +10 +8 +2 Adjusted household disposable income 100 100
42. While the failure to estimate the value of security services provided causes one set of biases, there are other biases that arise from the fact that the value of some social transfers in kind (those corresponding to the running costs of the insurance in the example above) is measured by the costs of producing these services. In some countries, in particular in the developing world, the cost of these services may greatly exceed their value to households, who may receive little or nothing. The result is large scale overestimation of the level of household income and consumption. Some of this can be tackled by using output-based volume measures for health and education services produced by government. And it is likely that different parts of the population benefit differently from social transfers in kind provided by government. This is an important distributional aspect.
43. Major items in social transfers in kind are health and education services, subsidized housing, sport and recreation facilities and the like that are provided to citizens at a low price or for free. In France, general government provides nearly all of these services at a cost of about € 290 billion in 2007. Education and health services each account for about
1/3 of total transfers in kind, and housing and recreational and cultural activities (museums, public parks…) account for about 10% as indicated in Figure 4.
Figure 4 Social transfers in kind from general government, France 2007
Education 30% Health services 34% Pharmaceuticals 9% Social work 9% Recreational facilities and activities 6% Real estate 4% Other 8% Source: INSEE.
4.2. Medians and means - distribution of market income
44. Average measures of income per person are helpful but give no indication about how available resources are distributed across persons or households. For example, average income per capita can remain unchanged while the distribution of income becomes less equal. It is therefore necessary to look at disposable income information for different income groups. A conceptually simple way of capturing distribution aspects is to measure median income, the income such that half of all individuals are above that income, half below. The median individual is, in some sense, the “typical” individual. With increasing inequality, there may be increasing differences between median and average income; a focus on average income does not give an accurate picture of the economic well-being of the ‘typical’ member of society. If all the increases in societal income accrue, say, to those in the top 10%, median income may remain unchanged, while average income increases.
Over the past two decades, the dominant pattern in OECD countries is one of a fairly widespread increase in inequality, with strong rises in Finland, Norway, Sweden (from a low base) and Germany, Italy, New Zealand, and the United States (from a high base). In these cases, the two numbers would give different pictures of what is happening to societal well-being. Alternatively, the development of disposable income of different income groups can be followed. Such an approach would, for instance, look at the numbers below a critical poverty level, the average income of those in the bottom or top decile.
45. In practice, moving from average to median income is more difficult than meets the eye. Measures of average income are obtained by dividing total income by a population figure. To consider distributional elements, micro-economic information is needed that provides income information for individual households or groups of households. Micro-economic measures of household income refer to people living in private households and are typically derived from household income surveys whereas macro-economic measures are provided by the national accounts.
46. An important choice lies also with the unit of measurement. Macro-estimates give totals for a whole country or sector, while micro data retain the household (or the family) as unit within which resources are pooled and shared, and adjust income for differences in “needs.” There are, for instance, fixed costs to running a household, allowing larger families with the same per capita income to have a higher standard of living. Another step towards bringing demography and some distributional aspects into income measures is to calculate disposable income per consumption unit or per household rather than per person. Consumption units are households with an adjustment for their size so that account is taken of the economies of scale in housing and other costs. This adjustment is of increasing importance as the size of households changes.
47. Against this background, we can consider the evolution of average and median household income in several countries. Figure 5 and Figure 6 show results for France and for the United States. Average income per capita and average income per consumption unit diverge, reflecting a trend towards smaller household size. Survey income measures permit comparing average and median income. In the case of France, these two items move in parallel. At least from this perspective, there is thus no indication of a widening income distribution. The picture is different for the United States where average income per capita and per consumption unit grow at the same rate but where there is widening gap between median and average income, pointing to a more unequal income distribution.
Figure 5: Trends in different measures of household disposable income
France 0.90 1.00 1.10 1.20 1.30 1.40 1.50 1984 1986 1988 1990 1992 1994 1996 1998 2000 2002 2004
Average per capita income, SNA Average per consumption unit, SNA Average per consumption unit, survey Median per consumption unit, survey
Source: Computations based on OECD SNA and income distribution data.
Figure 6: Trends in different measures of household disposable income United States 0.90 1.00 1.10 1.20 1.30 1.40 1.50 1984 1986 1988 1990 1992 1994 1996 1998 2000 2002 2004
Average per capita income, SNA Average per consumption unit, SNA Average per consumption unit, survey Median per consumption unit, survey
Source: Computations based on OECD SNA and income distribution data.
48. There are many measurement issues that can influence the above statements. An important source of discrepancy between micro and macro estimates is property income, whether imputed or not. If this aggregate is not well measured in micro estimates, this could explain why average and median incomes in these estimates have a parallel evolution in France where wage inequalities are less important than property income inequalities. In addition, there is a possibility that top incomes are under-represented in household income surveys. Finally, the international comparability between household surveys is far from perfect.
49. From a perspective of living standards what matters is that the distribution of income and wealth determines who enjoys access to the goods and services produced within a society. Complementing measures of average income by income measures with a distributional element is thus a crucial task for official statistics. Ideally, such
distributional measures are compatible in scope with average measures from the national accounts.
50. Income distribution should not only be judged by the distribution of nominal income. The same dollar may buy different bundles of product, depending on the income group of the purchaser. Going from nominal to real income means applying a price index and a point of relevance is therefore ‘whose price index can we measure?' Often, conceptual discussions about price indices are conducted as if there were a single representative consumer. Statistical agencies calculate the increase in prices by looking at what it costs to purchase an average bundle of goods. The problem is that different people buy different bundles of goods. Poor people spend more on food; rich on entertainment. They also buy goods and services in different types of stores, which sell “similar” products at very different prices. When all prices move together, having different indices for different people may not make much a difference. But recently, with soaring oil and food prices, these differences have become marked. Those at the bottom may have seen real incomes be more affected than those at the top.
51. A price index for (actual) private consumption for major groups in society (age,
income, rural/urban) is necessary if we are to appraise their economic situation. One of the recommendations of the Commission sur la mesure du pouvoir d’achat des ménages (2008) (Commission on the measurement of purchasing power of households) in France was to develop consumer price indices for owners of dwellings, for households who rent dwellings and for households that are about to purchase dwellings. A full development of price indices differentiated by socio-economic groups requires, however, that different prices have to be collected for different parts of the population, so that socio-economic aspects are taken into account in data collection design. This is likely to turn out difficult and costly. Its development should constitute a medium-term research objective – a
recommendation that echos a similar conclusion by the 2002 Panel on Conceptual, Measurement, and other Statistical Issues in Developing Cost-of-Living Indexes in the United States. Such work would not only foster the quality of deflation procedures, it would also make it easier for citizens to identify their personal situation with some of the income and price data released by statistical offices.
4.3. Broader measures of households’ economic activity
52. There have been changes in the functioning of households and the society. For example, in the past, more people received services from their family that are now provided purchased on the market. This shift translates into a rise of income as measured in the national account and gives a false impression of a change in living standards, while it only reflects a shift from non-market to market provision of services. Just as we argued that a basic principle in national accounts measurement was that a shift from private to public provision of a particular good or service or vice versa should not affect measured output, so too, a shift of production from market to household production, or vice versa, should not affect measured output. We noticed earlier that in practice, current conventions do lead to changes in measured income in both instances.
53. Imagine a two-parent household with two children with an income of $50,000 a year, in which only one parent works full-time for pay and the other specializes in home production. The parent who stays at home does all shopping, cooks all meals, does all cleaning, and does all child care. As a result, this household does not need to devote any of its market income to such purchases. Now, imagine a two-parent household with two children in which both parents work full-time for pay, and neither parent has any time left over for household production or child care. They must pay for shopping, cooking, cleaning and child care out of pocket. Their available income is reduced. Standard 29
measures of family living standards treat these households as if they have identical living standards but obviously they don’t. Focusing on market production only provides a biased picture of living standards – some of the measured increase in market production may simply reflect a shift of the locus of production from households to the market.
54. To get a sense for the economic importance of home production, one has to start by examining how persons use their time. Figure 7 provides a first comparison of time spent per household and day on various activities. Household production comprises time spent on housework, purchasing goods and services, caring for and helping household and non-household members, volunteer activities, telephone calls, mails and email and travel time related to all these activities. ‘Personal care’ is mainly sleeping, eating and drinking, whereas leisure was defined to include, sports, religious and spiritual activities and other leisure activities.
55. Against those caveats, one finds that more time is spent on household production in European countries as opposed to the United States. More time is spent on leisure in Finland, France, Italy, Germany and the United Kingdom than in the United States (Figure 7). Note that some of the classifications are ambiguous and results should therefore be read with care. For example, eating and drinking are included in the definition of personal care whereas arguably, part of eating and drinking is time spent on leisure. Many view cooking — and then eating - a good meal as a most enjoyable leisure activity, not a chore that is easily substitutable with a meal in a fast food restaurant. And the time use picture can change if eating time is allocated differently. We conclude that the allocation of specific activities to time use categories as well as their international comparison leaves room for improvement and harmonisation.
Figure 7: Housework, paid work and leisure Minutes per day and person, latest year available*
*using normalised series for personal care; Unites States: 2005, Finland 1998, France 1999, Germany 2002, Italy 2003, United Kingdom 2001.
Source: OECD (2009), based on HETUS and ATUS databases.
56. A major gap in time use data is availability of consistent time series. Time use surveys have been conducted in the past but, in most cases, not periodically, and often comparability between surveys is limited. The assessment of time use over longer periods has to take recourse to approximations and estimates of varying quality. This also holds for the present study. An important task for the future will be to build up nationally and internationally comparable time series of information on how people use time. Such work is under way in the United States and in several European countries but lacking in many other parts of the world.
57. It is now possible to come up with an illustrative calculation for the value of household production for France, Finland and for the United States. The approach chosen here is simple: the value of the production of household services is measured by its costs. The value of labor is estimated by applying a wage rate of a generalist household worker to the number of hours that persons spend on housework. Methodology matters in this 31
context and results can differ markedly, depending in particular on the hypotheses chosen for the valuation of labor and capital. We are also lacking estimates for productivity change in household production.
58. However, our estimates provide orders of magnitude. It is apparent, and no surprise in light of previous studies that imputations for own-account production of household services are a sizeable matter. Our calculations show that household production amounts to about 35% of conventionally-measured GDP in France (average 1995-2006) and to about 40% in Finland and 30% in the United States over the same period.
59. Once one starts thinking about non-market income, one has to think about leisure. With time spent on generating income (market or non-market) we buy or produce goods and services to meet our needs or for simple enjoyment. Time available for leisure obviously affects well-being. Changes in the amount of leisure over time and differences between countries represent one of the more important aspects of changes in well-being over time and differences across countries. Focusing only on goods and services can therefore bias comparative measures of living standards towards the production of goods and services. This is of particular concern as the world begins to come to terms with environmental constraints. It will not be possible to increase the production especially of goods beyond limit. Taxes and regulations will be imposed that will discourage the production of goods. It would be a mistake if, as a result, leisure time increases, that we judge living standards to have decreased. As society progresses, it is not unreasonable to expect people to enjoy some of the fruits of that progress to be taken in the form of leisure. Different societies may respond, however, differently, and we do not want to bias our judgments (e.g. of success) against societies that choose to enjoy leisure.
60. Measurement of the value of leisure starts again from time use data. We multiply the average leisure time per day by the working age population and by the average wage rate in the economy. Again, there are many measurement issues associated with this procedure but the purpose here is to show that estimates are feasible and can produce meaningful results, including for cross-country comparisons. For the three countries at hand, the value of leisure about doubles net disposable income of households in nominal terms. More interesting than nominal income levels is the question how considering leisure affects the measured growth rates of real income and their comparisons across countries. This is captured in Table 2. It shows the evolution of household income, now adjusted for household work (upper panel) and for household work and leisure (lower panel). For all countries, the new real income measures grow more slowly than the traditional measures of income. When expressed as income per consumption unit (i.e,, per household, adjusted for household size), income growth rates between the three countries turn out to be very similar.
Table 2: Household income in real terms Percentage change at annual rate, 1995-2006
France
United
States Finland
Total 1.9% 2.9% 2.0%
Per consumption unit 1.1% 1.7% 1.6%
Total 1.4% 2.3% 1.4%
Per consumption unit 0.7% 1.0% 0.9%
Adjusted disposable income plus housework
Adjusted disposable income plus housework and leisure
61. The imprecision associated with the above estimates is reiterated here. These are orders of magnitude at best and should not be over-interpreted. However, it is clear that recognition of broader measures of economic activity and recognition of leisure do make a 33
difference to comparisons over time and between countries. More work needs to be done to test methodologies, to single out the most critical parameters and to test robustness of such measures. Only if there is sufficient confidence in extended measures of income, will there be a broader take-up by statistical offices.
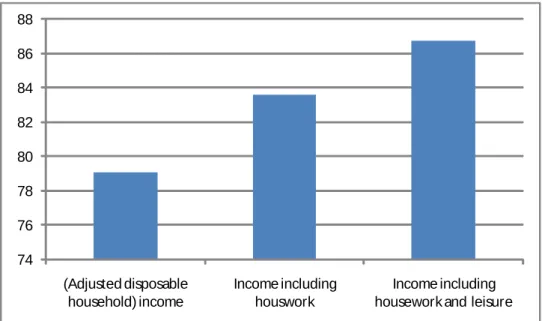
62. Even more instructive than estimating the rate of change in real income is to assess how household production and leisure bear on the comparison of income levels across countries. Income levels should be compared in real terms and we construct currency converters, so called Purchasing Power Parities (PPP) that permit comparisons of real ‘full’ income (including housework and leisure) across countries. Figure 8 compares three income aggregates between France and the United States. The first comparison is with the established adjusted disposable income measure. Here, France’s per capita income is just below 80% of the comparable United States figure. Adding in the income equivalent of unpaid housework narrows the gap to 84%. If in addition, leisure is accounted for, one ends up with a relative income level of 87%.
Figure 8: Real income per capita in France compared to the United States, 2005 Unites States = 100 74 76 78 80 82 84 86 88 (Adjusted disposable household) income Income including houswork Income including housework and leisure
4.4. Distribution of full income
63. It was argued earlier that measures of average income should be accompanied by income measures with distributional information such as median disposable income, the income such that half of all individuals are above that income, half below. The rationale for examining income distribution holds for market income but also for broader measures of income such as full income. The recognition of own-account production of household services and leisure may not only affect aggregate measures of income and production. It also changes the established picture of income distributions, as confirmed by the literature on this topic.
64. Developing distributional measures of full income is, however, a formidable task. The single most difficult item is to allocate to income groups those income flows that have been imputed at the macro level when comprehensive measures of income were derived. For example, imputed rents from own-occupied housing constitute such an item. Other imputations for own-account services produced by households also fall under this category. And so do the distributional effects of government services that are provided in kind.
65. Again, measurement difficulties should not prevent us from pursuing the objective of getting a more comprehensive picture of the distribution of income and wealth.
C
HAPTER2 – Q
UALITY OFL
IFE1. Introduction
66. Quality of life is a broader concept than economic production and living standards. It includes the full range of factors that makes life worth living, reaching beyond its material side. While some extensions of economic accounting allow including some of the elements that shape quality of life in conventional measures of economic well-being, all approaches based on resources (or on people’s command over commodities) remain limited in important ways. First, many resources are not marketed: even when they are, prices will differ across individuals, making it problematic to compare real income across people. Second, many of the determinants of human well-being are not resources but aspects of people’s life-circumstances: they cannot be described as resources with imputable prices, even if people do make trade-offs among them. Lastly, resources are means that are transformed into well-being in ways that differ across people: those individuals with greater capacities for enjoyment or greater abilities for achievement in valuable domains of life may be better off even if they command fewer economic resources. These arguments, by themselves, suggest that resources are an inadequate metric for quality of life. Which other metric should be used for assessing quality of life depends on the philosophical perspective taken.
67. While a long tradition of philosophical thought has addressed the issues of what gives life its quality, recent advances in research have led to new and credible measures. These measures, while not replacing conventional economic indicators, provide the opportunity to enrich policy discussions and to inform people’s view of the conditions of the community where they live. More importantly, they have now the potential to move from research to standard statistical practice. While some of these measures reflect
structural conditions that are relatively invariant over time but that differ systematically across countries, others are more responsive to policies and suitable for monitoring changes over short-periods of time. Both types of indicators play important roles in measuring quality of life.
2. Conceptual approaches to measuring quality of life
68. Three conceptual approaches have retained the attention of the Commission as useful in thinking about the measurement of quality of life.
69. The first approach, developed in close connection with psychological research, is based on the notion of subjective well-being. A long philosophical tradition views individuals as the best judges of their own conditions. This approach is closely linked to the utilitarian tradition but has a broader appeal due to the strong presumption, in many streams of ancient and modern culture, that enabling people to be ‘happy’ and ‘satisfied’ with their life are universal goals of human existence. Research on subjective well-being holds the promise of delivering not just a good measure of the level of quality of life but also an understanding of its determinants.
70. The second approach is rooted in the notion of capabilities. This approach conceives a person’s life as a combination of various ‘doings and beings’ (functionings) and of his or her freedom to choose among these functionings (capabilities). Some of these capabilities may be quite elementary, such as being adequately nourished and escaping premature mortality, while others may be more complex, such as having the literacy required to actively participate in political life. The capability approach, which has strong roots in philosophical notions of social justice, rests on a number of foundations, These include a
focus on human ends and on respecting people’s ability to pursue and realise goals that he or she values; a rejection of the economic model of individuals acting to maximise their self-interest devoid of relationships and emotions; an emphasis on the complementarities between various capabilities; and a recognition of people’s diversity, which brings attention to the role played by ethical principles in the design of the ‘good’ society.
71. The third approach, developed within the economics tradition, is based on the notion of fair allocations. The basic idea, which is common to welfare economics, is that of weighting the various non-monetary dimensions of quality of life (beyond the goods and services that are traded in markets) in a way that respects people’s preferences. This approach requires choosing a particular reference point for each of the various non-monetary dimensions, as well as information on people’s current situations and on their preferences with respect to these points. This approach avoids the pitfalls of basing evaluations on an ‘average’ willingness-to-pay that may disproportionally reflect the preferences of those who are better-off in society by focusing on equality among all of its members.
72. These approaches have obvious differences, but also similarities. For example, subjective well-being is sometimes claimed to encompass all capabilities, to the extent that these are attributes and freedoms that people value (implying that their achievements will improve people’s subjective states). However, proponents of the capability approach also emphasise that subjective states are not all that matter, and that expanding people’s opportunities is important in itself, even if this does not show up in higher subjective well-being. Similarly, both the capability and the fair allocation approaches rely on information on the objective attributes of each person, while differing in the ways in which these are weighted and aggregated. While the choice between these approaches is ultimately a normative decision, all these approaches point to the importance of a number of features
for quality of life that go beyond command over resources. Measuring these features requires the use of types of data (i.e. responses to questionnaires and non-market observations of personal states) that are not captured by market transactions.
3. Subjective measures of quality of life
73. For a long time, economists have assumed that it was sufficient to look at people choices to derive information about their well-being, and that these choices would conform to a standard set of assumptions. In recent years, however, much research has focused on what people value and how they act in real life; this research has highlighted large discrepancies between standard assumptions of economic theory and real world phenomena. A significant part of this research has been undertaken by psychologists and economists based on subjective data on people’s reported or experienced well-being. 74. Subjective measures have always been part of the traditional tool-kit of economists
and statisticians, as many features of our economies and societies (e.g. unemployment) are measured through people’s responses to a standard set of questions. The specific feature of the subjective measures of quality of life discussed here is that what people report about their own conditions has no obvious objective counterpart: we can compare ‘perceived’ and ‘actual’ inflation, for example, but only respondents can provide information on their own subjective states and values. Despite this feature, a rich literature on these subjective measures concludes that they help predict people’s behaviour (e.g. workers who report more dissatisfaction in their work are more likely to quit), and that they have validity with respect to a range of other information (e.g. people who report themselves as ‘happy’ tend to smile more and to be rated as happy by people around them; these self-reports are also correlated with electrical readings of the brain).
75. Subjective approaches distinguish between the dimensions of quality of life (i.e. people’s subjective experiences and their evaluations) and the objective factors shaping them. In turn, subjective dimensions of quality of life encompass several aspects. The first is represented by people’s evaluations, either of their life as a whole or of its various domains, such as family, work and financial conditions. These evaluations imply a cognitive exercise from each person, and an effort to take stock and summarise the full range of elements that people value (e.g. their sense of purpose, the fulfilment of their goals and the regards of others on one-self). The second aspect is represented by people’s actual feelings, such as pain, worry and anger, or pleasure, pride and respect. To the extent that these feelings are reported in real time, they are less affected by biases due to memory and by social pressures related to what is deemed to be ‘good’ in society. Within this broad category of people’s feelings, the research on subjective well-being distinguishes between positive and negative affects, as both may characterise the experience of each person.
76. All these aspects of subjective well-being (cognitive evaluations, positive affects and negative affects) should be measured separately to get a satisfactory appreciation of people’s life. Which of these aspects matter more, and for what purpose, is still an open question. Much evidence suggests that people act to achieve satisfaction in their choices, and that choices are based on memories and evaluations. But memories and evaluations can also lead to systematic errors while some choices are made unconsciously rather than weighting the pros and cons of various alternatives.
77. Subjective measures of people’s life-evaluations and affects provide measures of quality of life that can be monitored over time; some of these measures can also be compared across countries in reliable ways. Probably more importantly, however, is that these measures inform about the determinants of quality of life at the level of each person. 40