A n n e x I
R e g i o n a l n e t wo rk
60
Norges Bank’s regional network was established in autumn 2002 and consists of enterprises, organisa-tions and local authorities throughout Norway. Five times a year, we interview to business and com-munity leaders concerning financial developments in their enterprises and industries. Each round of interviews comprises about 290 visits. The contacts reflect the production side of the economy, both in terms of industry sector and geographic area. The network comprises approximately 1500 individuals who are interviewed once or twice a year.
The primary purpose of the regional network is to obtain up-to-date information on the state of the Norwegian economy. Regular communication with local contacts in Norway’s business and communi-ty life provide us with information earlier and more frequently than available government statistics. It also provides us with supplementary information about areas not covered by other statistical sources, and we learn which issues are of particular concern
to enterprises. In addition, the regional network will provide us with insight into the effects of spe-cific events and enable us to study relevant issues. Official statistics will continue to form the basis for our perception of the state of the economy, but given the time lags and revisions associated with these statistics other sources, such as our regional network provide a useful supplement.
The information obtained from the regional net-work, along with other available information on economic developments, will form a basis for Norges Bank’s projections as presented in the Inflation Report and other published material. We have divided Norway into seven regions, and for six regions we have engaged regional research institutions to be responsible for the network in their respective regions and to have meetings with contacts on behalf of Norges Bank. The following institutions have been selected:
N o rg e s B a n k ` s re g i o n a l n e t wo rk
Region North (Nordland, Troms, Finnmark) Kunnskapsparken Bodø
Region Central Norway (Nord-og Sør-Trøndelag)
Centre for Economic Research at the Norwegian University of Science and Technology Region Northwest (Møre og Romsdal, Sogn and Fjordane) Møreforsking in Molde
Region South-West(Rogaland og Hordaland) Rogalandsforskning
Region South (Aust- og Vest-Agder, Telemark, Vestfold) Agderforskning
Region Inland (Hedmark og Oppland) Østlandsforskning
Region East (Buskerud, Akershus, Oslo, Østfold) Covered by Norges Bank
6161
S u m m a ry o f t h e c o n t a c t ro u n d s s i n c e t h e
l a s t
I n fl a t i o n R e p o r t
In the contact rounds since Inflation Report 2/04, approximately 300 regional network contacts have been interviewed. The interviews were conducted in August and September. A national summary and summaries for each region will be available on Norges Bank’s website on 3 November. The sum-mary below is based on regional reports from the institutions responsible for the various regions and does not necessarily reflect Norges Bank’s view of economic developments.
Demand, output and market outlook
The general impression from the companies in the regional network is that the cyclical upturn in the Norwegian economy is continuing. All industries report increasing demand (see Chart 1). Domestic manufacturing supplying goods to the household sector and the construction industry report solid developments. The concrete industry, for example, reports strong growth, particularly for concrete ele-ments. The publishing and graphics industries also report solid growth, driven by strong growth in the newspaper sector due to job and branding advertise-ments. The engineering industry in Region North, on the other hand, is marked by somewhat reduced activity due to lower orders from the fishing fleet and a high debt-to-equity ratio.
In the export industry, there is growth in the tech-nology industry and in the fishing and fish farm-ing industry, and there is increased activity in the shipbuilding industry. In the process industry, including the smelting industry, developments are somewhat weaker due to high energy prices, which
rose markedly after the introduction of CO2 emis-sions quotas in Europe. The build-up of production capacity in China is also intensifying competition. On the whole, growth in the export industry is moderate and somewhat weaker than during the last round. For some companies, the decline in exports is due to stronger Norwegian demand combined with higher prices in the domestic market than in the export market. Suppliers to the petroleum industry report strong growth as a result of persist-ently high oil prices and record-high investment. In Norway, this is primarily due to the Snøhvit and Ormen Lange field developments. Internationally, increased exploration activity and various measures to increase production are contributing to growth. A result of the persistently high oil price is that drill-ing capacity worldwide is underdimensioned and a number of commercial fields are queuing up due to a shortage of drilling rigs and service vessels. The construction industry continues to experience substantial growth, but in some regions, growth has slowed. The activity level remains high in resi-dential construction, but growth is more subdued. Growth in the market for private commercial build-ings is moderate with low growth in the market for office buildings. On the other hand, growth in the market for public commercial buildings is stronger and is driven by extensive rehabilitation projects in the public sector and particularly in the school sec-tor. Large road investments, power development projects, major development projects in Oslo and the Snøhvit and Ormen Lange field developments are all contributing to solid growth in the construc-tion sector.
Growth in retail trade continues and is particularly strong for building materials. This is particularly the case for home and garden products, such as hardware items, interior and paint products. There is solid growth for clothing, footwear and electrical appliances, but developments in car sales have lev-elled off. Private car sales are lower, partly because of high sales last year and a saturated used car mar-ket, but increased sales of vans and trucks for the business sector are compensating for this.
Service industries report solid growth, particularly for commercial services such as temporary employ-ment agencies and the advertising and consulting sectors. Growth in household services is also solid,
Chart 1Norges Bank’s regional network: demand and production. Index1). Oct 02 – Sep 05
-5 -3 -1 1 3 5 2002 2003 2004 2005 -5 -3 -1 1 3 5
Suppliers to the petroleum industry
Export industry
All industries Construction
1)The scale runs from -5 to +5, where -5 indicates a large fall and
+5 indicates strong growth. See article "Norges Bank's regional network" in Economic Bulletin 3/05 for further information.
62
although the growth rate is slower than for corpo-rate services. The difference is reflected particularly in activities that are oriented to both households and the business sector, including hotels, restaurants and banks.
The market outlook for the next six months indi-cates that growth in the Norwegian economy will continue, and will be at least as strong as the cur-rent level. Suppliers to the petroleum industry are even more optimistic than earlier about the future. It appears, however, that the peak has been reached in the construction sector. Growth in residential construction is expected to slow. In retail trade and service industries, growth is expected to be the same as in the last round.
Capacity utilisation and investment
45% of all companies report that they would have some or considerable difficulties accommodating increase in demand. This is a somewhat higher share than earlier this year. There are capacity prob-lems in parts of petroleum-related operations and in construction, particularly in Western Norway. The shortage of skilled labour and project managers appears to be the most important constraint.
All industries report moderate to solid growth in investment plans for the next 6-12 months (see Chart 2). 42% of the companies plan to increase investment, while 20 per cent expect to reduce investment. The strongest growth is expected in manufacturing and retail trade. Manufacturing plans to increase investment compared with spring and will invest in capacity, efficiency and product devel-opment. Retail trade is upgrading and expanding premises and building stock. In the service sector, a number of companies in the transport industry are expanding capacity.
Employment and labour market
Employment is increasing in the entire private sec-tor, in pace with the economic upturn. Employment growth in construction and retail trade is somewhat stronger than this past spring, whereas growth has been virtually stable in manufacturing and the serv-ice sector. There is no growth in employment in the municipal and hospital sector. It appears that the positive developments in the private sector will con-tinue during the next three months. Manufacturing employment is expected to rise, but the growth rate is expected to slow somewhat in the rest of the private sector. The construction sector indicates that they are not seeking to increase capacity sub-stantially and that they expect growth to be more subdued in the period ahead. Employment in the municipal and hospital sector is stable.
With the exception of construction and petroleum-related manufacturing, the network contacts do not appear to be experiencing any particular labour shortages. This is reflected in reports of low wage pressures in all industries, including construc-tion. On average, our contacts expect annual wage growth of 3.5% in 2005. Low wage growth in the construction industry is often explained by the large share of foreign labour.
Costs, prices and profitability
Increasing resource shortages have led to a sharper rise in prices in construction and petroleum-related industries. The export industry has also experienced a marked increase in prices in the last 12 months, primarily due to rising commodity prices. The ship-building industry also reports solid developments in export markets. The rise in prices has been moder-ate in the other industries. In the period ahead, there are as many companies that expect a higher rise in prices as those that expect a lower rise in prices, and price expectations appear to have moderated somewhat compared with earlier in the year. The export industry expects a decline in prices in the period ahead, partly as a result of a levelling off of commodity prices and partly due to competition from eastern Europe and Asia.
Increased demand, a rise in selling prices and generally low wage pressures are contributing to improving profitability in all industries again in this round. Profitability has increased sharply in the last few months for suppliers to the petroleum industry.
Chart 2Norges Banks regional network: investment plans. Change in investment in next 6 – 12 months. Index1). Oct 02 – Sep 05
-5 -3 -1 1 3 5 2002 2003 2004 2005 -5 -3 -1 1 3 5 Retail trade Municipal and hospital sector Services Manufacturing
1)The scale runs from -5 to +5, where -5 indicates a large fall and
+5 indicates strong growth. See article "Norges Bank's regional network" in Economic Bulletin 3/05 for further information.
63 63
E n t e rp ri s e s a n d o rg a n i s a t i o n s t h a t h ave b e e n c o n t a c
-t e d i n -t h e wo rk o n -t h i s
I n fl a t i o n R e p o r t
Abeo AS Adecco Norge AS Adecco region Øst Advokatfirma SchjødtAdvanced Production and Loading AS Aetat Molde Aetat Sør-Trøndelag AF Gruppen ASA Ahead Frisør Ahlshell Air Products AS Aker Aukra AS Aker Kværner Alphatron AS Alsvåg Plater AS Ankenes Sparebank Arendal Auto AS AS Nesseplast Asplan Viak AS Atlantic Auto AS B&T Låsservice AS Bademiljø Bakers AS Bakke El-installasjon AS Ballangen Camping AS Bautas AS BecoTek Bedriftskompetanse AS Berendsen Tekstil Service AS Berg & Co
Berg-Hansen, Region Vest Bergen kommune Bergens Tidende Berg-Hansen Reisebureau Big Horn Steak House Norge AS Bilhuset AS Bilia personbil Bjølseth Caravan AS Bjørn Ovik AS Bohus Interiør AS Boliden AS Borregaard Bravida Sørøst AS Buer Entreprenør AS Busengdal Transport as Buskerud Sentralsykehus Bussen Trafikkselskap AS Byggkjøp Farsund Bygg Byggmaker Norgros Cap Gemini Norge AS Choice Hotels AS City Syd AS Comrod AS Connex Vest AS Conoco Phillips Norway Constructor Norge AS Coop Lofoten BA Coop NKL BA Coop Sunndalsøra BA CTM Utvikling AS Damm
Den Norske Bank ASA, Tønsberg DNB NOR Eiendom Dyno nobel EFD Induction AS Eiendomsmegler 1 Elektro AS Elektro Hvitevarer AS Elektrotema Agder AS Elkem ASA Materials Elsafe International Ewos AS
Expert ASA
Lyng Elektronikk AS Maihaugen
Malermester Harald Askautrud AS Martin Olsen Mascot Electronics Melby Snekkerverksted AS Mesta AS Mester Grønn AS Miljøbygg AS Moelven Nordia Molab AS Moss kommune
Møre og Romsdal Kornsilo ANS Narvik Kommune Narvik Rørleggerforretning AS Narvikmegler’n AS NCC Construction Nergård AS NINA NOR Tekstilservice Norac AS Norcem
Nordea Bank Norge ASA Nordic Sales AS
Nordic Semiconductor ASA Norisol Norge AS Norsvin
Notar Eiendom Vestfold AS Notar Eiendom Ålesund AS Nylander Næringsmegling NYMO AS Nyvågar Drift AS Obos Oddstøl Elektronikk AS Officelink AS
Olav Thon Eiendomdsselskap Oljedirektoratet
Optimera Vest Oracle Oras armatur AS
Orkideekspressen Østerdal Reisebyrå AS
Orkla Media AS
Os Husdyrmerkefabrikk AS OVDS ASA
Owens Corning Fiberglas Norway AS Pallin AS
Plantasjen Norge AS Polimoon AS Powel ASA
PricewaterhouseCoopers DA Prior Norge BA Kjøttdivisjonen Proffice AS
Prognosesenteret AS Prosafe
Protan AS QS Manager AS Quality Hafjell Hotell AS Quality Hotel Sogndal Rapp Bomek AS Remvik & Standal Remøy Shipping AS Rica Arctic Hotell Rica Park Hotel Riibe Mynthandel Ringerike kommune Ringnes AS Ringsaker kommune Rissa kommune Rolfsen Rosenborg Malerforretning AS Rostein AS Rygge-Vaaler Sparebank Sandefjord kommune Fame fotografene AS Finny Sirevaag AS Fjordline - Bergen Fokus Bank Bedriftsmarked Forestia AS
Fosen Mekaniske Verksteder AS Fosnavaag Seafood AS Franzefoss kalk As Fundia Arneringsstål AS Furnes Hamjern Holding AS Gaupen Henger AS Gausdal Landhandleri AS Gilde Bøndernes Salgslag BA Gilde Vest BA
Gjensidige NOR forsikring Gjestal Spinneri ASA Gravdahl AS Gresvig ASA Grieg Seafood AS Grytnes Betong AS Hedalm Anebyhus AS Hedmark Fylkeskommune Helgeland Plast AS Helse Bergen HF Helse Nord RHF Herlige Stavanger AS HSH Hunderfossen Familiepark AS Hunton Fiber AS Hydro Aluminium AS
Hydro Aluminium Structures Raufoss AS Høllalaks as Hålogalandsykehuset Narvik IBM Norge ICA Distribusjon AS IKEA Åsane Industriverktøy AS Innovasjon Norge ISS Norge AS Itab Industrier AS Ivar Mjåland, Mandal JcDecaux
Jørstad AS Kanstad Trelast AS Kappahl
Karmsund Maritime Service AS KENO reklame AS Klæbu kommune Klaastad Brudd DA Kongsberg Gruppen AS Kongssenteret KPMG Trondheim Kraft Foods Avd. Disenå Kristiansand Cementstøperi AS Kristiansand Kommune Kristiansand Næringsforening Krogsveen AS Kroken Caravan AS Kruse Smith Kuben kjøpesenter Landskapsentreprenørene AS Leksvik kommune
Lians Caravan & Fritid Lindesnes kommune Lindorff Linjegods AS Litra AS LKAB Lofotprodukt AS Loreal Norge AS
LPO Arkitektur & Design AS Lund kommune
Lycro AS
SAS Ground Services Savalen Fjellhotell AS Schlumberger
Securitas - Regionkontor Bergen Servi Cylinderservice AS Sigerfjord Aqua AS Sikkerehetssenteret Aukra SinkaBerg-Hansen AS Sivesind KI AS Skagen Fondene Skagen Opplevelser AS Skanem Skanska AS Skedsmo kommune Slatlem & Co AS
Sogn og Fjordane Energi as Sparebank 1 Oslo AS Sparebank Sør Sparebanken Hedmark Sparebanken Volda Ørsta Sports Club Stavanger AS SR Bank
St. Olavs Hospital
Statens Vegvesen Region Sør Stella Polaris AS Stordal kommune Stordal Møbler AS Subsea7 AS Sult AS Sunnmørsposten AS Surnadal Transport AS SWIX Sport AS Sykehuset Telemark HF Sylteosen Betongvarefabrikk AS Sørensen Maskin AS
Sørhøy Distribusjon AS* Sør-Trøndelag fylkeskommune Tag Systems AS
Technor ASA Teknisk Bureau AS Telenor Mobile
Thommessen Krefting Greve Lund AS Ticket Tine BA TNT Norge Toyota Hell-Bil AS Trehuseksperten AS Trondheim Torg TV 2 Gruppen AS TV Nordvest AS Tyrholm & Farstad AS Tønsberg kommune Ullevål sykehus Union Hotel Valldal Høvleri AS
Veidekke Entreprenør AS Indre Østland
Vestbase AS Vestre Toten kommune Vetco Aibel VIA Ferieverden Vikomar AS Volmax AS Vågan Kommune West Contractors AS Wist Last og Buss YIT Building Systems AS Økonor Norge AS Øyer kommune Ålesund Kommune Aarbakke AS Aasen Bygg AS
65
A n n e x I I
S t a t i s t i c s , c h a r t s a n d
d e t a i l e d p ro j e c t i o n s
66
M o n e t a ry p o l i c y m e e t i n g s i n N o rg e s B a n k
with changes in sight deposit rate
Date Sight deposit rate1 Change
Future meetings 29 June 2006 31 May 2006 26 April 2006 16 March 2006 25 January 2006 14 December 2005
Previous monetary policy meetings
2 November 2005 2.25 +0.25 21 September 2005 2 0 11 August 2005 2 0 30 June 2005 2 +0.25 25 May 2005 1.75 0 20 April 2005 1.75 0 16 March 2005 1.75 0 2 February 2005 1.75 0 15 December 2004 1.75 0 3 November 2004 1.75 0 22 September 2004 1.75 0 11 August 2004 1.75 0 1 July 2004 1.75 0 26 May 2004 1.75 0 21 April 2004 1.75 0 11 March 2004 1.75 -0.25 28 January 2004 2 -0.25 17 December 2003 2.25 -0.25 29 October 2003 2.5 0 17 September 2003 2.5 -0.5 13 August 2003 3 -1 25 June 2003 4 -1 30 April 2003 5 -0.5 05 March 2003 5.5 -0.5 22 January 2003 6 -0.5
1 The sight deposit rate is Norges Bank's key rate. The sight deposit rate is the interest rate on banks' deposits in Norges Bank. The sight deposit rate forms a floor for money market rates. By managing banks' access to liquidity, the central bank ensures that short-term money market rates are normally slightly higher than the sight deposit rate.
67
Table 1
Main macroeconomic aggregates
Percentage change from previous year/ quarter GDP Mainland GDP Private con- sump-tion Public spending on goods and servi-ces Mainland fixed inv. Petroleum inv.1) Exports trad. goods Imports 1997 5.2 4.9 3.2 2.5 11.8 24.9 7.6 12.4 1998 2.6 4.1 2.7 3.3 8.6 22.2 5.4 8.5 1999 2.1 2.7 3.3 3.2 -0.1 -13.1 2.2 -1.8 2000 2.8 2.5 3.9 1.3 -1.2 -23.0 5.1 2.7 2001 2.7 2.1 1.8 5.8 4.3 -4.1 1.5 0.9 2002 1.1 1.4 3.0 3.7 2.5 -5.3 0.4 0.7 2003 0.4 0.7 3.0 1.4 -2.2 16.9 5.1 2.2 2004 2.9 3.5 4.4 2.3 6.1 12.3 3.0 9.1 20042) Q1 1.2 0.6 2.1 1.5 -2.3 7.4 -1.9 3.4 Q2 1.0 0.9 -0.1 0.8 3.1 2.2 -0.6 2.3 Q3 -0.8 1.0 0.9 -0.3 4.8 3.3 5.0 3.5 Q4 1.1 1.5 1.3 0.4 7.4 9.8 2.5 3.0 20052) Q1 0.3 0.6 -0.3 1.1 -8.3 -8.1 -1.9 -3.2 Q2 1.3 0.9 2.5 0.4 7.2 22.5 -0.8 4.7 Level 2004, in billions of NOK 1688 1307 756 371 227 73 210 498
1) Extraction and pipeline transport 2) Seasonaly adjusted quarterly figures
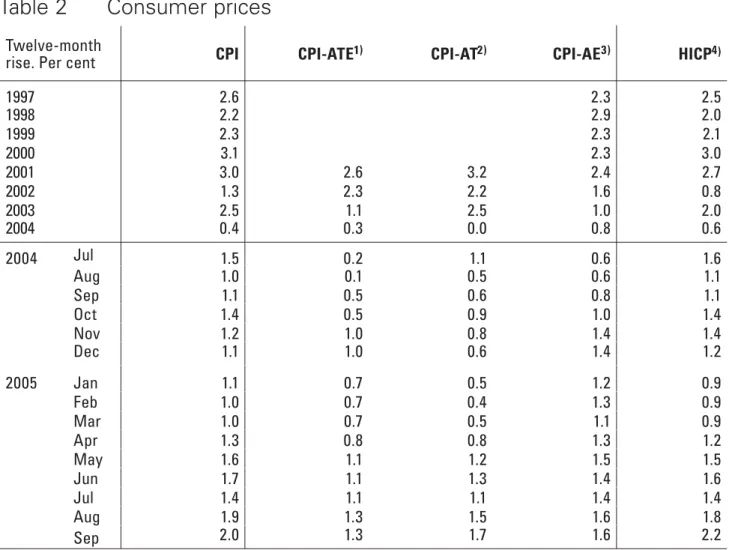
Twelve-month
rise. Per cent CPI CPI-ATE1) CPI-AT2) CPI-AE3) HICP4)
1997 2.6 2.3 2.5 1998 2.2 2.9 2.0 1999 2.3 2.3 2.1 2000 3.1 2.3 3.0 2001 3.0 2.6 3.2 2.4 2.7 2002 1.3 2.3 2.2 1.6 0.8 2003 2.5 1.1 2.5 1.0 2.0 2004 0.4 0.3 0.0 0.8 0.6 2004 Jul 1.5 0.2 1.1 0.6 1.6 Aug 1.0 0.1 0.5 0.6 1.1 Sep 1.1 0.5 0.6 0.8 1.1 Oct 1.4 0.5 0.9 1.0 1.4 Nov 1.2 1.0 0.8 1.4 1.4 Dec 1.1 1.0 0.6 1.4 1.2 2005 Jan 1.1 0.7 0.5 1.2 0.9 Feb 1.0 0.7 0.4 1.3 0.9 Mar 1.0 0.7 0.5 1.1 0.9 Apr 1.3 0.8 0.8 1.3 1.2 May 1.6 1.1 1.2 1.5 1.5 Jun 1.7 1.1 1.3 1.4 1.6 Jul 1.4 1.1 1.1 1.4 1.4 Aug 1.9 1.3 1.5 1.6 1.8 Sep 2.0 1.3 1.7 1.6 2.2
Table 2
Consumer prices
1) CPI-ATE: CPI adjusted for tax changes and excluding energy products 2) CPI-AT: CPI adjusted for tax changes
3) CPI-AE: CPI excluding energy products
Source: Statistics Norway
Charts
0 2 4 6 8 10 1995 1996 1997 1998 1999 2000 2001 2002 2003 2004 2005 0 2 4 6 8 10Source: Norges Bank
Sight deposit rate
3-month money market rate
Chart 1 Norwegian interest rates. 3-month money market rate, sight deposit rate and 10-year government bond yield. Monthly figures. Jan 95 – Sep 05 10-year government bond yield 0 2 4 6 8 10 1995 1996 1997 1998 1999 2000 2001 2002 2003 2004 2005 0 2 4 6 8 10 Euro area1) US Japan
Chart 23-month interest rates in the US, the euro area and Japan. Monthly figures. Per cent. Jan 95 – Sep 05
1)Theoretical ECU rate up to and including December 1998. Source: EcoWin 0 2 4 6 8 10 1995 1996 1997 1998 1999 2000 2001 2002 2003 2004 2005 0 2 4 6 8 10
Sources: EcoWin and Norges Bank
UK Sweden
Chart 33-month interest rates in the UK, Sweden and among trading
partners. Per cent. Monthly figures. Jan 95 – Sep 05
Trading partners
85 90 95 100 105 110 115 1995 1996 1997 1998 1999 2000 2001 2002 2003 2004 2005 85 90 95 100 105 110 115 Import-weighted exchange rate, I-44 (1995 = 100)
Trade-weighted exchange rate index, TWI (1990 = 100)
Chart 4Trade-weighted exchange rate index (TWI) and import-weighted exchange rate (I-44).1) Monthly figures. Jan 95 – Sep 05
1)A rising curve denotes a weaker krone exchange rate.
Source: Norges Bank
5 6 7 8 9 10 1995 1996 1997 1998 1999 2000 2001 2002 2003 2004 2005 60 70 80 90 100 110
1)A rising curve denotes a weaker krone exchange rate. Source: Norges Bank
NOK/EUR (left-hand scale)
NOK/SEK (right-hand scale)
Chart 5Bilateral exchange rates1). Monthly figures. Jan 95 – Sep 05
NOK/USD (left-hand scale) 0 5 10 15 20 1997 1998 1999 2000 2001 2002 2003 2004 2005 0 5 10 15 20
Source: Norges Bank
Credit to households
C2
Chart 6The credit indicator (C2), credit to households and total credit to the
non-financial private sector and municipalities, mainland Norway (C3). 12-month rise. Per cent. Jan 97 – Aug 05
C3 Mainland Norway
70
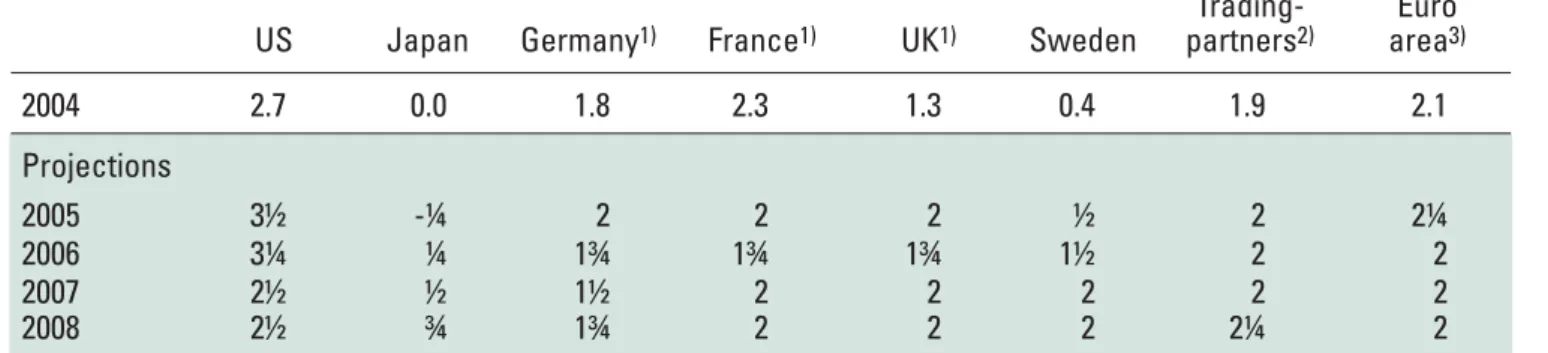
Percentage change from previous year Projections for 2005-2008
US Japan Germany France UK Sweden
Trading-partners1) Euro area2) 2004 4.2 2.7 1.6 2.0 3.2 3.6 3.0 2.0 Projections 2005 3½ 2¼ ¾ 1¼ 2 2½ 2¼ 1¼ 2006 3 1½ 1¼ 1½ 2 2¾ 2½ 1½ 2007 2¾ 1½ 1¼ 2 2¼ 2½ 2½ 2 2008 2¾ 1¼ 1½ 2 2¼ 2½ 2½ 2
1) Export weights, Norway's 25 most important trading partners. Since Inflation Report 2/05 Russia and China have been included in the aggregate, while Singapore and Thailand are no longer included
2) Weights from Eurostat
Sources: IMF, EU Commission and Norges Bank
Table 3
GDP growth in other countries
Percentage change from previous year Projections for 2005-2008
US Japan Germany1) France1) UK1) Sweden
Trading-partners2) Euro area3) 2004 2.7 0.0 1.8 2.3 1.3 0.4 1.9 2.1 Projections 2005 3½ -¼ 2 2 2 ½ 2 2¼ 2006 3¼ ¼ 1¾ 1¾ 1¾ 1½ 2 2 2007 2½ ½ 1½ 2 2 2 2 2 2008 2½ ¾ 1¾ 2 2 2 2¼ 2
1) HICP, Harmonized Indices of Consumer Prices
2) Import weights, Norway's 25 most important trading partners. Since Inflation Report 2/05 Russia and China have been included in the aggregate, while Singapore and Thailand are no longer included
3) HICP. Eurostat weights (each country's share of total euro area consumption)
Sources: OECD, EU Commission and Norges Bank
1) Private and public consumption and mainland gross fixed investment. 2) Extraction and pipeline transport.
3) The output gap measures the deviation in percent between actual and projected potential GDP. 4) CPI-ATE: CPI adjusted for tax changes and excluding energy products.
5) Annual wage growth is based on the Technical Reporting Committee on Income Settlements' definitions and calculations. The projections include estimated costs connected to the introduction of compulsory occupational pensions.
6) Level. The weights are estimated on the basis of imports from 44 countries, which comprises 97 per cent of total imports.
Sources: Statistics Norway, the Technical Reporting Committee on Income Settlements, Directorate of Labour and Norges Bank
Table 5
Main macroeconomic aggregates
In billions of NOK
Percentage change (unless otherwise stated)
Projections 2004 2004 2005 2006 2007 2008 Real economy Mainland demand1) 1355 4.1 3¾ 3¾ 2½ 2¼ - Private consumption 756 4.4 3¾ 3½ 2¾ 2 - Public consumption 371 2.3 1¾ 2 1¾ 3 - Fixed investment 227 6.1 7¾ 6 3¼ 2½ Petroleum investment2) 73 12.3 20 2½ -2½ -5 Traditional exports 210 3.0 3½ 3¼ 3½ 3¼ Imports 498 9.1 7¼ 4¼ 2¼ 1¾ GDP 1688 2.9 2½ 2¾ 2¼ 2¼ Mainland GDP 1307 3.5 3¾ 3¼ 2½ 2¼ Potential mainland GDP 3 2¾ 2½ 2½ 2½
Output gap, mainland Norway3) -¾ ¼ 1 1 ¾
Labour market
Employment 0.2 ¾ 1½ 1 ¾
Labour force, LFS 0.3 ¾ 1 1 ¾
Registered unemployment (rate) 3.9 3½ 3¼ 3¼ 3¼
LFS unemployment (rate) 4.5 4½ 4 4 4
Prices and wages
CPI 0.4 1½ 2 2 2½
CPI-ATE4) 0.3 1 1¾ 2 2½
Annual wage growth5) 3.5 3½ 4¼ 4½ 4½
Interest rate and exchange rate
Sight deposit rate (level) 1.8 2 2¾ 3½ 4¼
Import-weighted exchange rate (I-44)6) 95.6 91.8 91.0 91.4 91.9
72