DOI 10.1007/s00778-010-0203-9 R E G U L A R PA P E R
Event correlation for process discovery from web service
interaction logs
Hamid Reza Motahari-Nezhad · Regis Saint-Paul · Fabio Casati· Boualem Benatallah
Received: 19 July 2009 / Revised: 12 July 2010 / Accepted: 30 August 2010 © Springer-Verlag 2010
Abstract Understanding, analyzing, and ultimately improving business processes is a goal of enterprises today. These tasks are challenging as business processes in mod-ern enterprises are implemented over several applications and Web services, and the information about process execu-tion is scattered across several data sources. Understanding modern business processes entails identifying the correla-tion between events in data sources in the context of busi-ness processes (event correlation is the process of finding relationships between events that belong to the same pro-cess execution instance). In this paper, we investigate the problem of event correlation for business processes that are realized through the interactions of a set of Web services. We identify various ways in which process-related events could be correlated as well as investigate the problem of discov-ering event correlation (semi-) automatically from service interaction logs. We introduce the concept of process view to represent the process resulting from a certain way of event correlation and that of process space referring to the set of possible process views over process events. Event correlation H. R. Motahari-Nezhad (
B
)HP Labs, Palo Alto, CA, USA e-mail: [email protected] H. R. Motahari-Nezhad·B. Benatallah
University of New South Wales, Sydney, NSW, Australia e-mail: [email protected]
B. Benatallah
e-mail: [email protected] R. Saint-Paul
CREATE-NET, Trento, Italy
e-mail: [email protected] F. Casati
University of Trento, Trento, Italy e-mail: [email protected]
is a challenging problem as there are various ways in which process events could be correlated, and in many cases, it is subjective. Exploring all the possibilities of correlations is computationally expensive, and only some of the correlated event sets result in process views that are interesting. We pro-pose efficient algorithms and heuristics to identify correlated event sets that lead potentially to interesting process views. To account for its subjectivity, we have designed the event correlation discovery process to be interactive and enable users to guide it toward process views of their interest and organize the discovered process views into a process map that allows users to effectively navigate through the process space and identify the ones of interest. We report on exper-iments performed on both synthetic and real-world datasets that show the viability and efficiency of the approach. Keywords Business processes·Event correlation · Process views·Process spaces
1 Introduction
Business processes (BPs) are central to the operation of any organization [10,44]. A business process is a set of coordi-nated activities for achieving a business objective. The qual-ity and efficiency of the services that organizations provide to customers, citizens and employees, and the competitive-ness of organizations hinges on continuous busicompetitive-ness process improvement. In the nineties, the focus of process improve-ment was on automation. Workflow manageimprove-ment systems (WfMS) and other middleware technologies were used to reduce cost and improve efficiency by providing better sys-tem integration and automated enactment of operational business processes [16]. Recently, the process improvement focus has shifted to process analysis, where the goal is
to understand how a business process is performed and to identify opportunities for improvement. However, since the wide-scale automation has led to having business processes implemented over many systems, answering questions such as: What’s the status for the hiring of John Smith? What is the average hiring delay due to visa procedures for EU workers? How many people are typically involved in a hiring process? Which business units have the higher hiring costs per person? that once was easier (when all processes were implemented using one or more WfMSs) [17], becomes difficult at best.
The main barrier for answering questions like those above is that the information about process execution is scattered across several systems and data sources, and in many cases, there is no well-documented information on how this infor-mation is related to each other and to the overall business pro-cess of the enterprise. In this context, a key problem is how to identify such relationships, i.e., how to correlate infor-mation elements (and in particular events related to process executions) in data sources to understand which information elements belong to the same execution (instance) of a pro-cess (e.g., detecting that a data entry in SAP and a message sent over an enterprise service bus are related to the pur-chase order no. 325). Note that here we do not focus on the heterogeneity issue of data sources containing the process execution information. We rather assume that the process-related data is integrated by relying on existing data integra-tion approaches [38].
We focus on the problem of event correlation in the context of service-based processes (those business processes realized through the interaction of a set of Web services). Event cor-relation is a challenging problem for several reasons: First, there are various ways in which correlation of process events could be defined. Indeed, the decision on how to correlate events is made independently and differently from one appli-cation and one domain to another. For instance, in a supply chain scenario, all events of a process instance for ordering goods may have an attribute calledOrderID, and therefore events are correlated based on the value of this field. How-ever, there is no general rule or standard, and not all mes-sages related to the same order in different IT systems have an attribute calledOrderID: events related to the same order may first be identified by a quotation number, then by the actual order number, and finally by the invoice number. In addition, more than one attribute may be needed at the same time (e.g., bothOrderIDandCustomerID). Therefore, the number of attributes of messages to be used as correlators and the number of possible combinations of such attributes across messages is potentially high.
Furthermore, event correlation is subjective, and depend-ing on the person interested in the correlation, the same set of events may be seen to be related to different process instances and process views. For example, events related to the ship-ping of some goods may be related to a given shipship-ping process
instance from the perspective of a warehouse manager; how-ever, if the goods are the results of different purchase orders, they belong to multiple purchase order instances from the perspective of the ordering manager. As a consequence, it is hard to define what is a “good” or “optimal” correlation and to devise an automated algorithm that discovers such “good” correlations. Considering the subjectivity of the correlation, another challenge is how to find interesting correlations for a user (e.g., a business process analyst) or guide her through the search space of ways of event correlation to identify the interesting ones for her.
In this paper, we introduce abstractions, algorithms, and a tool for semi-automated correlation of process events. We make the following contributions:
– We characterize the problem of event correlation in service-based processes and introduce the notion of correlation condition that defines which sets of events in the service log belong to the same instance of a pro-cess. A correlation condition partitions (a subset of) the events in the log into instances of a process and, there-fore, allows to partition the events in the log into a set of process instances.
– We introduce the notion of process view referring to the process resulting from a specific way of correlat-ing events in service logs based on a given correlation condition. A process view is represented by the process model of the resulting process instances. If a set of process instances are given, there exist automated process discov-ery approaches (see [45] for a survey) to infer a process model that generates those process instances. We have used existing work (the previous work of authors [31]) to discover the process model corresponding to a set of pro-cess instances. In addition, we define the notion of propro-cess space to model possible process views across events in the data source. The notions of process view and process spaces are introduced to help users in understanding the results of event correlation at the process level.
– We present algorithms for the semi-automated discov-ery of interesting process views from process event logs. The proposed approach starts from discovering simple conditions (defined based on a pair of attributes) fol-lowed by discovering composite conditions (comprised of two or more conditions) by adopting a levelwise approach [28]. We define heuristic-based criteria and objective metrics on the resulting process instances (e.g., size or the number of process instances) to find potentially interesting process views for users. The heuristics and metrics help in pruning the search space of possible cor-relation conditions. This is crucial to reduce an otherwise large search space of correlation conditions. To account for the subjectiveness of identifying interesting process views, we design the discovery of event correlations as an
interactive process where the user inputs are taking into account in two ways: (i) heuristic-based measures pro-vide configurable parameters that can be set before start-ing each discovery step and (ii) user feedback is sought after each step of the discovery process and is taken into account to further prune the space and direct the search toward interesting process views for the user.
– To additionally account for the subjectiveness of event correlation as well as to enable the user to better under-stand a potentially large space of automatically discov-ered process views, we define a conceptual model for organizing sets of candidate views in a process map. A process map allows users to explore the process space and navigate through the set of discovered process views to identify the ones that fit their needs or refine the results. – We have implemented the proposed approach in a tool
calledProcess Spaceship[30]. We have conducted experiments that show the viability and efficiency of the proposed approach on both synthetic (a supply chain sce-nario) and real-world datasets (a real-time game service). The rest of the paper is structured as follows: Sect.2gives a motivating example, the definitions, and the description of event correlation and process views discovery problem. Section3 presents an overview of Process Spaceship sys-tem. Section4describes the back-end components of Pro-cess Spaceship including heuristics and a set of algorithms for event correlation. Section5explains the front-end component of Process Spaceship consisting of process map and a visual, interactive environment for exploration and refinement of discovered process views. In Sect.6, we present implemen-tation of Process Spaceship and experiments. We discuss related work in Sect.7and conclude and outline future work in Sect.8.
2 Concepts and problem definition 2.1 Motivating example
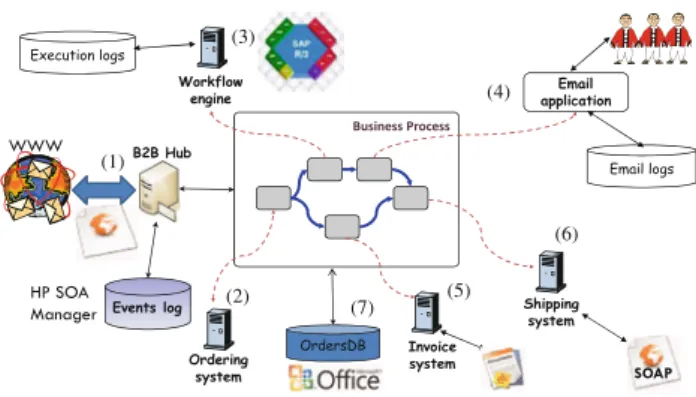
Modern business processes are rarely supported by a single, centralized workflow engine. Instead, the process is realized using a number of autonomous systems and Web ser-vices. As an example, consider the purchase order scenario depicted in Fig.1. An order is first received by the company through a B2B hub. This hub can be a monitoring software infrastructure, an EDI receptor, or an e-commerce applica-tion such as Ariba.1Its task is to log the reception of the new order event and verify its conformance. Once verified, the order is routed (through, e.g., a message broker) to the work-flow management system that initiates the approval process. 1www.ariba.com.
Fig. 1 Business processes in modern enterprises
The approval requires human interaction with the workflow system but is also inevitably characterized by email and doc-ument exchanges among people as part of the decision pro-cess. This may require interactions with other systems such as the ERP or the CRM. Once the order has been approved, it is sent to the invoicing and payment systems. During the process, documents (e.g., the purchase order and approval documents) may also be stored in a document management system to facilitate their collaborative editing.
In the above example, the information related to the pur-chasing process is scattered across several independent sys-tems and data sources. In this scenario, understanding and tracking process execution is challenging: often there is no information on how data in one system is related (correlated) to another and to the overall business process of the enter-prise. For instance, the accounting system may keep track of invoicing and related payments through the invoice num-ber, while the supply workflow may use an internal process instance numbering. Furthermore, there is a push in the enter-prise for looking at processes from the perspective of users and thus at various levels of abstraction. Therefore, the key challenges in modern enterprises include finding the corre-lation of process-related events in data sources in order to understand them in the context of business processes, as well as enabling to look at the process definitions from the per-spective of various users and at multiple levels of abstraction. 2.2 Definitions
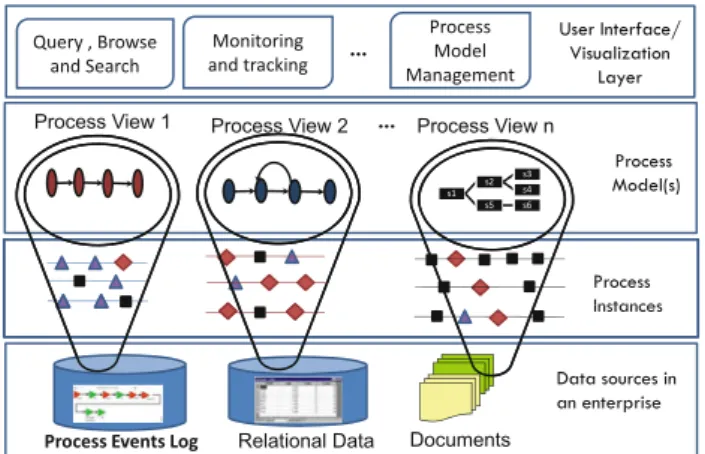
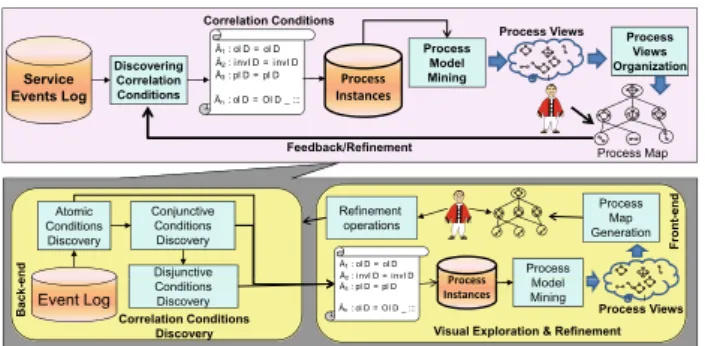
We present the following layers for understanding process-related data and abstractions in modern enterprises: data sources layer, process instances layer, process model layer, and finally user interface/visualization layer, as illustrated in Fig.2.
Data sources layer. This layer represents data sources and systems that capture and maintain information related to process executions. At this layer, the main concept is that of process information item, which is the process-relevant unit of information stored by the source and that can be for
Fig. 2 Process-related layers in modern enterprises
example a row in a database, an event in a log, a Word document (purchase order) in a document repository, a SOAP message exchanged between two services, an email, and so on. In this paper, we consider service events, which are related to the exchange of messages between a set of Web services realizing a business process, where such exchange is mon-itored and captured in an event log. An event identifies the exchange (arrival or send) of a message, and therefore, we use the terms “message” and “event” interchangeably. We call a log containing events related to message exchanges in the context of process execution a process event log. We assume that the content of messages is available in the log and define a process event log as follows:
Definition 1 (Process event log) A process event log is a set of messagesL= {m1,m2, . . . ,mn}, where each message m
is represented by a tuple mi ∈ A1×A2×· · ·×Ak. Attributes
A1, . . . ,Akrepresent the union of all the attributes contained
in all messages, although each single message typically con-tains only a subset of these attributes and will therefore have many of its attributes undefined in itsLrepresentation.
We denote by mx.Ai, the value of attribute Ai in
mes-sage mx. We assume that each message mx has an attribute
that denotes the timestamp at which the event (related to the exchange of mx) has been recorded, denoted mx.τ. Messages
inLare ordered by their timestamp.
Process instances layer. A process instance refers to one execution of a particular process from the beginning to the end. In other words, it refers to the execution of a set of pro-cess tasks [46]. For example, one instance of the purchasing process consists of filing a specific purchase order, receiving corresponding invoice, making payment and its shipping. A process instance can be represented by a partially ordered set of observable events corresponding to the execution of pro-cess tasks. We define a propro-cess instance formally as follows: Definition 2 (Process instance) A process instance p is a sequence of messages p= m1,m2, . . . ,mncorresponding
to a subset of messages of the logL, partially ordered by their timestamp.
For example, the process instance corresponding to the above example would be represented as the sequence of p=
send Or der,get I nvoi ce,make Payment,Shi p.
Process model layer. A process model is the abstract rep-resentation of a process in the form of a graph showing all valid orders of execution of process tasks. Process models can be expressed in languages such as BPMN, Petri nets, and state machines. In this paper, we assume the finite state machine representation of process models for interactions between services, relying on the definition given in [7,31]: Definition 3 (Process model) A business process P is a deterministic state machine represented as a tuple P =
(S,s0,F,M,T), whereSis the set of states of the process,
Mis the set of messages supported by the services (qualified by their name),T ⊆ S×S×Mis the set of transitions, s0is the initial state, andF represents the finite set of final
states. A transitions from state s to state striggered by the message m is denoted by the triplet(s,s,m).
The sequence of messages generated by traversing the state machine from s0to a final state corresponds to a
spe-cific process instance. A process model allows generation of all valid (acceptable) process instances of a process imple-mented by service or a set of services. Therefore, given a set of process instances observed from the interaction of ser-vices, a process model can be devised to represent them (e.g., using process mining approaches [45]). Therefore, we can define also a process model P for a set of process instances P I = p1,p2, . . . ,pnas a finite state machine in which any
transition is labeled with a message m∈L, and any message sequence p= m1,m2, . . . ,mnin P I is accepted by P.
It should be noted that this definition of P may allow the generation of process instances that are not in P I . This is acceptable in process mining applications, as not all valid process instances may be present in the log [31,45]. Note also that in this paper, we use state machine-based formal-ism to represent the discovered model of the external interac-tions of services. This formalism is capable of representing sequential interactions between services (see [7] for the dis-cussion about the suitability of this formalism for describing the external behavior of services). Nevertheless, our event correlation framework is generic and allows adopting other more expressive process models such as Petri nets for repre-senting the discovered process model of the interactions of services (e.g., as used in [14]).
Process views. The notion of process views in this paper refers to the representation of a process that is the result of understanding a set of process events (in a log) from a spe-cific perspective. A process view consists of a set of process events, the set of process instances formed on these events
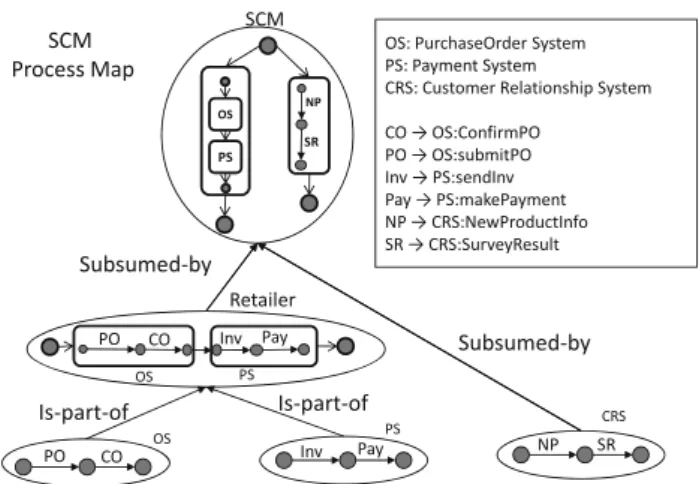
Fig. 3 Part of process map forSCM (Supply Chain Management) dataset
(result of grouping events in a specific way), and their respec-tive process model. Formally, we define a process view as follows:
Definition 4 (Process view) A process view is a tuplev =
(Lv,P Iv,Pv)in which
– Lv⊂Lis the set of events related to process execution; – P Iv is the set of process instances of v corresponding to grouping of the events Lv via a specific method of correlating events;
– Pv is the process model that generates the process instances P Iv.
A process view provides a high-level representation of process executions in an enterprise. Process views may rep-resent the processes of the enterprise at various abstraction levels (e.g., the whole enterprise, a department within the enterprise or activities of an individual user). Therefore, process views may have relationships with each other (the process view of a whole enterprise includes that of a depart-ment). We represent the set of process views corresponding to a process event log asV.
As an example, Fig.3 shows a set of process views defined in a supply chain management scenario. The scenario includes views corresponding to purchase order (OS), pay-ment (PS), and customer relationship (CRS) systems. Symbol
POdenotes the short form of OS:submitPOoperation, i.e., the operationsubmitPOof OS system. The extended form of other symbols (CO,Inv,Pay,NP, andSR) are shown in Fig.3.
Note that the notion of process view is defined differ-ently compared to its conventional use in the literature (e.g., in [9,26,43,48]), where a base process model is assumed and process views represent the same process model at various levels of abstraction (e.g., by applying operations such as
aggregation of nodes) or different portions of it (e.g., cor-responding to different users/roles). In our context, process views include a set of events, the respective process instances and process model. Several process views can be defined on the same set of events corresponding to various ways of understanding events in the context of process execution (i.e., various ways of correlating them). Though, similar to exiting work, in our work, the process model of the process views may be defined at various levels of abstraction or views may cover different parts of a process (corresponding that of a particualr system or a user/role).
Process views relationships and process map. Process views represent different perspectives of the process execu-tions over the same set of events in the log. Therefore, they may have relationships. For example, a view may only rep-resent a subset of the process defined by another view. The relationships between views correspond to the relationships between their respective set of process instances (and there-fore their respective process models). In particular, since we assume sequential business processes related to the inter-action of services, the most relevant relationships between process instances (as sequences of events) are “part-of” and “subsumption” defined as follows2:
Definition 5 (Subsumption) Process X is subsumed by pro-cess Y if P Ix ⊆P Iy.
This relationship allows specifying if one process is more specific than another (e.g., Retailer and CRM views are sub-sumed by SCM view in Fig.3).
Definition 6 (Part-of) Process X is part-of process Y if any given instance p of X is part-of some instance p of pro-cess Y . An instance p of propro-cess X is part-of instance pof process Y if all messages in p appear in the same order in p. For example, instancesm1,m2andm2,m4are part-of
instancem1,m2,m3,m4. Processes of OS and PS views in
Fig.3are part-of that of Retailer view. This relationship high-lights that a process is a part-of a larger (composite) service interaction model.
In order to allow organizing the process views for eas-ier exploration and understanding of their relationships, we introduce the notion of process map defined as follows: Definition 7 (Process map) A process mapM=(N,A)is a labeled, directed graph (digraph) in which (i) each node N1represents a process viewv1 ∈V, (ii) for N1,N2 ∈M,
if P2(of N2) is “subsumbed-by” or is “part-of” P1(of N1),
there is an arc from N1to N2labeled with “subsumbed-by”
or “part-of”, respectively.
2 In general, relationships between process models could be more com-plex as [47] witnesses, depending on the expressiveness of the chosen business process model.
We propose a method for the spatial organization of pro-cess views in a propro-cess map in Sect. 5.1to facilitate the navigation of the process views.
Process space. A process space defines the scope for pro-cess views over the set of propro-cess events in an enterprise. It covers a set of data sources (i.e., process events) plus the set of process views, organized in a process map, that enable the interpretation of these events in terms of process models and event correlation. As such, a process space is the world and the process map is its model using which we can perform process exploration and analysis. We define a process space as follows:
Definition 8 (Process space) A process spaceS is a tuple S = (L,V,M), in which Lis the event log, V is the set process views defined on top of events inL, andMis the process map for the organization of process views inV.
In the following, we focus on the problem of discovering the process views of an enterprise to build its process space starting from the process event logs.
2.3 Process views discovery problem
The goal of process views discovery is to derive a process mapM(a set of process views) starting from the set of events inL. This implies addressing three sub-problems: (i) how to correlate events into process instances for a given view; (ii) how to derive process models from a set of instances for a view (known as process mining problem [45]); (iii) how to organize process views into a map that is deciding which views and at which level of abstraction.
We recognize that the heart of the problem is to find cor-relation between events and hence be able to transformL into a set of P I s. In this paper, we do not focus on the sec-ond subproblem (process mining). Indeed, for a given set of process instances P I , we can leverage one of the many exist-ing algorithms for process minexist-ing [45], including our prior work [31], to discover process model P for each P I depend-ing on which kind of process we aim at discoverdepend-ing or the assumption made on the input dataset. In this paper, we also do not deal with the heterogeneity of data formats in logs containing the process execution events. Instead, we rely on existing approaches in data integration [38] and assume that data are collected from the source systems and transformed into an homogeneous event format.
In the following, we focus on the first and the third sub-problems, i.e., event correlation and organizing process views into a process map.
Event correlation problem. The event correlation problem poses a number of interesting challenges and questions: first, how to define correlation between events inL? For example, considering the SCM scenario in Fig.3, we want to specify that POandCOitems belong to a same process instance
inOS view, but thatNPdoes not. Second, how to identify, among the many possible views, which ones are interest-ing and lead to a map the analyst finds useful for analysis purposes? Third, how to efficiently search the space of event correlations, and their corresponding set of process instances, that potentially lead to interesting process views? We further discuss these items as follows:
Correlation condition language. Addressing the issue of how to define correlation between events translates to defin-ing methods or a language that specifies event correlation according to the values of their attribute. We define a correla-tion condicorrela-tionψ, a predicate over the attributes of events that can verify whether two events belong to the same instance. For instance, looking at the attributes of POandCO, we may observe that, e.g., they share the same value for the order number attributeoID. In this case, the correlation condition can be expressed as “having a common value onoID”. We need to identify the possible forms that correlation conditions can take in service-based processes.
Interestingness of process instances. As mentioned ear-lier, identifying interestingness is “subjective”: the interest-ingness of a process view (representing a given way of event correlation) depends on what we want to analyze and on the perspective from which we look at the domain. While iden-tifying interesting is subjective in general, there are certain correlations of events that may not make sense from a process perspective. The issue is how to capture properties of such correlations and consider them in defining objective mea-sures that are used to exclude such P I s. This approach is also called identifying interestingness through finding what is not interesting [29,39]. For example, grouping of events based onitemColorattribute in an order may not yield an interesting process view.
Heuristics help in identifying what is not interesting for all users; however, the issue of subjectiveness of process views has to be considered from the perspective of individual users who will be looking at the process map. Therefore, it is cru-cial to formulate heuristics-based interestingness measures so that user domain knowledge, input, and feedback are taken into account.
Efficient discovery of interesting process views. There are many ways to correlate events based on different correlation conditions leading to different process instances and pro-cess models. Indeed, the space of correlation conditions is large because there are many attributes of events that can be considered as correlators and because all their combinations may form correlation conditions leading to potentially inter-esting process views (see Sect.4.3). For example, bothoID
andcustomerIDmay be required to correlate messages of a view related to the ordering system into process instances corresponding to the individual purchase of each customer.
There are three related challenges and questions to address: (i) how to efficiently search the space of possible
correlation conditions while avoiding an exponential explo-sion in processing time; (ii) how to design an approach that takes into account user inputs along with heuristics to build a good process map. User inputs could be used to set values for the properties of the process instances that are likely of inter-est (or, alternatively, allow excluding set of process instances that are unlikely to lead to interesting process views); and (iii) how to support the user in providing feedback and driving the process of discovered process views during event correlation. Organizing and exploring process views. The purpose of efficient discovery of process views is to prune the search space of possible process views, based on heuristics and user inputs, so that a small number of potentially interesting pro-cess views are discovered. Nevertheless, a challenge is how to facilitate the job of users in exploring the set of discov-ered views, which in practice could be potentially large, in a process map. In particular, one challenge is identifying relationships between the process views, and another is to arrange them in the space (page) so that they can be easily explored. Another purpose of process maps is to support the refinement of the discovered process views based on user feedback.
In the following, we present a system, called process views discovery system, to semi-automatically discover pro-cess views over a propro-cess event log and address the above-mentioned challenges.
3 Process views discovery system
We propose the design and development of a system, called process views discovery system (PVDS), that takes a set of process events as input and enables the explorative discov-ery of process views over them. The core functionality of a PVDS is discovering different ways by which process events, the input, can be correlated into process instances, thereby identifying different process views.
In the following, we first characterize concrete forms of correlation conditions in the context of service-based pro-cesses. Then, we present an overview of Process Spaceship architecture, as a PVDS, for the discovery of correlation con-ditions for service-based processes.
3.1 Correlation conditions in service-based processes Events related to the execution of business processes, and particularly those implemented over Web services, are often correlated into process instances using methods used by pro-cess-related standard proposals for Web services such as BPEL, WS-Conversation, WS-CDL [4], or methods pro-posed by industrial software products such as IBM Web-sphere Process Manager [23]. These specifications propose
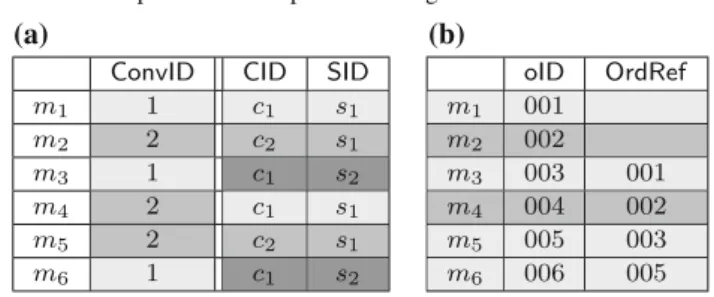
Table 1 Snapshots of example service logs
(a) (b)
The events in rows shaded the same way are part of the same process instance
correlation methods based on either attributes of the mes-sage payload or attributes in the mesmes-sage header (mesmes-sage metadata). We assume that the information needed to perform the correlation is available in the log. This assumption is rea-sonable since messages are indeed correlated by the recipient services and, therefore, need to be present. We define a cor-relation condition, which is a method to corcor-relation events, as follows:
Definition 9 (Correlation condition) A correlation condi-tion is a binary predicate defined over attributes of two mes-sages mxand myand denoted byψ(mx,my). This predicate
is true when mx and myare correlated and false otherwise.
For example, Table1a shows a snapshot of an event log based on Definition 1. One possible correlation condition is ψ(mx,my) : mx.CID = my.CID. Using a correlation
condition ψ, it is possible to partition a logL into a set of process instances. Now, we can define the following two properties on the message sequence of a process instance c= m1,m2, . . .: (i) any message mx ∈ c is directly
cor-related with at least one other message my ∈c,y= x, i.e.,
ψ(mx,my)holds for some conditionψ, and (ii) all the
mes-sages m∈Lcorrelated with at least one message of c are also in c (i.e., c is a maximal subset with respect to the correlation condition).
To better see how a correlation conditionψpartitions the log into process instances, let us denote the set of correlated message pairs based on conditionψ inLby Rψ. We have Rψ = {(mx,my)∈L2|ψ(mx,my)}. For instance, for
condi-tionψ :mx.oID=my.OrdRefin Table1b, we have Rψ = {(m1,m3), (m2,m4), (m3,m5), (m5,m6)}.3In this case, the
set of instances P Iψ = {m1,m3,m5,m6,m2,m4}
con-sists of two instances. As mentioned before, since the set of instances can be obtained by applying a correlation condi-tionψon events in logL, we can say that a process view is characterized by correlation conditionψ.
3 Whenψis commutative, a pair(a,b), also implies(b,a). For brevity, we have assumed this property and not shown all pairs in this example.
In the following, we present the common correlation meth-ods identified by studying standardization proposals and industrial process management tools. These methods indi-cate families of correlation conditions that will have to be investigated for the discovery of process views. While we focus here on the web service context, these methods for cor-relating messages or events are actually generic and found in other context as well.
3.1.1 Process instances using a single correlation method We first examine the case of instances where the correlation method is the same throughout the entire instance. These methods can be classified into the following three families: key-based, reference-based, and composite.
Key-based correlation. In the simplest case, a unique value is used in each message to directly identify the instance to which it belongs. This value acts as a key that uniquely identi-fies the instance. For instance, the attributeConvIDin the log of Table1a acts as a key since messages m1,m3, and m6all
have the value “1” on this attribute. The corresponding cor-relation condition isψkey :mx.ConvID=my.ConvID, and
we have P Iψkey(L) = {m1,m3,m6,m2,m4,m5}. This method of correlation is called a key-based correlation.
Reference-based correlation. In other cases, messages of an instance are correlated using a reference with a previous message in the instance. In this case, any message (except the first) carries a reference attribute with a value equal to that of an identifier attribute in a previous message. For exam-ple, messages in Table1b are correlated using this method, called reference-based correlation, by the correlation condi-tionψr e f :mx.oID=my.OrdRef.
Both the key-based and reference-based correlation meth-ods can be modeled through the same family of correlation conditions expressing equality of attribute value into pairs of messages. We refer to conditions that belong to this family as atomic correlation conditions. They are defined as follows: Definition 10 (Atomic correlation condition) An atomic correlation condition ψ specifies that two messages are correlated if they have the same value on two of their attributes Aiand Aj, i.e.,ψ:mx.Ai =my.Aj. Note that we
might have i= j in the case of key-based correlation. Similar to the concept of composite keys in databases, where keys may consist of more than one attribute, the method used for correlating messages may rely on sev-eral attributes. For instance, messages of an instance may be correlated using the values of attributes customer ID (ψ1 :mx.CID=my.CID) and survey ID (ψ2: mx.SID=
my.SID), as for messagesNPandSR(Fig.3, CRS view).
Figure1a shows a log corresponding to this scenario (assum-ing attributeConvIDis not present). In this case, the
correla-Table 2 A snapshot of the log for Retailer view in Fig.3(messageCO is not considered for brevity purposes)
The events in rows shaded the same way are part of the same process instance. We defineψ1:mx.OID=my.OID, ψ2:mx.invID=my.invID
tion condition can be denoted as ψc = ψ1∧2 = ψ1∧ψ2.
We refer to correlation conditions in this second familly as composite conjunctive (for short, conjunctive). In this example, ψ1∧2 partitions the log into three instances, i.e.,
P Iψ1∧2(L)= {m1,m4,m2,m5,m3,m6}.
Definition 11 (Conjunctive correlation condition) A Con-junctive correlation condition is a conjunction of more than one atomic condition. It follows the general form of ψ :
ψ1∧ψ2∧ · · · ∧ψvwhereψis, 1≤i≤vare atomic
condi-tions.
3.1.2 Process instances using multiple correlation methods When a process spans multiple systems, it is not rare that the method used for correlating messages is different from one system to another. Even different pairs of messages of an instance in one system may use different correlation meth-ods. In these cases, several correlation conditions are needed to correlate the messages of the same instance. For example, consider the log in Table2(the corresponding model is illus-trated in Retailer view, Fig.3). Messages of typePOandInv
are correlated using the conditionψ1 :mx.oID =my.oID,
and messagesInvandPayare correlated using the condi-tionψ2:mx.invID=my.invIDbut all are part of the same
instance in this view. For such instances, messages mx and
myare correlated if they satisfy eitherψ1orψ2(or they may
satisfy both). These three messages form a unique instance under conditionψd=ψ1∨2=ψ1∨ψ2. We call such
condi-tions composite disjunctive condicondi-tions (or “disjunctive con-ditions” for short). They are defined as follows:
Definition 12 (Disjunctive correlation condition) A dis-junctive correlation condition is a disjunction of more than one atomic or conjunctive conditions. Conditions of this fam-ily follow the general formψ :ψ1∨ψ2∨ · · · ∨ψuwhere
ψis, 1≤i ≤u, are either atomic or conjunctive conditions.
Note that disjunctive correlation conditions can be also used to express correlation condition of processes that accept instances where different group of them is correlated using
different correlation conditions. For instance, the model illus-trated in SCM view of Fig.3allows the instances of CRM view, correlated using conditionψc, as well as instances of
Retailer view, correlated withψd (see above). The
correla-tion condicorrela-tion for SCM view is expressed using the disjunc-tive conditionψc∨ψdas its set of instances is the union of
the set of those of Retailer and CRM views.
3.1.3 Other correlation methods
The correlation methods above do not cover the entire scope of possible methods. For instance, time constraints can be used as part of correlation condition definitions. The Cho-reography Description Language (WS-CDL) [4] allows to define a time limit for an instance. In terms of correlation con-dition, this would translate into an additional constraint on the time difference between two messages, with correlation con-ditions of the form,ψ:mx.Ai =my.Aj∧ |mx.τ−my.τ| ≤
Max Dur ati on, where Max Dur ati on expresses this time constraint.
In the following, we focus on the identification of fam-ilies of correlation conditions. We believe they reasonably cover the scope of methods most commonly used in service-oriented environments. However, the overall approach would be the same for extending discovery to these other families of conditions or to entirely different contexts (e.g., software execution traces or EDI).
3.2 Process spaceship: overview and architecture
We propose Process Spaceship as a PVDS that enables the discovery of process views and organizing them in a process map starting from a process events log. We have presented Process Spaceship prototype in [30]. This paper presents a framework (extended from [30]) and the set of algorithms for process views discovery, described in detail in the following sections, to address the challenges listed in Sect.2.3.
As shown earlier, the discovery of process views corre-sponds to identifying various ways that process events form process instances. Therefore, it maps into the exploration of the space of possible correlation conditions. Considering the types of correlation conditions listed in Sect.3.1, the num-ber of potential correlation conditions, if considered from a purely combinatorial point of view, is large: one might first try each atomic condition, that is, the a=k2/2 possible pairs of attributes (in a log with k attributes). Then, one might attempt to combine these atomic conditions to form conjunc-tive and disjuncconjunc-tive composite conditions. In theory, there can be c=2a−1 conjunctive conditions to explore and finally 2(a+c)−1 disjunctive conditions. An exhaustive search would not scale. Moreover, many of the correlation conditions pro-duced are not interesting to the user. For instance, grouping
Fig. 4 The conceptual architecture of Process Spaceship
messages based on the total amount of a purchase is unlikely to produce an interesting process view.
To explore the space of possible event conditions effi-ciently, we adopt a level-wise approach [28] and use a set of heuristic criteria to reduce the space of possible correla-tion condicorrela-tions. In this approach, the set of candidate con-ditions is grown from atomic to composite (conjunctive and disjunctive), and at each level process views that do not sat-isfy objective interestingness measures are pruned. Figure4 shows the architecture, organized into two components: a back-end, responsible for discovering interesting views (pre-sented in Sect.4), and a front-end, for visualization and user-driven refinement (see Sects.5and6.3).
In Process Spaceship, we limit the information items to process events according to the Definition 1. For process models, we use finite state machines according to Defini-tion 3. Process Spaceship looks to discover the family of correlation conditions identified in Sect. 3.1(atomic, con-junctive and discon-junctive). We use the algorithm presented in [31] for discovering process models for a set of process instances (of a process view) that are the result of correlat-ing events uscorrelat-ing a given correlation condition. We introduce heuristics to filter potentially non-interesting correlation con-ditions.
The process views discovery is an interactive and user-driven process, which complements heuristic-based approach for pruning non-interesting correlation conditions: at the beginning/end of each phase (atomic condition discovery, etc) the user has the opportunity for providing input and feed-back that are taken into account for guiding the next phase. In particular, (1) each discovery phase provides a set of config-urable parameters and thresholds, which are manipulable by the user before each discovery step; (2) the tool presents the results of each step (discovered process views based on cor-relation conditions) and enables the user to provide feedback by selecting interesting correlation conditions (by looking at the resultant process views) to identify the interestingness of process views and to direct the event correlation process for the next phase. Finally, all potentially interesting process views are organized and presented in a process map, which
is a visual way to navigate views based on their relationships and levels of abstraction. Exploring and browsing a process map enable users to decide about the interestingness of dis-covered process views and to initiate an iterative refinement process of discovered views.
4 Semi-automated process views discovery
In this section, we present the backend algorithms used in Process Spaceship. We first specify the notion of interest-ingness for correlation conditions. Then, we show how this notion allows exploring in a tractable way the space of pos-sible correlation conditions.
4.1 Interestingness of correlation conditions
The notion of interestingness is eminently subjective, and a variety of metrics have been proposed and used to character-ize it [29]. The following observations guide our choice: First, our objective is to support the exploration of the process space and, in turn, the space of possible correlation conditions. We aim at using objective metrics rather than subjective metrics as the latter may lead to the premature rejection of correla-tion condicorrela-tions. We prefer a high recall (implying visiting more correlation conditions) to enable preserving possibly interesting conditions. Second, we aim at designing metrics that capture the domain knowledge of users and their require-ments for finding interesting process views.
4.1.1 Non-interestingness criteria for condition selection In our work, we take the approach of specifying interest-ingness of correlation conditions on the basis of what is not interesting [39]. We recognize that while the interestingness of a correlation condition depends on the user viewpoint, this choice relies on exploration of the observation that there exist objective criteria allowing to reject correlation condi-tions that are clearly, and regardless of the user, non-inter-esting in the context of service-oriented processes. These criteria are detailed hereafter.
(A) Globally unique values are not correlators: In this paper, we focus on correlation conditions defined based on equality of values in some attributes of two or more mes-sages (this is the most common method in service-oriented context). Hence, an attribute is a possible correlator only if it contains values that are not globally unique, i.e., they can be found in another message, whether on the same attribute (key-based correlation) or on a different one (reference-based correlation). Attributes having unique values, i.e., their val-ues are not repeated in any attributes of other tuples, can be tagged as non-interesting. Conversely, attributes with very
small domains (e.g., Boolean) are not interesting either since each value will be repeated on a large number of messages and lead to few trivial partitions.
To characterize these properties, we define the following two measures:
di sti nct _r ati o(Ai): for a key-based condition on
attri-bute Ai, it is defined as the number of distinct values of Ai
(di sti nct(Ai)) with regard to the number of non-null values
in Ai(non N ull(Ai)), i.e.,
di sti nct _r ati o(Ai)=
di sti nct(Ai)
non N ull(Ai)
(1) shar ed_r ati o(ψ): for reference-based conditions between attributes Aiand Aj, this ratio represents the
num-ber of shared values of attributes Aiand Ajw.r.t. the number
of non-null values in the two attributes, i.e.,
shar ed_r ati o(ψ)= |di sti nct(Ai)∩di sti nct(Aj)|
max(|di sti nct(Ai)|,|di sti nct(Aj)|) (2)
Moreover, categorical attributes (e.g., those containing error codes or currencies) that are not used for correlation can be characterized in the log by the fact the number of val-ues does not vary much with respect to the size of the dataset. Conversely, an attribute used for correlation would have more distinct values as the dataset grows, since the dataset would contain more instances.4Such an attribute exhibits proper-ties similar to categorical attributes. We discuss treating such attributes in Sect.5.2. We use this property to further filter out non-correlator attributes, by comparing their value distri-bution on samples of the dataset of varying sizes. Thus, if the highest number of distinct values for a categorical attribute identified in this approach is denoted by di sti nctmax(Ai),
we use the thresholdαdefined as
α= |di sti nctmax(Ai)|
|L| (3)
and prune key-based conditions with the ratio of distinct val-ues smaller thanα(very small value close to zero). Based on a similar reasoning, we can prune reference-based conditions with shar ed_r ati o(ψ) < α. Finally, key-based conditions with distinct_ratio(Ai) = 1 are also considered
non-inter-esting. This is because using a key-based condition based on such attributes no messages can be correlated with each other. We refer to this criterion as non-Repeati ngV alues criterion.
(B) Conditions partitioning the log into instances with one or two messages, or into very few instances, are not
4 A possible exception for aforementioned properties is attributes whose values are reused periodically (e.g., each day).
interesting: A process instance is a sequence of at least two messages. We expect that there are several instances present in the log. A correlation conditionψis considered not inter-esting if it partitions the log into either very few long instances or into a very high number of short instances (instances with too few messages, e.g., one or two). We define measures on the length and the number of instances to recognize condi-tions leading to such instances. To be able to reason on the number of instances, we define P I _r ati o(ψ)as the ratio of|P Iψ|to the number of messages for which attributes Ai
and Ajof conditionψare defined (i.e., they are not null) as
follows:
P I _r ati o(ψ)= |P Iψ|
non N ull(ψ) (4)
We require that the majority of instances have at least a length of 2 and therefore P I _r ati o(ψ)can be expected to be smaller than or equal to 0.5 (it is 0.5, when all instances are of length 2). We define the thresholdβthat can be set to 0.5 and higher values. We can safely tag correlation conditions that lead to a P I _r ati o> βas non-interesting.
To complement this measure, we define also another mea-sure based on the length of instances for a condition. In fact, if there are many instances of length 1 (isolated messages), then it is not interesting. We can identify such process instance sets by examining the median of the distribution of length of instances and tag as non-interesting those with median equal to 1. Note that for forming instances according to condition
ψ, messages in the log are only considered if their attributes Ai and Aj have non-null values (e.g., forψ1 in Table 2,
only messages of types PO and I nvhave non-null values for the attribute oID, i.e., there are 4 messages having non-null values). The above two measures are complementary, and in some cases for a non-interesting condition, both of them may be satisfied.
On the other hand, we require that there are, at least, 2 instances formed in the log for a given condition. However, in practice, interesting conditions lead to a higher number of instances in the log (proportional to the number of mes-sages in the log). Based on a heuristic observation, we expect that interesting conditions should have a P I _r ati o(ψ) < α. This threshold is small so that allows for a wide range of pro-cess instance sets to be allowed. We also set a complementary measure on the length of non-interesting instances in this cat-egory. In particular, if there is an instance with a length equal to half of the number of messages, which have a non-null value for attributes of conditionψ, then the condition is not interesting. These two measures are also complementary and overlapping, and it is sufficient that one of them qualify for a condition to be considered non-interesting. In the following of this paper, we refer to this criterion as i mbalanced P T criterion.
4.1.2 User input and feedback
The goal of our approach is enabling the discovery of poten-tially interesting process views for a given user. Therefore, we provide the opportunity for the user to provide her input and feedback during various discovery steps regarding the processes they want to analyze. We leverage this informa-tion to guide the correlainforma-tion condiinforma-tions search and enhance the quality by increasing the likelihood of interestingness of the discovered process views for the user. For instance, feed-back on which attributes or services messages are related to the processes that the user is interested in, as well as provid-ing an estimation of the number of instances per day, and the length and/or duration (i.e., time elapsed between the first and last message) of instances could help in directing the search toward process views representing such process instances. For instance, a salesman may know that, on average, 100 orders are filed daily by customers.
In particular, we enable users to specify the following three interdependent criteria: the average number of instances (denoted by avg_num), their average length, or their average duration (denoted by avg_len and avg_dur , respectively). We show how this information, if available, can be used dur-ing the discovery process and also after discoverdur-ing views to effectively navigate through them.
It should be noted that user input and feedback is optional. The tool can run using default settings. These default settings (for the thresholds) favor recall at the expense of precision, meaning that the tool may discover a rather large process map. This is because the user input/feedback is used to to prune subset of the correlation results that she finds irrele-vant or non-interesting. However, the tool provide function-alities for the exploration, navigation, and refinement of the process map. Therefore, users are able to find processes of their interest even if they have not provided input/feedback during the discovery process; only they may spend more time exploring.
4.2 Discovery of correlation conditions
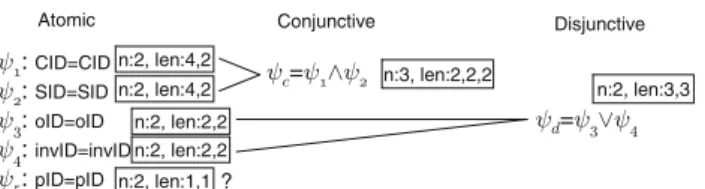
As depicted in Fig. 4, we propose to explore the space of correlation conditions in three steps: first discovering atomic conditions, then conjunctive conditions (formed by apply-ing conjunctive operators on atomic conditions), and finally disjunctive conditions (formed by applying disjunctive oper-ators on atomic and conjunctive conditions). Figure5 illus-trates how these three steps are applied on the logs presented in Table1a (excludingConvIDattribute) and Table2, which correspond to CRM and Retailer views in Fig.3, respectively. In this figure, n is used to denote the number of instances that are the result of applying this condition on the log, and len gives the distribution of length of respective instances. This example is used for illustration throughout this section.
Fig. 5 Condition discovery for Retailer dataset
4.2.1 Discovering atomic conditions
The approach for discovering atomic conditions is depicted in Algorithm1. The algorithm consists of three steps:
(i) Generating candidate atomic conditions (line1). In this step, from the set of attributes inL, we generate the set of possible candidate atomic conditionsψ :mx.Ai =my.Aj,
e.g., mx.CID=my.CID,mx.CID=my.SID, etc.
(ii) Pruning interesting conditions based on non-Repeati ngV alues criterion (lines2to9). In this step, first, key-based conditions are identified and pruned (lines2to5). For this purpose, di sti nct_r ati o(Ai)is computed for all
attributes participating in a key-based condition, and then criterion non-Repeati ngV alues is applied. For example, in Fig.5, conditionψ5is pruned as all of its values are unique,
i.e., we have di sti nct_r ati o(p I D) = 1. Next, non-inter-esting reference-based conditions are identified and pruned (lines6to9). For this purpose, shar ed_r ati o(ψ)is com-puted for attribute pairs participating in reference-based con-ditions and then criterion non-Repeati ngV alues is applied. (iii) Pruning non-interesting conditions based on i mbalanced P I criterion (lines10to16). This step requires the following: (i) computing the set of correlated message pairs (Rψ) for all conditionsψ(line11), (ii) computing the set of instances P Iψ formed by correlated message pairs in Rψ(line12), (iii) applying criterion i mbalanced P I on P Iψ (lines14to16). These sub-steps are explained in the follow-ing.
Computing the set of correlated message pairs for a con-ditionψ (line11). The set of correlated message pairs Rψ can be computed using a standard SQL query (self-join of logL) in which itsWHEREclause applies the conditionψ, e.g.:
SELECT a.id, b.id FROM L a, L b
WHERE a.Ai=b.Aj AND b.id > a.id
Here, it is assumed a message identifier (i d) allows the unique identification of each message, and it is assigned to messages so that they are ordered based on their timestamp. Given that the correlation between messages is undirected, it is enough to look forward from each message (using condi-tionb.id > a.idachieves this). Doing so, we make sure that the relationships between any previous message and the
Algorithm 1 Generation and pruning of atomic conditions
Input: A: the set of attributes Ai∈L,1≤i≤k Output: AC: the set of atomic conditions
1: AC←the set of conditionsψ:mx.Ai=my.Aj
2: for conditionsψii :mx.Ai=my.Aido
3: di sti nct _r ati o(Ai)=non N ulldi sti nct((AAii))
4: end for
5: AC ← AC - {ψii|di sti nct _r ati o(Ai) < α or di sti nct _r ati o(Ai)=1}
6: for conditionsψ:mx.Ai=mx.Aj,i=j do
7: shar ed_r ati o(ψ)= |di sti nct(Ai)∩di sti nct(Aj)|
max(|di sti nct(Ai)|,|di sti nct(Aj)|)
8: end for
9: AC←AC - {ψ|shar ed_r ati o(ψ) < α} 10: for all conditionsψ∈AC do
11: compute Rψ
12: P Iψ←Fi nd I nstances(Rψ,L) 13: end for
14: ifψhas i mbalanced P I (based on P Iψ) then 15: AC←AC− {ψ}
16: end if
current one should have been identified from the previous message. This allows to save memory and reduce the num-ber of tuples needed to represent Rψ.
Computing the set of instances for a conditionψ(line12). Building the set of instances P Iψ from Rψ corresponds, in terms of database query, to a recursive (closure) query over the set of correlated message pairs in Rψ. Indeed, an instance is the transitive closure of binary relationships between messages in Rψ. However, due to limited support in most database engines for recursive queries, we choose to use a memory representation of the correlation graph Gψ (that can be formed using Rψ) to partition it using an existing graph decomposition algorithm [11]. Such an algorithm takes a graph as the input and returns the set of maximal connected components in the graph. This set is equivalent to the set of instances P Iψ, if Gψis the input.
Applying i mbalanced P I criterion (lines14to16). In this step, the thresholdsαandβ on the P I _r ati o(ψ)and also the minimum and maximum length requirements are applied, and conditions that do not qualify are pruned.
4.2.2 Discovering conjunctive conditions
Conjunctive conditionsψ1∧2 are computed using
conjunc-tive operator on atomic conditionsψ1andψ2, i.e.,ψ1∧2 = ψ1∧ψ2. If the set of atomic correlation conditions computed
in the previous step is AC = {ψ1, ψ2, ψ3}, then the set of
possible candidate conjunctive condition is CC = {(ψ1∧ ψ2), (ψ1∧ψ3), (ψ2∧ψ3), (ψ1∧ψ2∧ψ3)}. This
corre-sponds to exploring the set containment lattice of AC. It is possible that some of these combinations, built using more atomic conditions from simpler ones (with fewer atomic conditions), lead to the same set of instances as that of
Algorithm 2 Generation and pruning of conjunctive conditions
Input: AC: the set of atomic conditions
Output: CC: the set of atomic and conjunctive conditions
1: L0←{}; L1←AC 2:←1 3: while L= {}do 4: for conditionψ∈Ldo 5: compute Rψ1∧2←Rψ1∩Rψ2 6: P Iψ←Fi nd I nstances(Rψ,L) 7: end for
8: ifψhas i mbalanced P I (based on P Iψ) or not Mon(ψ1∧2)then 9: L←L− {ψ} 10: end if 11: CC←CC∪L 12: for conditionsψ1, ψ2∈Ldo 13: ψ1∧2←ψ1∧ψ2 14: if de f(ψ1∧2)ornot I nc(Rψ1,Rψ2)then 15: L+1←L+1∪ {ψ1∧2} 16: end if 17: end for 18: ←+1 19: end while
the simpler ones. In such cases, it is enough to find only the minimal conjunctive conditions, which is defined as follows: Definition 13 (Minimal conjuntive condition) A conjunctive condition ψ is minimal if no other conjunctive condition formed using fewer conjunction of atomic conditions parti-tions the log into the same set of instances.
For example, assume that, in the set AC above, the con-junctive conditionsψ1∧2andψ1∧2∧3partition the log in the
same set of instances, thenψ1∧2∧3is not minimal andψ1∧2
is desired as it is easier to compute. Hence, there are two requirements for an automated approach to discover conjunc-tive conditions: (i) efficiently explore the set containment lattice of atomic conditions, by discovering only interest-ing conditions, and (ii) discover only minimal conjunctive conditions. To fulfill these requirements, in the following, we propose an algorithm by adopting a level-wise iterative approach [28]. At each level Li, more complex conjunctive
conditions (i.e., formed using a larger number of atomic con-ditions) are grown from simpler conditions (i.e., formed using fewer atomic conditions) of the previous level Li−1.
The proposed algorithm is depicted in Algorithm2. Each iteration of the algorithm has three phases: (i) applying con-ditionsψ to partition the log into instances (lines4 to7), (ii) candidate condition pruning (lines8to10), and (iii) gen-eration of candidate conditions for the next level (lines12 to17). The algorithm ensures that only minimal conjunctive conditions are discovered, as explained in the following.
(i) Partitioning the log into instances for a conjunctive conditionψ1∧2. For a candidate conjunctive conditionψ1∧2,
the first step is to compute the set of correlated message pairs Rψ1∧2. This is defined as the intersection of the correlated
message pairs ofψ1andψ2as follows:
(mx,my)∈Rψ1∧2⇔(mx,my)∈Rψ1∧(mx,my)∈ Rψ2
⇔(mx,my)∈Rψ1∩Rψ2
This means that messages mx and my have the same
values for attribute pairs inψ1 andψ2. R1∧2 can be
com-puted as an SQL query using theINTERSECToperator over Rψ1and Rψ2. Computation of P Iψ1∧2(L)is done by
find-ing connected components of Gψ1∧2(L), as explained in
Subsect.4.2.1.
(ii) Pruning candidate conjunctive conditions. In this phase, non-interesting conjunctive conditions are identified and pruned based on the following criteria:
(1) Criterion i mbalanced P I (lines 8 to 10 of Algo-rithm 2). The number of instances for ψ1∧2 is necessarily
equal or greater than that of both ψ1 and ψ2 (e.g.,
con-sider conditionψcin Fig.5, where n = 3 and it is greater
than those ofψ1andψ2). We check whether the condition
P I _r ati o(ψ1∧2,L) < βis satisfied (i.e., if the conjunctive
condition is potentially interesting).
If the user knowledge is provided, e.g., any of avg_num, avg_len or avg_dur , we use the following approach to iden-tify non-interesting conditions: if|P Iψ| >avg_num, or if the average length of instances is smaller than avg_len, or if the average duration of the instances is smaller than avg_dur , then it is not interesting to explore further conditions formed by conjunction of this condition and others. This is because more conjunctions result in a higher number of instances of shorter lengths and smaller durations.
(2) Monotonicity of the number and the length of instances with respect to the conjunctive operator: As mentioned before, we expect that the number of instances forψ1∧2is
greater than that of bothψ1andψ2. This also implies that
(most of) instances P Iψ1∧2(L)are of smaller length than
those ofψ1andψ2. Therefore, if the number of instances
does not increase or the lengths of (at least some) instances in P Iψ1∧2(L)do not decrease compared to those of P Iψ1(L)
and P Iψ2(L), thenψ1∧2is not interesting. This is because in
this caseψ1∧2does not create a new interesting process view
with respect toψ1andψ2. The slight change in the number
or the length of instance (since P Iψ1∧2(L)=P Iψ1(L)and
P Iψ1∧2(L)= P Iψ2(L)) can be due to imperfections in the
log. This criterion is referred to as not Mon(ψ1∧2)in line8
of Algorithm2.
Generating candidate conjunctive conditions. In this phase, the set of candidate conditions for the next level are generated (lines12to17). The set of candidate conditions for the next level are formed using non-pruned (selected) corre-lation conditions of the previous level. In fact, if a condition
ψ1is pruned, i.e., it fails to satisfy the interestingness
mea-sures (e.g., the number of instances is too high or instances are too short), then the conjunctive condition built using this