Section 1. Test Construction and Administration
Test Development Planning
Planning for the test development process began with the creation of item development plans for each content area. ETS content leaders collaborated with their content
counterparts at MSDE to create these plans. The item bank was reviewed to determine how well the available item pool matched the test form requirements set forth in the test form blueprint as defined by the Core Learning Goals and the 2007 forms construction templates provided by MSDE. Areas that contained low item counts were given priority when determining which indicators were to be addressed by the item writers. After these critical need areas were defined and addressed, any remaining items to be developed (as determined by the requirements set forth in the RFP) were distributed among the
indicators in a fashion that would best ensure sufficient numbers of items would be available to use in the construction of operational forms for future administrations. Test Specifications and Design
The basic test design was pre-determined by MSDE and provided to ETS in the form of the content specific “Test Specs – Test Form Matrix” document presented in Tables 1.2 to 1.5. This basic test design document provided information based on specified
expectations and the distribution of the number of items by item type for each reporting category. How the specific items were placed throughout the forms was left to the collaborative efforts of the ETS and MSDE content specialists. Construction of the operational forms was based on test blueprints approved by MSDE.
Item Type
As noted in the Introduction, there were four item types that were used in the MDHSA tests. These item types were selected response (SR), student produced response (SPR), brief constructed response (BCR), and extended constructed response (ECR). Table 1.1 shows how these item types and associated points were distributed by content area.
Item Writing
Item writers were employed to develop high quality test items that were aligned with Core Learning Goals. At least 50% of the item writers were Maryland educators, though for most content areas the percentage was closer to 100. The item writers were selected on the basis of their depth of content knowledge and familiarity with the MDHSA testing program. Many were experienced item-writers with the MDHSA program.
The item writers were trained on general item writing techniques as well as writing guidelines that were specific to the MDHSA program. Approximately one month after the initial item writer training, a follow-up training session was provided. The session was designed to evaluate how well their writing skills had developed to that point, to facilitate peer review of items, and to provide constructive feedback to guide the rest of their writing assignment.
Upon completion of their writing assignment, item writers submitted their items to ETS. The items that were accepted proceeded to the item review and revision process. Specific requirements of writing for the MDHSA program can be found in the “Guidelines for Item Writers” document.
Item Review and Revision
All items underwent a series of editorial reviews in accordance with the following procedures:
• Items edited according to standard rules developed in conjunction with MSDE. • Items reviewed for accuracy, organization, comprehension, style, usage,
consistency and fairness/sensitivity.
• Item content reviewed to establish whether the item measured the intended Goal-Expectation-Indicator-Assessment Limit.
• Verification that copyright and/or trademark permissions had been obtained for any materials requiring permissions. For English passages used in 2007, the copyright verification occurred once a passage set was selected for use within a specific field test set.
• Internal reviews conducted and historical records established for all version changes.
After ETS performed the required internal reviews, items were submitted to MSDE for their review. If the MSDE content specialist requested a copy, an original version of the item as submitted by the item writer was provided. Any associated stimulus material, graphic, and/or art was provided as well as information regarding the Goal-Expectation-Indicator-Assessment Limit that each question addressed.
MSDE performed a review of the items and provided feedback to ETS content specialists. The edits were incorporated into the items. MSDE and ETS content
specialists met to conduct a side-by-side review of the items. Any final edits to the items were made. The items were then prepared for review by the Content and Bias/Sensitivity
Review Committees. All constructed response items were also submitted to Measurement Incorporated (MI) for review.
The final round of reviews involved the Content Review and Bias/Fairness Review Committees. These committees were diverse groups of Maryland educators who reviewed each item to ensure that the content in each item: a) accurately reflected what was taught in Maryland schools; b) correctly matched the intended CLG indicator; and c) did not unfairly favor or disadvantage an individual or group.
Upon completion of this final round of review, MSDE and ETS content specialists conducted another side-by-side meeting to evaluate reviews by MI, the Content Review Committee, and the Bias/Fairness Review Committee. The ETS content specialist then made any necessary final edits to the items and/or revisions to the accompanying graphics. The items that survived this process were then eligible for placement in the field test sections of operational forms.
Test Specifications
All of the 2007 operational test forms were constructed using items from the Maryland item bank. The pool of items available for use in the construction of the 2007 forms included all items that had been administered, calibrated and linked to the operational scale. For Algebra, Biology, and Government, the MDHSA operational scale was defined in 2002 and included items administered in 2002 and 2003. For English, the scale was re-defined in 2006 when the English test was updated to become an end-of-course
assessment for English 2. Items flagged for poor fit and items flagged for substantial differential item functioning (DIF) against one of the focal groups were excluded from the available item pool. Please refer to Section 5 for a more detailed account of these analyses and flagging criteria.
Each test form was constructed to meet specific test blueprints. Tables 1.2 to 1.5 indicate the distribution of items within each reporting category by item type and the number of score points associated with each item type. The forms for Algebra, Biology, and
Government consisted of two sessions administered within a single sitting; the forms for English consisted of three sessions administered within a single sitting. Sessions were separated by a short break.
Table 1.2 Algebra Blueprint
ALGEBRA
Reporting Category Number of Items
Total Points per Category SR SPR BCR ECR (1 pt) (1 pt) (3 pts) (4 pts) Expectation 1.1
The student will analyze a wide variety of patterns and functional relationships using the language of mathematics and appropriate
technology 8 1 0 1 13
Expectation 1.2
The student will model and interpret real-world situations, using the language of
mathematics and appropriate technology. 10 3 0 1 17 Expectation 3.1
The student will collect, organize, analyze,
and present data. 4 2 2 0 12
Expectation 3.2
The student will apply the basic concepts of statistics and probability to predict possible
outcomes of real-world situations. 4 0 1 1 11
TOTAL 26 6 3 3 53
Table 1.3 Biology Blueprint
BIOLOGY
Reporting Category Number of Items Total Points per Category
SR BCR ECR
(1 pt) (4 pts) (4 pt) Goal 1
Skills and Processes of Biology 8 2 0 16
Expectation 3.1
Structure and Function of Biological Molecules 8 1 0 12 Expectation 3.2
Structure and Function of Cells and Organisms 9 1 0 13 Expectation 3.3
Inheritance of Traits 9 1 0 13
Expectation 3.4
Mechanism of Evolutionary Change 5 1 0 9
Expectation 3.5
Interdependence of Organisms in the Biosphere 9 1 0 13
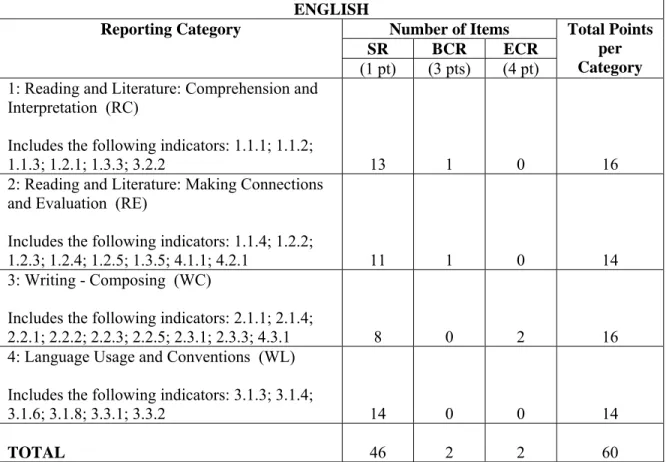
Table 1.4 English Blueprint
ENGLISH
Reporting Category Number of Items Total Points per Category SR BCR ECR
(1 pt) (3 pts) (4 pt) 1: Reading and Literature: Comprehension and
Interpretation (RC)
Includes the following indicators: 1.1.1; 1.1.2;
1.1.3; 1.2.1; 1.3.3; 3.2.2 13 1 0 16
2: Reading and Literature: Making Connections and Evaluation (RE)
Includes the following indicators: 1.1.4; 1.2.2;
1.2.3; 1.2.4; 1.2.5; 1.3.5; 4.1.1; 4.2.1 11 1 0 14 3: Writing - Composing (WC)
Includes the following indicators: 2.1.1; 2.1.4;
2.2.1; 2.2.2; 2.2.3; 2.2.5; 2.3.1; 2.3.3; 4.3.1 8 0 2 16 4: Language Usage and Conventions (WL)
Includes the following indicators: 3.1.3; 3.1.4;
3.1.6; 3.1.8; 3.3.1; 3.3.2 14 0 0 14
TOTAL 46 2 2 60
Note: Information on the referenced indicators can be found in the Maryland Core Learning Goals for English. The HSA Core Learning Goals documents can be found on the Maryland School Improvement website at http://www.mdk12.org/assessments/standards/9-12.html.
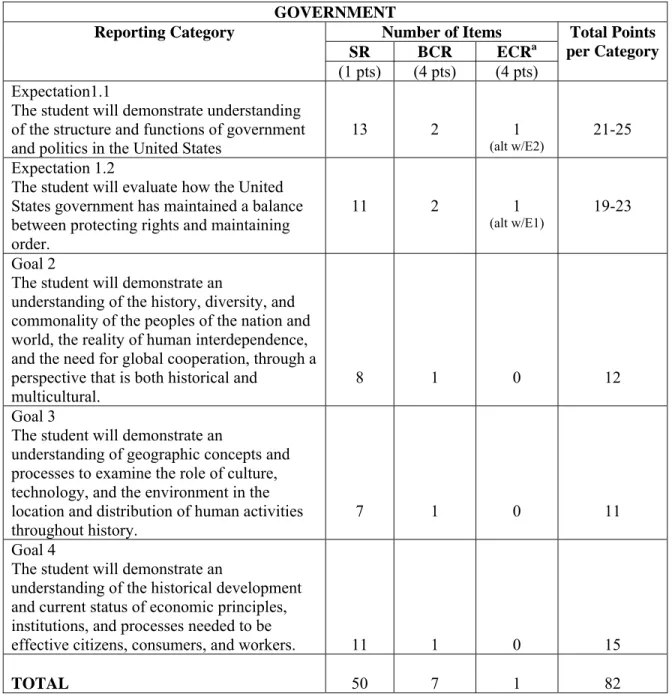
Table 1.5 Government Blueprint
GOVERNMENT
Reporting Category Number of Items Total Points per Category
SR BCR ECRa
(1 pts) (4 pts) (4 pts) Expectation1.1
The student will demonstrate understanding of the structure and functions of government
and politics in the United States 13 2 (alt w/E2) 1 21-25
Expectation 1.2
The student will evaluate how the United States government has maintained a balance between protecting rights and maintaining order.
11 2 1
(alt w/E1)
19-23 Goal 2
The student will demonstrate an
understanding of the history, diversity, and commonality of the peoples of the nation and world, the reality of human interdependence, and the need for global cooperation, through a perspective that is both historical and
multicultural.
8 1 0 12
Goal 3
The student will demonstrate an
understanding of geographic concepts and processes to examine the role of culture, technology, and the environment in the location and distribution of human activities throughout history.
7 1 0 11
Goal 4
The student will demonstrate an
understanding of the historical development and current status of economic principles, institutions, and processes needed to be
effective citizens, consumers, and workers. 11 1 0 15
TOTAL 50 7 1 82
a The ECR item on the Government assessment is aligned to and reported at either Expectation 1 or
Expectation 2. Forms are developed to alternate between the two expectations across an assessment year.
Item Selection and Form Design
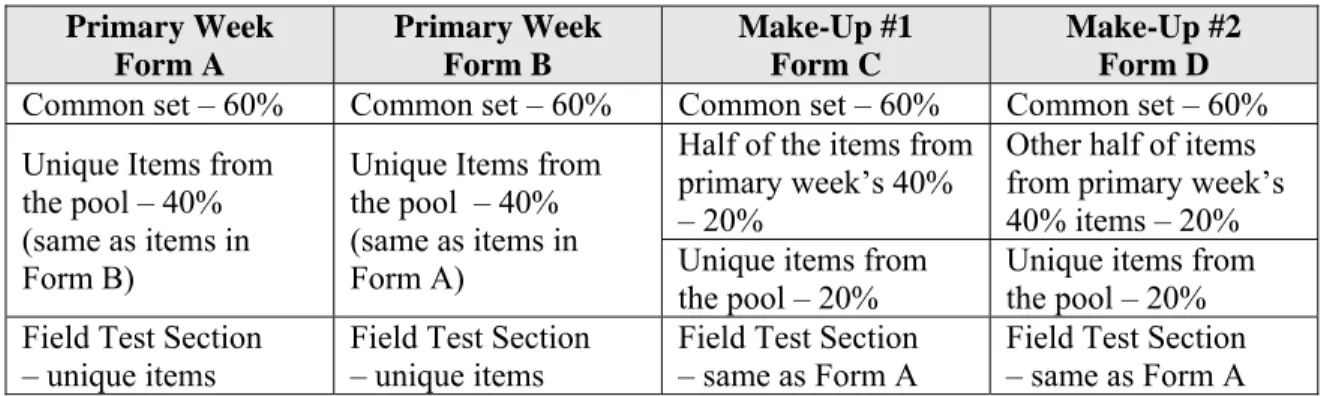
In order to conserve the item pool, each operational set of items consisted of a common set of items shared across forms within an administration and a unique set of items. Within a given administration (i.e., January, May, Summer), approximately 60% of the operational items in each form were common across the operational test sections. The remaining items in the forms consisted of combinations of items that varied across forms.
The guidelines used to construct the forms are provided in Tables 1.6 to 1.8. The exact composition of the forms varied slightly based on available items in the pool.
Table 1.6 Form Construction Specifications for the January 2007 Administration Primary Week Form A Primary Week Form B Make-Up #1 Form C Make-Up #2 Form D
Common set – 60% Common set – 60% Common set – 60% Common set – 60% Unique Items from
the pool – 40% (same as items in Form B)
Unique Items from the pool – 40% (same as items in Form A)
Half of the items from primary week’s 40% – 20%
Other half of items from primary week’s 40% items – 20% Unique items from
the pool – 20%
Unique items from the pool – 20% Field Test Section
– unique items
Field Test Section – unique items
Field Test Section – same as Form A
Field Test Section – same as Form A
Table 1.7 Form Construction Specifications for the May 2007 Administration Primary Week Forms E -K Make-Up #1 Form X Make-Up #2 Form Y
Common Set –60% Common Set –60% Common Set – 60%
Unique Items from the pool – 40%
(the same for Forms E – K)
Half of items from primary week’s 40% items – 20%
Other half of items from primary week’s 40% items – 20%
Unique items from the pool – 20%
Unique items from the pool – 20%
Field Test Section – unique sets of items for Forms E through K
Field Test Section – a reuse of one or a combination of the field test sets used in forms E-K, with a preference for form E; however, the actual selection of field test items was determined by the constraints imposed by the operational items
Field Test Section – a reuse of one or a combination of the field test sets used in forms E-K, with a preference of using the same set used for form X; however, the actual selection of field test items was determined by the constraints imposed by the operational items
Table 1.8 Form Construction Specifications for the Summer 2007Administration Primary Week #1
Form L
Primary Week #2 Form M
Common Set –60% Common Set –60%
Unique Items from the pool – 40% Unique Items from the pool – 40% Field Test Section – items repeated
from May 07 forms
Field Test Section – items repeated from May 07 forms
In addition to the operational items, embedded field test items were included with each version of the test form, resulting in multiple versions of an operational form containing different sets of field test items. The items being field-tested were a combination of newly written items and/or previously administered items that had been revised due to content concerns or problematic item statistics. The items with problematic statistics were judged to be acceptable from a content perspective, but had one or more of the following characteristics: p-values less than 0.25; item-total correlations of less than 0.15; collapsed score levels for constructed response items (i.e., very few responses in the top score levels); very high omit rates; or SR items with one best answer and a positive point-biserial correlation for one or more distractors. For the administration, different versions of the forms were spiraled at the student level.
Forms were constructed using the test construction software associated with the customer item bank. The goal was to match the test characteristic curves (TCC) and the conditional standard error of measurement curves (CSEM) with the “target” form defined as the base form used to set the operational scale in 2002. The TCC and CSEM curves were
graphically displayed using item parameters associated with the operational items. The general steps completed during the test construction process were:
1. For each administration, all operational forms were constructed simultaneously in order to provide the best opportunity to construct parallel forms.
2. First the common set of items was selected. Then items that matched the test blueprint were selected to match the target TCC and CSEM curves.
3. Test developers were careful to ensure that the item selections met all content specifications, including matching items to the test blueprint, distribution of keys, and avoidance of clueing2 or clanging3.
4. After the operational forms were selected, the field test sets were constructed. While the field test sets were not constructed to meet any psychometric criteria, they were constructed to meet content criteria. For Algebra, Biology, and Government, the field test sets were estimated to be completed by students in
2 Clueing refers to information within a passage, stimulus, item, graphic, or other test component that
allows respondents to select/construct the correct answer to one or more items in an assessment without the knowledge and/or skill targeted by the item.
approximately 30 minutes. For English, the field test sets were estimated to be completed by students in approximately 40 minutes due to the additional time required to read the passages and stimuli. Field test sets consisted of SR items in all content areas. In addition, the sets consisted of SPR, BCR, and ECR in Algebra, BCR items in Biology, and either BCR or ECR items in English and Government. The field test items were embedded in the operational test according to a variety of content and template criteria.
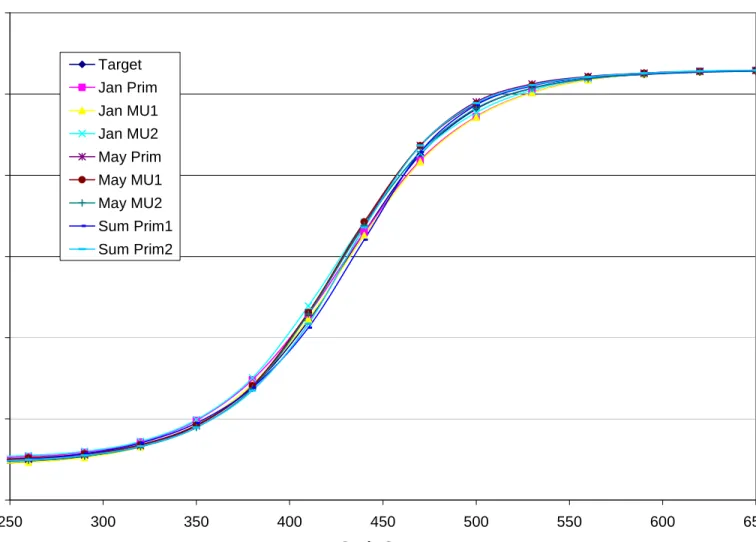
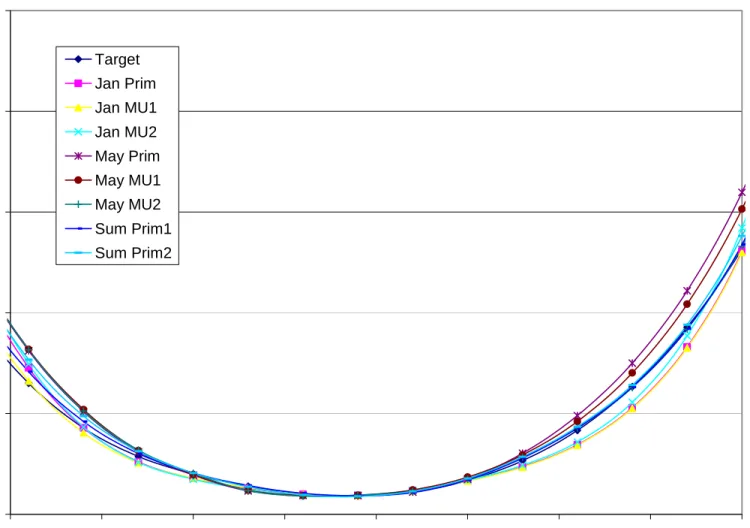
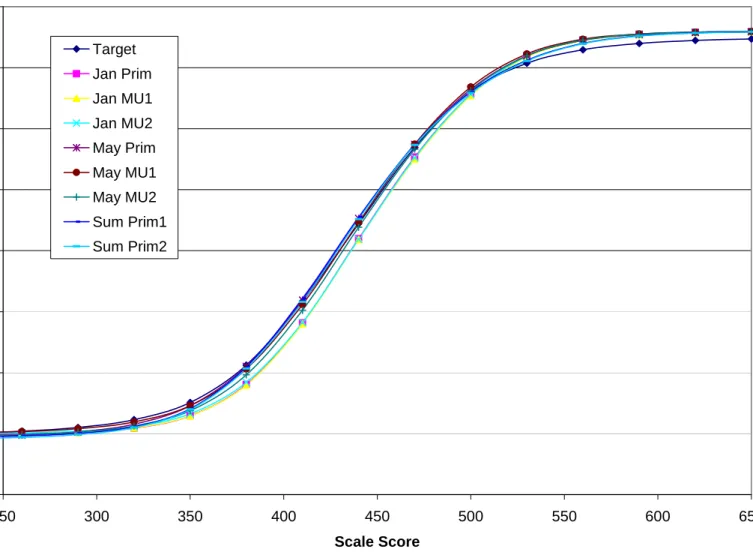
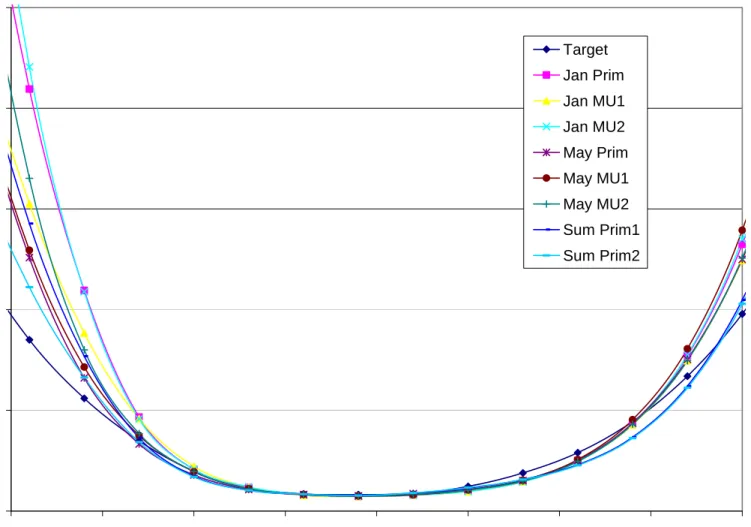
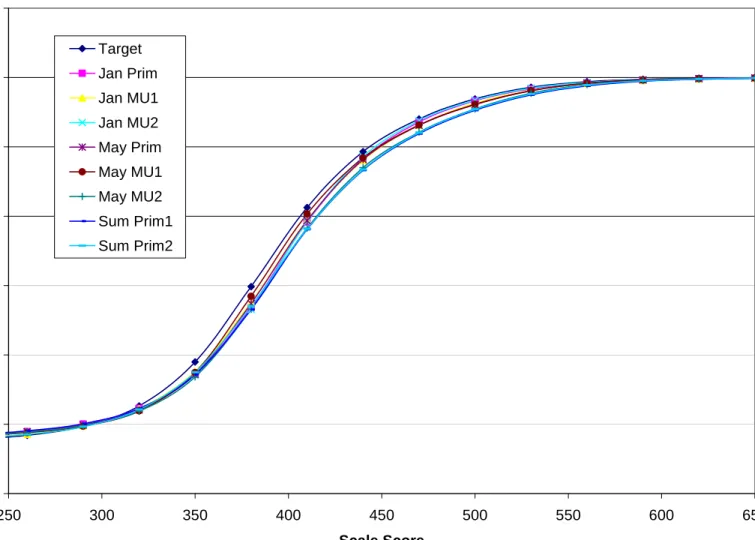
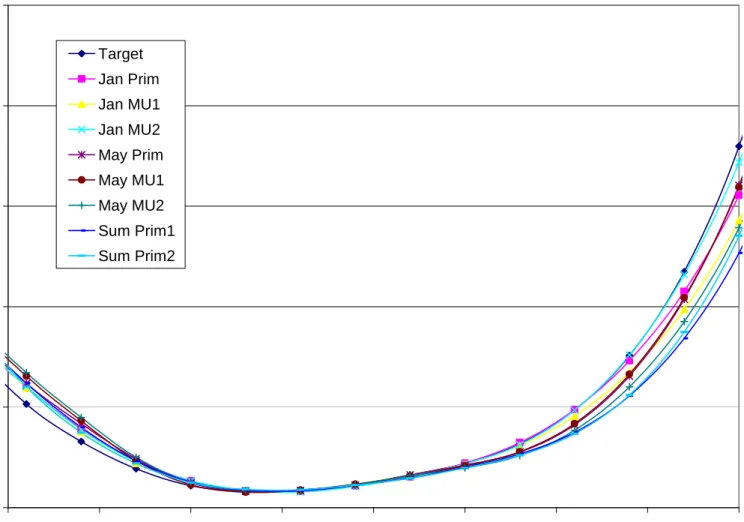
Figures 1.1 to 1.8 show the plots of the TCCs and CSEMs for the target form and forms developed for each content area. In general the TCCs and CSEMs closely matched the target curves. The TCC plots indicate that all forms for each content area were within the acceptable range of the target curve for the full range of scale score values. Where forms varied in difficulty, differences between forms were less than 5% of the total raw score. The CSEM plots indicate that the CSEMs for each content area were lowest within the scale score range of 375 to 475.
Figure 1.1 Test Characteristic Curves for the 2007 Algebra Forms 0 10 20 30 40 50 60 250 300 350 400 450 500 550 600 650 Scale Score Raw S c ore Target Jan Prim Jan MU1 Jan MU2 May Prim May MU1 May MU2 Sum Prim1 Sum Prim2
Figure 1.2 Conditional Standard Error of Measurement for the 2007 Algebra Forms 50 100 150 200 250 CSEM Target Jan Prim Jan MU1 Jan MU2 May Prim May MU1 May MU2 Sum Prim1 Sum Prim2
Figure 1.3 Test Characteristic Curves for the 2007 Biology Forms 0 10 20 30 40 50 60 70 80 250 300 350 400 450 500 550 600 650 Scale Score Raw S c ore Target Jan Prim Jan MU1 Jan MU2 May Prim May MU1 May MU2 Sum Prim1 Sum Prim2
Figure 1.4 Conditional Standard Error of Measurement for the 2007 Biology Forms 50 100 150 200 250 CSEM Target Jan Prim Jan MU1 Jan MU2 May Prim May MU1 May MU2 Sum Prim1 Sum Prim2
Figure 1.5 Test Characteristic Curves for the 2007 English Forms 0 10 20 30 40 50 60 70 250 300 350 400 450 500 550 600 650 Scale Score Raw Score Target Jan Prim Jan MU1 Jan MU2 May Prim May MU1 May MU2 Sum Prim1 Sum Prim2
Figure 1.6 Conditional Standard Error of Measurement for the 2007 English Forms 50 100 150 200 250 CSEM Target Jan Prim Jan MU1 Jan MU2 May Prim May MU1 May MU2 Sum Prim1 Sum Prim2
Figure 1.7 Test Characteristic Curves for the 2007 Government Forms 0 10 20 30 40 50 60 70 80 90 250 300 350 400 450 500 550 600 650 Scale Score Ra w Sc or e Target Jan Prim Jan MU1 Jan MU2 May Prim May MU1 May MU2 Sum Prim1 Sum Prim2
Figure 1.8 Conditional Standard Error of Measurement for the 2007 Government Forms 50 100 150 200 250 C SEM Target Jan Prim Jan MU1 Jan MU2 May Prim May MU1 May MU2 Sum Prim1 Sum Prim2