Humanomics
The Corporate Governance–Risk Taking Nexus: Evidence from Insurance Companies
Journal: International Journal of Ethics and Systems Manuscript ID IJOES-07-2018-0103
Manuscript Type: Research Paper
Keywords: Corporate Governance, Insurance Companies, Risk-Taking, Agency Theory, UK
Humanomics
The Corporate Governance–Risk Taking Nexus: Evidence from
Insurance Companies
Abstract
This study examines the impact of internal corporate governance mechanisms on insurance companies’ risk-taking in the UK context. The study uses a panel data of all listed insurance companies on FTSE 350 over the 2005-2014 period. The results show that the board size and board meetings are significantly and negatively related to risk-taking. In contrast, the results show that board independence and audit committee size are statistically insignificant, but negatively related to risk-taking. The findings are robust to alternative measures and endogeneities. Our findings have important implications for investors, managers, regulators of financial institutions and effectiveness of corporate governance reforms that have been pursued.
Keywords:Agency Theory; Corporate Governance; Insurance Companies; Risk-Taking; UK. 3 4 5 6 7 8 9 10 11 12 13 14 15 16 17 18 19 20 21 22 23 24 25 26 27 28 29 30 31 32 33 34 35 36 37 38 39 40 41 42 43 44 45 46 47 48 49 50 51 52 53 54 55 56 57
Humanomics
1. Introduction
This study examines the impact of internal corporate governance mechanism on risk-taking during the period 2005 to 2014 in UK insurance companies. Insurance companies’ activities are opaque and complex, since they depend on complex assumptions, including mortality rates, upcoming expenses, and interval and discontinuance percentages, in addition to impending investment yields (Adams & Jiang, 2016; Boubakri, 2011). As a result, insurance companies need strong governance, as well as effective accounting and financial reporting standards, to enable proper insights into the company’s financial position. However, the World Bank and IMF highlight corporate governance (CG) as a major defence in the insurance sector (Cheng et al., 2011; Eling & Marek, 2014). In addition, the EU introduced and approved Solvency II in 2009. Solvency II ensures that a firm’s governance and risk management method is acceptable (Boubakri, 2011). We focus on insurance companies because the ownership construction of different insurers offers an interesting setting in which to investigate the effect of CG on insurer’ risk-taking (Cheng et al., 2011; Maffei et al., 2014; Mayers & Smith, 2010). Insurance companies were not protected from the recent crisis, and the turmoil of the American Insurance Group (AIG) was blamed on weak CG, as well as extreme risk-taking. The financial crisis revealed weaknesses in executive compensation, board of directors’ responsibilities and the significance of risk management, leading to an enormous consideration of the different categories of current CG mechanisms that could reduce risk-taking (Adams & Jiang, 2016; Boubakri, 2011; Mokhtar & Mellett, 2013; Nahar, 2004; Laeven & Levine, 2009; Calomiris & Carlson, 2016).
Despite the fact that the insurance sector in the UK is smaller than the UK banking sector, the insurance sector is large with regard to the overall economy. The UK has about 600 insurance firms, whose total investments were estimated to be around £1.9 trillion as at December 2014. This equates to 40% of the assets of UK banks and is equal to the total value of UK GDP. Furthermore, the insurance sector in the UK is one of the world leaders, since it is the third largest insurance market worldwide, and UK insurance firms also gain a third of their revenue from overseas (French, Vital & Minot, 2015; Adams & Jiang, 2016). Insurance firms also play a great role in stabilising the financial system of the economy. Although insurance firms were to some extent more successful in facing the financial crisis than several other sectors, strong governance and high standards of accounting and financial reporting are essential to enabling an open and robust financial system, which can assist and support the economy’s needs. By enhancing CG, insurers can safeguard their companies and individuals 3 4 5 6 7 8 9 10 11 12 13 14 15 16 17 18 19 20 21 22 23 24 25 26 27 28 29 30 31 32 33 34 35 36 37 38 39 40 41 42 43 44 45 46 47 48 49 50 51 52 53 54 55 56 57
Humanomics
from risks and increase the economy’s resilience (Adams & Jiang, 2016; Afrifa & Tauringana, 2015; Boubakri, 2011). Overall, these major roles performed by the insurance sector in the UK are accompanied by many governance reforms, and statutory modifications that challenge its business models (Elmagrhi et al., 2016, 2017), and these factors have motivated this study.
Debatably, there have been substantial improvements to the UK CG Code nearly every year. The latest worldwide financial crisis places greater emphasis on the need for effective CG structures and systems towards ensuring a firm’s continued existence. Accordingly, the UK CG Codes of 2010, 2012, 2014, 2016 and 2018 (forthcoming) have clarified the role of the board of directors in adding value to the firm. The FRC (2012) indicated that an active board should work towards increasing and improving the firm’s values, behaviours and culture. The latest UK CG Code, launched in October 2016, is based on the ‘comply or explain’ approach (FRC, 2014). It aims to simplify effective, innovative and prudent management to achieve long-term growth for companies (FRC, 2014). Given the significance of CG, some may assume that the sound risk-taking of insurance companies is connected to sound CG. However, as a result of the complexity and opacity of such companies, this does not directly answer the question of which components of CG will increase (or shrink) risk-taking.
Thus, this study contributes to current research by analysing the effects of insurers’ corporate governance environment on their risk-taking behaviour in the UK context, especially after the introduction of Solvency II and CG reforms. A considerable quantity of literature has been published on CG and risk-taking, but empirical evidence for the insurance sector, especially in the UK context, remains limited. Therefore, this study will shed light on CG practices and their impact on UK insurance companies’ risk-taking. Specifically, the study contributes to the existing literature by providing evidence on the effect of board structures, such as audit committee, board independence and board size, on risk-taking.
The remainder of the study is structured as follows. Section 2 3 presents the theoretical framework. Section 3 reviews the literature on CG and risk-taking. Section 4 outlines the research design. Section 5 reports and discusses the empirical results. Section 6 concludes.
2. Theoretical framework
CG in insurance companies differs from that of non-financial companies because of the complexity and size of insurers, as well as the wide range of stakeholders (e.g., shareholders, 3 4 5 6 7 8 9 10 11 12 13 14 15 16 17 18 19 20 21 22 23 24 25 26 27 28 29 30 31 32 33 34 35 36 37 38 39 40 41 42 43 44 45 46 47 48 49 50 51 52 53 54 55 56 57
Humanomics
customers, employees, regulators and tax authorities) (Adams & Jiang, 2016; Bhimani, 2009). Additionally, it can be argued that financial authorities, the government, investors and academics tend to worry about a firm’s performance if directors become self-interested instead of creating value for shareholders (Pass, 2008). Agency theory expects that strong CG systems have a controlling role over directors’ behaviour, particularly if the board of directors is large, and if its members assign appropriate time for the companies that they are independent directors of (Adams & Jiang, 2016; Boubakri, 2011; Fama & Jensen, 1985). Agency theory suggests that strong CG mechanisms offer regular controls that ensure dependable and true performance; and therefore, strong CG systems can increase value to agents by periodically confirming and appraising insurance companies’ management plans and strategies (Bhimani, 2009; Jensen & Meckling, 1976). To decrease unprincipled managerial performance and diminish agency charges, agency theory suggests that a large board of directors, appropriate time for control, the presence of independent members and the existence of an audit committee can all enhance the monitoring and, consequently, performance of a firm and contribute to stockholder wealth (Adams & Jiang, 2016; Hardwick et al., 2011; Hines et al., 2015). Eisenhardt (1989) argues that managers have different interests and goals compared to shareholders with regard to profit maximization. Even if their goals are not different, managers and shareholders may have differing opportunistic behaviour. As a result, with the aim of protecting shareholders’ interests, it is necessary for an appropriate and a suitable CG structure to be recognised (Haniffa & Hudaib, 2006).
The purpose of CG mechanisms, therefore, is to moderate agency problems and confirm that managers’ performance is in line with shareholders’ interests (e.g., Nahar et al., 2016; Rashid & Islam, 2014). The Cadbury Code in the UK recommends a set of significant methods for bringing the actions of managers into line with shareholders’ interests. These include, for example, improving the responsibility and transparency of companies. The active construction of CG codes for the UK was designed to support the involvement of non-executive directors and encourage audit committees to embrace their responsibilities because of their outside knowledge and skills (Fama & Jensen, 1983). Similarly, agency theory argues that the board of directors has a monitoring function; it is able to provide active observation of executive directors and to launch strategies which will accordingly be capable of benefitting the shareholders. Therefore, a board is regarded as a key tool which can indicate the success of a firm. Hence, CG best practices are organised to safeguard the boards’ actions and tasks from any unregulated influence, and to consequently decrease 3 4 5 6 7 8 9 10 11 12 13 14 15 16 17 18 19 20 21 22 23 24 25 26 27 28 29 30 31 32 33 34 35 36 37 38 39 40 41 42 43 44 45 46 47 48 49 50 51 52 53 54 55 56 57
Humanomics
agency costs associated with these tasks by reducing information asymmetry (Spira & Page, 2003).
3. Empirical literature and hypotheses development
Regardless of the large number of previous studies on various aspects of CG, evidence about the connection between CG and risk-taking is rare. In the next sections, this study will evaluate the previous empirical and theoretical literature regarding relationship between CG structures and risk-taking in order to clarify the gap in knowledge regarding this connection and develop a number of hypotheses.
3.1Board size and risk-taking
Board size plays a major role in the relationship between CG and risk-taking (Adams & Jiang, 2016; Bozec & Dia, 2017). Adams and Jiang (2016) argue that having a stronger board of directors can have a moderating role on managerial behaviour if the board of directors is large, especially where they consist of highly qualified and knowledgeable members. Therefore, a strong board of directors can increase value to agents by periodically reviewing and appraising insurance companies’ management plans and strategies (Bhimani, 2009; Jensen & Meckling, 1976; Laas & Siegel, 2013). However, some previous studies have argued that a large board may lead to delays in decision-making, as well as conflicts and time-wasting for the board (Fama & Jensen, 1985; Jensen, 2001). In particular, Fama and Jensen (1983) propose that the board of directors should accept responsibility for monitoring management choices and performance, as well as agency problems between managers and stockholders. Cadbury (2002) claims that the most effective board size is between six and eight members, not including the chairman. However, Pathan and Faff (2013) have a different viewpoint; they suggest that a large board may face many problems, including poor communication and co-ordination, and thus impact negatively on their ability to monitor managers.
Previous empirical studies have examined the relationship between board size and risk taking, although they have in the main yielded mixed results. For example, Adams and Jiang (2016) explore the impact of board structure on insurance companies’ risk-taking by selecting 92 insurance firms in the UK, and presenting 1,168 observations over 13 years from 1999– 2012. The study finds a positive relationship between board size and risk taking. The positive relationship implies that larger boards with qualified and knowledgeable members have an enhanced moderating effect on managerial behaviour and decisions. Conversely, in a study of 3 4 5 6 7 8 9 10 11 12 13 14 15 16 17 18 19 20 21 22 23 24 25 26 27 28 29 30 31 32 33 34 35 36 37 38 39 40 41 42 43 44 45 46 47 48 49 50 51 52 53 54 55 56 57
Humanomics
the performance of Bahraini insurance companies by Najjar (2012) over the 2005-2010 period, they reported statistically insignificant relationship between board size and risk-taking. Additionally, Brick and Chidambaran (2010) examined the relationship between board size and risk-taking based on yearly observations of 5,228 firms in the USA during the 1999–2005 period. The regression results indicate that there is no significant negative relationship between board size and risk-taking. Consequently, based on the above discussion, the first hypothesis for this study is:
H1: There is a negative relationship between board size and risk-taking. 3.2Board meetings and risk-taking
The number of board meetings can affect a board’s effectiveness (Vafeas, 1999), particularly when directors discuss the firms’ difficulties and improve procedures and plans for the forthcoming year during board meetings, in addition to making strategic decisions (Barros et al., 2013). Theoretically, the frequency of board meetings can signify the extent of a board’s accomplishments and the quality of its monitoring in detecting managers’ misbehaviour, for instance risk-taking (Vefeas, 1999; Conger et al., 1998). Thus, it may be expected that increasing the number of board meetings will give rise to greater managerial monitoring by offering board members more opportunities to discuss corporate strategy and risks, which may ultimately influence a firm’s performance positively (Vafeas 1999). On the other hand, increased board meeting frequency may not be necessarily useful to shareholders. Specifically, Vefeas (1999) argues that most board meetings are spent on routine tasks. For example, board meetings and management report presentations, which affect the extent and effectiveness of managerial monitoring are often costly to organise in terms of time, meetings fees, allowances and other expenses. Accordingly, Jensen (1993) recommends that the firm’s operating context should be considered when determining board meeting frequency. From this discussion, the second hypothesis of the study is:
H2: There is a negative relationship between board meetings and risk-taking. 3.3Board independence and risk-taking
Independent directors, with improved qualifications and competence, signals to stakeholders that firm’s risk-taking properly reflects management choices, and that this performance is a trustworthy source for making investment judgments (Clarke, 2007). In contrast, organisations which are weak in terms of independent directors are likely to raise investors’ doubts and result in more agency costs, and hence, reduce performance (Connelly 3 4 5 6 7 8 9 10 11 12 13 14 15 16 17 18 19 20 21 22 23 24 25 26 27 28 29 30 31 32 33 34 35 36 37 38 39 40 41 42 43 44 45 46 47 48 49 50 51 52 53 54 55 56 57
Humanomics
et al., 2011; Core, 2000; Tanda, 2015). Hence, agency theory highlights the importance of independent directors to mitigate the effects of various inconsistent interests (Adams & Jiang, 2016; Li & Wearing, 2012; Solomon, 2010; Vafeas & Theodorou, 1998). More specifically, independent directors safeguard the interests of shareholders by employing CG principles (Bhagat & Jefferris, 2002). However, some scholars argue that boards consisting of a majority of independent directors may influence firms’ performance negatively (Baysinger & Hookisson, 1990; Weir & Laing, 2000). Weir and Laing (2000) argue that independent directors often have less knowledge about the company and have limited time to offer in terms of monitoring managers, as well as difficulties in understanding the firm’s complexities. Based on the above, the third hypothesis of this study is:
H3: There is a positive relationship between board independence and risk-taking. 3.4Audit committee size and risk-taking
Previous literature suggests that the establishment of an audit committee in a specific company is an indication of increased board effectiveness and efficiency (Adams & Jiang, 2016). Agency theory assumes that a strong audit committee with regular meetings of qualified and knowledgeable members can have a controlling role over directors’ behaviour (Jermias & Gani, 2014). This can increase value to agents by periodically evaluating and appraising insurance companies’ management plans and strategies (Adams & Jiang, 2016; Jensen & Meckling, 1976). Furthermore, agency theory suggests that an improved and strong audit committee can assist organisations to distinguish themselves from others through enhanced risk-taking behaviour (Connelly et al., 2011). Previous studies provide inconsistent results. For example, Jermias and Gani (2014) find a significant negative relationship between audit committee and risk-taking. On the other hand, Adams and Jiang (2016) find no significant relationship between audit committee and risk-taking. Hsu and Petchsakulwong (2010) show a significant negative relationship between audit committee and risk-taking. Accordingly, the final hypothesis is:
H4: There is a positive relationship between audit committee size and risk-taking. 3 4 5 6 7 8 9 10 11 12 13 14 15 16 17 18 19 20 21 22 23 24 25 26 27 28 29 30 31 32 33 34 35 36 37 38 39 40 41 42 43 44 45 46 47 48 49 50 51 52 53 54 55 56 57
Humanomics
4. Research design
4.1Sample and data considerations
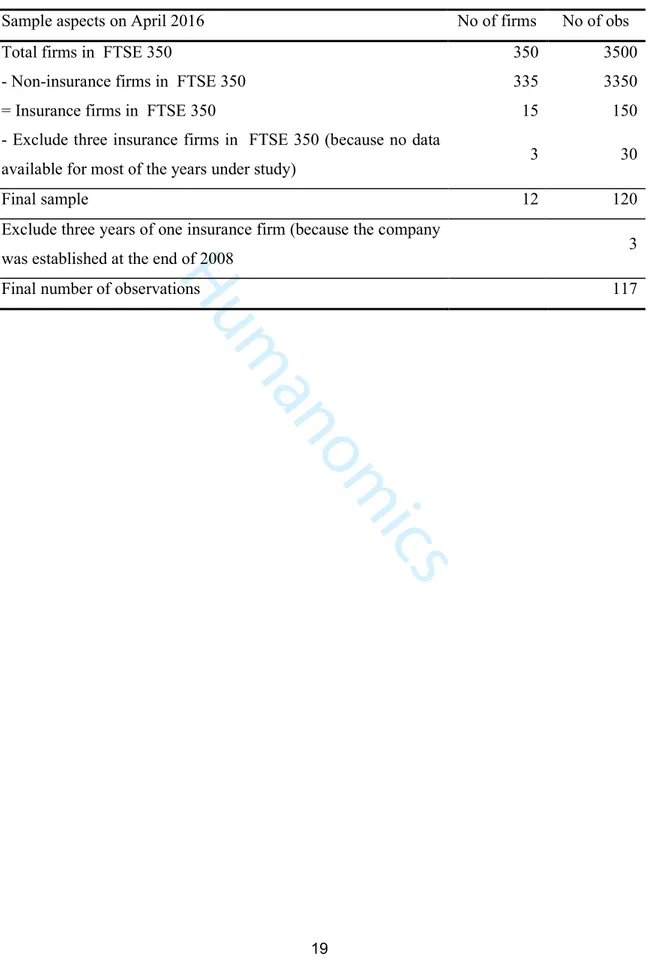
The sample is the FTSE 350 insurance firms registered on the LSE as at April 2016. The FTSE 350 registered insurance firms have been selected as a sampling population for a number of reasons. Firstly, the UK insurance sector is the third biggest insurance sector in the world and the biggest in the whole of Europe (PWC, 2010). Secondly, the Royal Bank of Scotland faced a huge scandal during the financial crisis, which impaired its insurance subsidiary unit as result of weaknesses in CG (Adams & Jiang, 2016; Ho, Lai & Lee, 2013; Yeoh, 2010). Finally, this study uses all listed insurance companies. Table 1 presents the steps followed towards selecting the final sample of UK insurance companies.
INSERT TABLE 1 ABOUT HERE
4.2Definition of variables and model specification
This study examines the influence of internal corporate governance mechanisms (CG), including board size, board meetings, board independence and audit committee on insurance firms’ risk-taking (IRT) within the UK context. To achieve this aim, this study has collected data from two main sources. Firstly, all financial ratios and details regarding firm size were collected from the FAME database. Secondly, the corporate governance variables were collected from the companies’ annual reports, which were obtained from the companies’ websites. This study measures insurance firms’ risk-taking by calculating the Z -score, which is the most frequently used ratio in prior studies (e.g., Boyd and Runkle, 1993; Fu et al., 2014; Gonzáleza et al., 2017; Laeven and Levine, 2009). Using return on assets and return on equity; the Z-score (RT1) is measured as follows:
=
+
(1) While the Z-score (RT2) is measured as follows:
= + (2) 3 4 5 6 7 8 9 10 11 12 13 14 15 16 17 18 19 20 21 22 23 24 25 26 27 28 29 30 31 32 33 34 35 36 37 38 39 40 41 42 43 44 45 46 47 48 49 50 51 52 53 54 55 56 57
Humanomics
where ROA is the insurance firm return on assets, ROE is the insurance firm return On equity,
is the ratio of total equity to total assets, and is the insurance firm return on assets standard deviation. The Z-score is positively related to insurance firm stability and inversely related to risk taking. An insurance firm becomes “insolvent when its asset value drops below its debt and the Z-score shows the number of standard deviations that a firm’s return has to fall below its expected value that can deplete equity and make the bank insolvent” (Fu et al., 2014, p68)
To examine the influence of internal corporate governance mechanisms (CGMs), we gather data on risk-taking. For instance, risk-taking using ROA (RT1) and/or risk-taking using return on equity (RT2) are used as a proxy for risk taking. Internal corporate governance mechanisms (CGMs) variables include board size (ICBS), board of directors’ meetings (ICBM), board independence (ICNEDs), and audit committee size (ICACS). Control variables include insurance firm’s size (ICTA), and liquidity (ICL). Thus, to examine the influence of CG on IRT, this study uses OLS regression as follows:
it i i i i i i
it ICBS ICBM ICNEDs ICACS ICTA ICL YEARS
RT =α0 +β +β +β +β +β +β + +ε (3)
Where RT is used as a proxy for risk-taking. ICBS refers to board size, ICBM refers to board of directors’ meetings, ICNEDs refers to board independence, ICACS refers to audit committee size, ICTA refers to insurance firm’s size, ICL refers to liquidity, YEARS refers to dummies variables for each year from 2005 to 2014, and Ɛ refers to random error. α0is the intercept, andβiare the vectors of coefficient estimates. Table 2 summarizes the definition of variables.
INSERT TABLE 2 ABOUT HERE
5. Findings and discussion
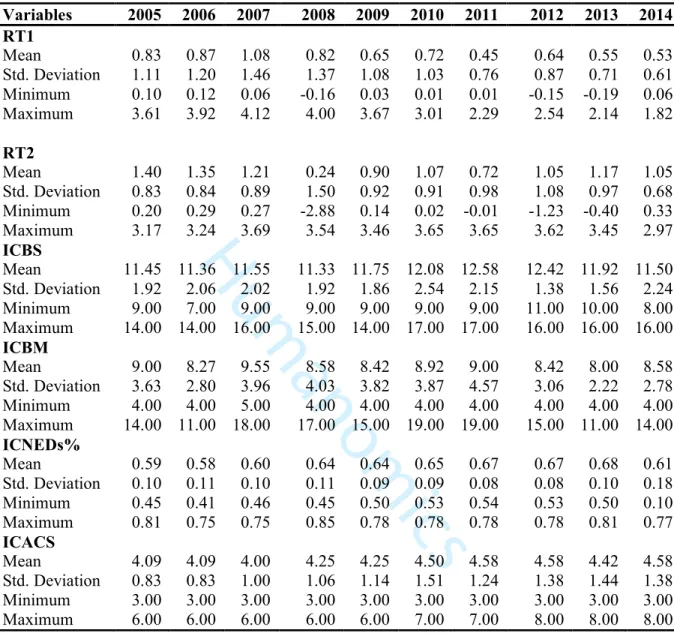
5.1Descriptive, univariate and bivariate analyses
Table 3 shows a summary of the descriptive statistics of the dependent and independent variables for each separate year over a ten year period from 2005 to 2014, with 117 firm-year observations. Table 3 shows that the average Z-score of the UK insurance companies 3 4 5 6 7 8 9 10 11 12 13 14 15 16 17 18 19 20 21 22 23 24 25 26 27 28 29 30 31 32 33 34 35 36 37 38 39 40 41 42 43 44 45 46 47 48 49 50 51 52 53 54 55 56 57
Humanomics
decreased from 2008 onwards. For example, insurance company Z-score measured by return on assets (RT1) decreased from 1.08 percent in 2007 to an average of 0.82 percent in 2008. This implies that financial stability decreased and risk-taking increased during this period.
Table 3 also reports the same pattern regarding insurance company risk-taking measured by return on equity (RT2). This result implies that the financial crisis that happened in 2007 affected the UK insurance sector.
INSERT TABLE 3 ABOUT HERE
With regard to internal corporate governance mechanisms, Table 3 reports that for the size of the insurance companies’ board of directors, on average, the mean board size ranged from 11.33 to 12.58 members, which indicates that it was not affected by the 2007 crisis, apart from a slight increase in 2009. In addition, it can be noted that other internal corporate governance mechanisms, such as insurance company board meetings, insurance company board independence, and insurance company audit committee size follow the same pattern. For instance, the mean number of board meetings ranged from 8.00 to 9.55. Generally, the average number of board meetings was 8.50 over the ten years, with a slight increase to 9.55 in 2007 due to the financial crisis. Similarly, the mean size of audit committee ranged from 4.00 to 4.58 members; however, it can be noticed that the minimum mean during the ten years occurred in 2007. This could have been one of the reasons for the increase in risk-taking during that year; the observable decrease in audit committee size may reflect the monitoring level of those companies.
INSERT TABLE 4 ABOUT HERE
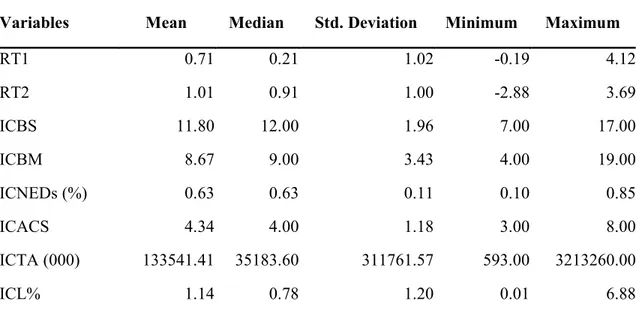
Table 4 reports the descriptive statistics for all variables included in the analysis. The mean value of RT1 for the sample of UK insurers is 0.71. With respect to board size, the average board size was about 12 members (mean = 11.80), which is similar to a study carried out by Jermias and Gani (2014).Regarding board independence (ICNEDs), it can be seen that the mean value is 0.63 and ranges from 0.10 to 0.85 percent. These findings are consistent with Adams and Jiang (2016).
INSERT TABLE 5 ABOUT HERE
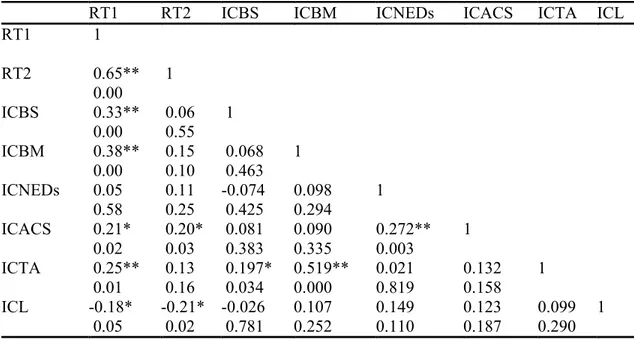
The Pearson parametric correlation has been used to explore the trend and significance of relationships between each two variables. Table 5 shows the Pearson correlation matrix. Notably, all correlation coefficients are below 0.65. This indicates that no series 3 4 5 6 7 8 9 10 11 12 13 14 15 16 17 18 19 20 21 22 23 24 25 26 27 28 29 30 31 32 33 34 35 36 37 38 39 40 41 42 43 44 45 46 47 48 49 50 51 52 53 54 55 56 57
Humanomics
multicollinearity are exist (Gujarati & Porter, 2009; Pallant, 2013). Table 5 shows that RT1 is correlated positively and significantly with ICBS and ICBM. It can also be noted from Table 5 that there is a negative relationship between control variable ICL and RT. Table 5 also shows that the relationships between RT2 and independent variables ICBS, ICFM, ICNEDs
and ICACS are correlated positively.
5.2Regression analyses
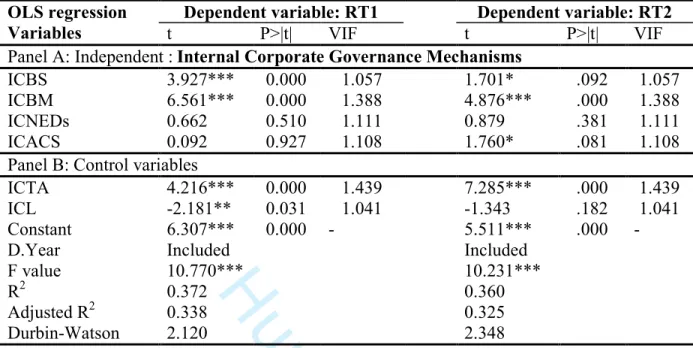
OLS regression has been used to examine the impact of internal CG mechanisms including board size of directors, number of board meetings, board independence and audit committee size on risk-taking calculated by RT1 and RT2. The first hypothesis examines the relationship between board size and insurance company risk-taking. Table 6 shows that there is a positive and statistically significant relationship between insurance company board size (ICBS) and Z-score. In other words, the results indicate that there is a significant positive relationship between ICBS and the Z-score of UK insurance companies. This relationship suggests that bigger boards are associated with lower risk-taking than smaller boards. This is consistent with prior literature (e.g., Jermias & Gani, 2014; Brick & Chidambaran, 2010). For instance, the findings of Jermias and Gani (2014) also found a negative relationship between board size and risk-taking. The relationship between board size and risk-taking is, moreover, consistent with the view that due to greater expertise, a bigger board size offers extra effort in monitoring management (Cheng, 2008) compared with a smaller board size. Hence, based on this evidence, the first hypothesis is accepted, which indicates that larger boards are more effective in constraining managerial risk-taking.
The second hypothesis examines the relationship between the frequency of directors’ board meetings and insurance company risk-taking. Table 6 shows there is a positive and statistically significant relationship between insurance company board meetings (ICBM) and insurance company Z-score measured by ROA and ROE (t of 6.561, t of 4.876, respectively). This implies that board meetings are positively related to financial stability measured by Z -score. In other words, the results show a significant negative relationship between ICBM and the risk-taking of UK insurance companies. This negative relationship suggests that an increased number of board meetings is associated with lower risk-taking than for boards that meet less frequently. This result is consistent with the findings of Priya and Nimalathasan (2013), who also found a negative relationship between board meetings and risk taking. By contrast, this result is inconsistent with the findings of Jermias and Gani (2014) and Hsu and 3 4 5 6 7 8 9 10 11 12 13 14 15 16 17 18 19 20 21 22 23 24 25 26 27 28 29 30 31 32 33 34 35 36 37 38 39 40 41 42 43 44 45 46 47 48 49 50 51 52 53 54 55 56 57
Humanomics
Petchsakulwong (2010), who document a statistically significant and positive relationship between board meetings and risk taking. Based on the evidence of this study, the second hypothesis is accepted, which indicates that increased number of board meetings is more effective.
The third hypothesis examines the relationship between board independence and risk taking. Table 6 shows there is a positive but statistically insignificant relationship between insurance company board independence (ICNEDs) and Z-score. Hence, based on this evidence, the third hypothesis is not supported. These results are consistent with previous literature from Vafeas and Theodorou (1998), Tornyeva and Wereko (2012), and Boyer and Stern (2012). For example, Vafeas and Theodorou (1998) explored the association between board structure and the risk-taking of UK firms. Based on 250 firms in 1994, they found a positive but insignificant relationship between ICNEDs and risk taking.
The fourth hypothesis examines the relationship between audit committee size (ICACS) and risk taking. Table 6 shows there is a negative relationship between the size of insurance companies’ audit committees (ICACS) and risk taking, however such relationship is not significant. Hence, based on this evidence, the fourth hypothesis is not accepted, which indicates that insurance company audit committee size (ICACS) not affect risk-taking. This result is also consistent with previous literature from Adams and Jiang (2016), Hardwick et al. (2011), Tornyeva and Wereko (2012), and Vefeas and Theodorou (1998). For example, Hardwick et al. (2011) explored the impact of CG on insurance companies’ efficiency performance in 744 UK insurance companies from 1994 to 2004 and found a positive though insignificant relationship between audit committee size and risk taking. Similarly, Adams and Jiang (2016) explored the impact of board structure on insurance companies’ performance in 1168 UK companies over 13 years from 1999–2012 and also found a positive but insignificant relationship between audit committee and risk taking. Finally, regarding the control variables, Table 6 shows there is a positive and statistically significant relationship between insurance company size (ICTA) and Z-score. This result is inconsistent with prior research. For example, Jermias and Gani (2014) examined the impact of firm size on insurance companies’ risk-taking by collecting data from 1332 USA insurance companies over seven years from 1997 to 2004. They found a negative relationship between firm size and risk taking. Table 6 shows a negative and statistically significant relationship between insurance company liquidity (ICL) and risk taking. Thus, this indicates that an increase of liquidity value leads to a decrease of risk-taking for insurance companies.
3 4 5 6 7 8 9 10 11 12 13 14 15 16 17 18 19 20 21 22 23 24 25 26 27 28 29 30 31 32 33 34 35 36 37 38 39 40 41 42 43 44 45 46 47 48 49 50 51 52 53 54 55 56 57
Humanomics
5.3Additional analyses
We carried out a number of further analyses to confirm the robustness of our findings. First, to test for the existence of any possible endogeneity, which has been argued to be a widespread problem in CG studies (Larcker & Rusticus, 2010), this study uses fixed effect regression model. Therefore, the model to be assessed is identified as:
it it i i i i i i
it=α0 + β ICBS + β ICBM + β ICNEDs +β ICACS +β ICTA +β ICL +δ +ε
RT (4)
where, everything remains unaffected as identified in equations (1& 2) except that, we use
δ
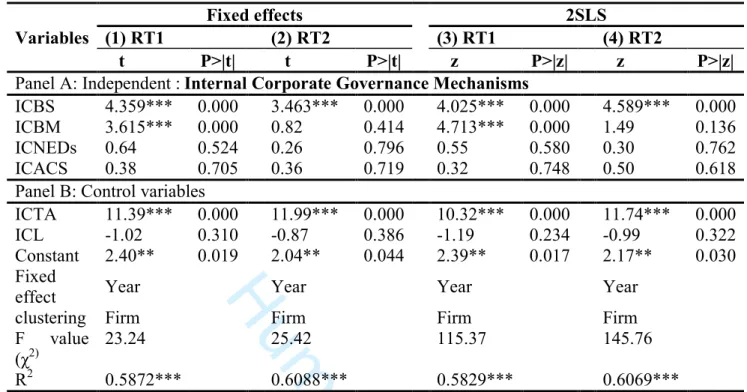
to refer to fixed effect. The results for Models 1 and 2 are reported in Table 7. These results are mostly similar to those reported in Table 6, suggesting that our findings are robust to possible endogeneity problems that may arise from omitted factors.INSERT TABLE 7 ABOUT HERE
This study further implemented the 2SLS (two-stage-least-squares random-effects within estimator) to fitting panel data model (Baltagi & Deng, 2015). The results for Models 3 and 4 are reported in Table 7 are mostly similar to those reported in Table 6, suggesting that our results are robust to possible endogeneity problems. The minor increase in some coefficients’ value of CG variables in Models 3 and 4 of Table 7 compared with those of Tables 6 are in line with previous studies which indicate that instrumented variables of CG variables are likely to predict risk-taking more powerfully than their un-instrumented variables (Larcker & Rusticus, 2010). This examination reinforces the need for CG reforms for financial firms, especially in the insurance industry.
6. Conclusion
This study examines the impact of internal corporate governance mechanisms on insurance companies’ risk-taking during the period 2005 to 2014 in the UK. The results show a negative and statistically significant relationship among insurance company board size, frequency of board meetings and insurance company risk taking. The result is consistent with those of prior literature (e.g., Jermias & Gani, 2014; Brick & Chidambaran, 2010; Boyer & Stern, 2012). This study has contributed to existing research by investigating the relationship 3 4 5 6 7 8 9 10 11 12 13 14 15 16 17 18 19 20 21 22 23 24 25 26 27 28 29 30 31 32 33 34 35 36 37 38 39 40 41 42 43 44 45 46 47 48 49 50 51 52 53 54 55 56 57
Humanomics
between corporate governance mechanisms and insurance companies’ risk-taking, which has rarely been addressed by previous studies. In addition, the research has been undertaken in the UK setting, where despite having one of the largest insurance markets in the world, but has rarely been examined by past researchers. Despite the contributions presented above, this research has potential limitations that should be taken into consideration. The first possible limitation is associated with the sample. This research depends only on insurance companies listed in the 350 FTSE index.
Similarly, the results suggest that there is a negative relationship between corporate governance mechanisms (i.e., insurance company board size, insurance company board meetings, insurance company board independence and audit committee size) and risk-taking. Thus, this study suggests that corporate governance mechanisms reduce risk-taking by reducing Z-score measured by ROA and ROE. This study offers new possibilities for future research in a number of ways. First, future research may study or compare insurance companies’ risk-taking in UK listed firms with those of other markets like the USA, Germany and China. In addition, it could be beneficial if future research were to take a sample from the European Union in order to determine what the factors that affect risk-taking are. Another avenue for future research would be to use other and broader measures for risk-taking. Also, examination of other corporate governance mechanisms is recommended (e.g., remuneration committee, risk committee and ownership concentration). Finally, despite the importance of secondary data, the utilisation of primary data, such as interviews may enrich future research. 3 4 5 6 7 8 9 10 11 12 13 14 15 16 17 18 19 20 21 22 23 24 25 26 27 28 29 30 31 32 33 34 35 36 37 38 39 40 41 42 43 44 45 46 47 48 49 50 51 52 53 54 55 56 57
Humanomics
References
Adams, M., & Jiang, W. (2016). Do outside directors influence the financial performance of risk-trading firms? Evidence from the United Kingdom (UK) insurance industry.
Journal of Banking & Finance, 64, 36-51.
Afrifa, G. A., & Tauringana, V. (2015). Corporate governance and performance of UK listed small and medium enterprises. Corporate Governance: The international journal of business in society, 15(5), 719-733.
Baltagi, B. H., & Deng, Y. (2015). EC3SLS estimator for a simultaneous system of spatial autoregressive equations with random effects. Econometric Reviews, 34(6-10), 659-694.
Barros, C. P., Boubaker, S., & Hamrouni, A. (2013). Corporate governance and voluntary disclosure in France. Journal of Applied Business Research, 29(2), 561-578.
Baysinger, B., & Hoskisson, R. E. (1990). The composition of boards of directors and strategic control: Effects on corporate strategy. Academy of Management Review, 15(1), 72-87.
Bhagat, S., & Black, B. (2002). The non-correlation between board independence and long-term firm performance. Journal of Corporation Law, 27(2), 231.
Bhimani, A. (2009). Risk management, corporate governance and management accounting: Emerging interdependencies. Management Accounting Research, 20(1), 2-5.
Boubakri, N. (2011). Corporate governance and issues from the insurance industry. Journal of Risk and Insurance, 78(3), 501-518.
Boubakri, N., Cosset, J. C., & Saffar, W. (2013). The role of state and foreign owners in corporate risk-taking: Evidence from privatization. Journal of Financial Economics, 108(3), 641-658.
Boubakri, N., Dionne, G., & Triki, T. (2008). Consolidation and value creation in the insurance industry: The role of governance. Journal of Banking & Finance, 32(1), 56-68.
Boyd, J. H., & Runkle, D. E. (1993). Size and performance of banking firms: Testing the predictions of theory. Journal of monetary economics, 31(1), 47-67.
Boyer, M. M., & Stern, L. H. (2012). Is corporate governance risk valued? Evidence from directors’ and officers’ insurance. Journal of Corporate Finance, 18(2), 349-372. Bozec, R., & Dia, M. (2017). Monitoring function of the board and audit fees: contingent
upon ownership concentration. International Journal of Accounting & Information Management, 25 (1), 70-90
Brick, I. E., & Chidambaran, N. (2010). Board meetings, committee structure, and firm value.
Journal of Corporate Finance, 16(4), 533-553.
Cadbury, A., Sir. (2002). Corporate governance and chairmanship: A personal view. Oxford: Oxford University Press.
Calomiris, C. W., & Carlson, M. (2016). Corporate governance and risk management at unprotected banks: National banks in the 1890s. Journal of Financial Economics, 119(3), 512-532.
Cheng, J., Elyasiani, E., & Jia, J. J. (2011). Institutional ownership stability and risk taking: Evidence from the life–health insurance industry. Journal of Risk and Insurance, 78(3), 609-641.
Cheng, S. (2008). Board size and the variability of corporate performance. Journal of Financial Economics, 87(1), 157-176.
Clarke, T. (2007). International corporate governance: A comparative approach. Abingdon: Routledge. 3 4 5 6 7 8 9 10 11 12 13 14 15 16 17 18 19 20 21 22 23 24 25 26 27 28 29 30 31 32 33 34 35 36 37 38 39 40 41 42 43 44 45 46 47 48 49 50 51 52 53 54 55 56 57
Humanomics
Conger, J. A., Finegold, D., & Lawler, E. E. (1998). Appraising boardroom performance.
Harvard Business Review, 76, 136-164.
Connelly, B. L., Certo, S. T., Ireland, R. D., & Reutzel, C. R. (2011). Signaling theory: A review and assessment. Journal of Management, 37(1), 39-67.
Core, J. E. (2000). The directors' and officers' insurance premium: An outside assessment of the quality of corporate governance. Journal of Law, Economics, and Organization, 16(2), 449-477.
Eisenhardt, K. M. (1989). Agency theory: An assessment and review. Academy of Management Review, 14(1), 57-74.
Eling, M., & Marek, S. D. (2014). Corporate governance and risk taking: Evidence from the UK and German insurance markets. Journal of Risk and Insurance, 81(3), 653-682. Elmagrhi, M. H., Ntim, C. G., & Wang, Y. (2016). Antecedents of voluntary corporate
governance disclosure: a post-2007/08 financial crisis evidence from the influential UK Combined Code. Corporate Governance: The international journal of business in society, 16(3), 507-538.
Elmagrhi, M. H., Ntim, C. G., Crossley, R., Malagila, J., Fosu, S., & Vu, T. (2017). Corporate governance and dividend pay-out policy in UK listed SMEs: The effects of corporate board characteristics. International Journal of Accounting and Information Management In Press.
Fama, E. F., & Jensen, M. C. (1983). Separation of ownership and control. The Journal of Law & Economics, 26(2), 301-325.
Fama, E. F., & Jensen, M. C. (1985). Organizational forms and investment decisions. Journal of Financial Economics, 14(1), 101-119.
FRC. (2012). UK Corporate Governance Code 2012. Retrieved from www.frc.org.uk/ /Corporate-Governance/UK-Corporate-Governance.
FRC. (2014). The UK Corporate Governance Code. Retrieved from https://www. frc. org. uk/Our-Work/Publications/Corporate-Governance. UK-Corporate-Governance-Code-September-2012. pdf
French, A., Vital, M., & Minot, D. (2015). Insurance and financial stability. Bank of England.
Quarterly Bulletin, 55(3).
Fu, X. M., Lin, Y. R., & Molyneux, P. (2014). Bank competition and financial stability in Asia Pacific. Journal of Banking & Finance, 38, 64-77.
González, L. O., Razia, A., Búa, M. V., & Sestayo, R. L. (2017). Competition, concentration and risk taking in Banking sector of MENA countries. Research in International Business and Finance, 42, 591-604.
Gujarati, D. N., & Porter, D. C. (2009). Basic econometrics (5th ed.). London: McGraw-Hill. Haniffa, R., & Hudaib, M. (2006). Corporate governance structure and performance of
Malaysian listed companies. Journal of Business Finance & Accounting, 33(7‐8), 1034-1062.
Hardwick, P., Adams, M., & Zou, H. (2011). Board characteristics and profit efficiency in the United Kingdom life insurance industry. Journal of Business Finance & Accounting, 38(7‐8), 987-1015.
Higgs, D. (2003). Review of the role and effectiveness of non-executive directors. London: DTI.
Hines, C. S., Masli, A., Mauldin, E. G., & Peters, G. F. (2015). Board risk committees and audit pricing. Auditing: A Journal of Practice & Theory, 34(4), 59-84.
Hsu, W.-Y., & Petchsakulwong, P. (2010). The impact of corporate governance on the efficiency performance of the Thai non-life insurance industry. The Geneva Papers on Risk and Insurance-Issues and Practice, S28-S49.
3 4 5 6 7 8 9 10 11 12 13 14 15 16 17 18 19 20 21 22 23 24 25 26 27 28 29 30 31 32 33 34 35 36 37 38 39 40 41 42 43 44 45 46 47 48 49 50 51 52 53 54 55 56 57
Humanomics
Jensen, M. C. (1993). The modern industrial revolution, exit, and the failure of internal control systems. The Journal of Finance, 48(3), 831-880.
Jensen, M. C. (2001). Value maximization, stakeholder theory, and the corporate objective function. Journal of Applied Corporate Finance, 14(3), 8-21.
Jensen, M. C., & Meckling, W. H. (1976). Theory of the firm: Managerial behavior, agency costs and ownership structure. Journal of Financial Economics, 3(4), 305-360. Jermias, J., & Gani, L. (2014). The impact of board capital and board characteristics on firm
performance. The British Accounting Review, 46(2), 135-153.
John, K., Litov, L., & Yeung, B. (2008). Corporate governance and risk‐taking. The Journal of Finance, 63(4), 1679-1728.
Laas, D., & Siegel, C. (2013). Basel accords versus Solvency II: Regulatory adequacy and consistency under the postcrisis capital standards. [Risk Management and Insurance Working Paper].
Laeven, L., & Levine, R. (2009). Bank governance, regulation and risk taking. Journal of Financial Economics, 93(2), 259-275.
Larcker, D. F., & Rusticus, T. O. (2010). On the use of instrumental variables in accounting research. Journal of Accounting and Economics, 49(3), 186-205.
Li, C. A., & Wearing, R. T. (2012). Risk management and non-executive directors in UK quoted banks and other financial institutions. International Journal of Disclosure and Governance, 9(3), 226-237.
Maffei, M., Aria, M., Fiondella, C., Spanò, R., & Zagaria, C. (2014). (Un) useful risk disclosure: explanations from the Italian banks. Managerial Auditing Journal, 29(7), 621-648.
Mathew, S., Ibrahim, S. & Archbold, S. (2016). Boards attributes that increase firm risk– evidence from the UK. Corporate Governance: The international journal of business in society, 16(2), 233-258.
Mayers, D., & Smith, C. W. (2010). Compensation and board structure: Evidence from the insurance industry. Journal of Risk and Insurance, 77(2), 297-327.
Mokhtar, E., & Mellett, H. (2013). Competition, corporate governance, ownership structure and risk reporting. Managerial Auditing Journal, 28(9), 838-865.
Nahar Abdullah, S. (2004). Board composition, CEO duality and performance among Malaysian listed companies. Corporate Governance: The international journal of business in society, 4(4), 47-61.
Nahar, S., Jubb, C., & Azim, M. I. (2016). Risk governance and performance: a developing country perspective. Managerial Auditing Journal, 31(3), 250-268.
Najjar, N. J. (2012). The impact of corporate governance on the insurance firm’s performance in Bahrain. International Journal of Learning and Development, 2(2), 1-17.
Ntim, C. G., & Osei, K. A. (2011). The impact of corporate board meetings on corporate performance in South Africa. African Review of Economics and Finance, 2(2), 83-103.
OECD. (2004). OECD principles of corporate governance, 3-66. Retrieved from http://www.oecd.org/corporate/ ca/corporategovernanceprinciples/31557724.pdf. Pallant, J. (2013). SPSS survival manual. McGraw-Hill Education (UK).
Pathan, S., & Faff, R. (2013). Does board structure in banks really affect their performance?.
Journal of Banking & Finance, 37(5), 1573-1589.
Priya, K., & Nimalathasan, B. (2013). Board of directors’ characteristics and financial performance: a case study of selected hotels and restaurants in Sri Lanka. Merit Research Journal of Accounting, Auditing, Economics and Finance, 1(2), 18-25. PWC. (2010). Corporate governance: Best practice reporting. UK: PWC. Retrieved from
http://www.pwc.co.uk/assets/pdf/corporate-governance-best-practice-reporting.pdf . 3 4 5 6 7 8 9 10 11 12 13 14 15 16 17 18 19 20 21 22 23 24 25 26 27 28 29 30 31 32 33 34 35 36 37 38 39 40 41 42 43 44 45 46 47 48 49 50 51 52 53 54 55 56 57
Humanomics
Rashid, K., & Islam, S. M. (2014). Corporate governance, firm performance and complementarities in a developed market: A study of the Australian case for the period 2000–2003. International Journal of Disclosure and Governance, 11(3), 255-283.
Solomon, J. (2010). Corporate governance and accountability (3rd ed.): Chichester: John Wiley & Sons.
Spira, L. F., & Page, M. (2003). Risk management: The reinvention of internal control and the changing role of internal audit. Accounting, Auditing & Accountability Journal, 16(4), 640-661.
Su, W., & Lee, C. Y. (2013). Effects of corporate governance on risk taking in Taiwanese family firms during institutional reform. Asia Pacific Journal of Management, 30(3), 809-828.
Tanda, A. (2015). Corporate governance and bank regulation: The impact on capital ratios. International Journal of Disclosure and Governance, 12(4), 327-353.
Tornyeva, K., & Wereko, T. (2012). Corporate governance and firm performance: Evidence from the insurance sector of Ghana. Corporate Governance, 4(13).
Vafeas, N. (1999). Board meeting frequency and firm performance. Journal of Financial Economics, 53(1), 113-142. doi:10.1016/S0304-405X(99)00018-5
Vafeas, N., & Theodorou, E. (1998). The relationship between board structure and firm performance in the UK. The British Accounting Review, 30(4), 383-407.
Weir, C., & Laing, D. (2001). Governance structures, director independence and corporate performance in the UK. European Business Review, 13(2), 86-95.
Yeoh, P. (2010). Causes of the global financial crisis: Learning from the competing insights. International Journal of Disclosure and Governance,7(1), 42-69.
3 4 5 6 7 8 9 10 11 12 13 14 15 16 17 18 19 20 21 22 23 24 25 26 27 28 29 30 31 32 33 34 35 36 37 38 39 40 41 42 43 44 45 46 47 48 49 50 51 52 53 54 55 56 57
Humanomics
Tables
Table 1: Sample choice process
Sample aspects on April 2016 No of firms No of obs
Total firms in FTSE 350 350 3500
- Non-insurance firms in FTSE 350 335 3350 = Insurance firms in FTSE 350 15 150 - Exclude three insurance firms in FTSE 350 (because no data
available for most of the years under study) 3 30
Final sample 12 120
Exclude three years of one insurance firm (because the company
was established at the end of 2008 3
Final number of observations 117
3 4 5 6 7 8 9 10 11 12 13 14 15 16 17 18 19 20 21 22 23 24 25 26 27 28 29 30 31 32 33 34 35 36 37 38 39 40 41 42 43 44 45 46 47 48 49 50 51 52 53 54 55 56 57
Humanomics
Table 2: Definition of variables
Variables Abbrev Measurement Source of information
Dependent variable: Insurance firms’ risk taking
RT1 ZscoreROA
is the risk taking using ROA; The firm-level Z-score; a larger value means less overall firm risk and greater stability.
Annual report
RT2 ZscoreROE is the risk taking using ROE. Annual report Return on assets ICROA Percentage of net income to total assets FAME; Annual
report Return on
equity ICROE Percentage of net income to total equity
FAME; Annual report
Independent variables
Board size ICBS Total number of directors on the board Annual report (CG section) Board meetings ICBM Total number of board of directors’
meetings
Annual report (CG section) Board
independence ICNEDs
Percentage of non-executive directors to the total number of board of directors
Annual report (CG section)
Audit
committee size ICACs
Total number of audit committee members
Annual report (CG section)
Control variables
Insurance
company size ICTA Natural logarithm of total assets
FAME-Osiris
Liquidity ratio ICI Percentage of current assets to current liabilities FAME-Osiris 3 4 5 6 7 8 9 10 11 12 13 14 15 16 17 18 19 20 21 22 23 24 25 26 27 28 29 30 31 32 33 34 35 36 37 38 39 40 41 42 43 44 45 46 47 48 49 50 51 52 53 54 55 56 57
Humanomics
Table 3: Descriptive statistics for each year separately
Variables 2005 2006 2007 2008 2009 2010 2011 2012 2013 2014 RT1 Mean 0.83 0.87 1.08 0.82 0.65 0.72 0.45 0.64 0.55 0.53 Std. Deviation 1.11 1.20 1.46 1.37 1.08 1.03 0.76 0.87 0.71 0.61 Minimum 0.10 0.12 0.06 -0.16 0.03 0.01 0.01 -0.15 -0.19 0.06 Maximum 3.61 3.92 4.12 4.00 3.67 3.01 2.29 2.54 2.14 1.82 RT2 Mean 1.40 1.35 1.21 0.24 0.90 1.07 0.72 1.05 1.17 1.05 Std. Deviation 0.83 0.84 0.89 1.50 0.92 0.91 0.98 1.08 0.97 0.68 Minimum 0.20 0.29 0.27 -2.88 0.14 0.02 -0.01 -1.23 -0.40 0.33 Maximum 3.17 3.24 3.69 3.54 3.46 3.65 3.65 3.62 3.45 2.97 ICBS Mean 11.45 11.36 11.55 11.33 11.75 12.08 12.58 12.42 11.92 11.50 Std. Deviation 1.92 2.06 2.02 1.92 1.86 2.54 2.15 1.38 1.56 2.24 Minimum 9.00 7.00 9.00 9.00 9.00 9.00 9.00 11.00 10.00 8.00 Maximum 14.00 14.00 16.00 15.00 14.00 17.00 17.00 16.00 16.00 16.00 ICBM Mean 9.00 8.27 9.55 8.58 8.42 8.92 9.00 8.42 8.00 8.58 Std. Deviation 3.63 2.80 3.96 4.03 3.82 3.87 4.57 3.06 2.22 2.78 Minimum 4.00 4.00 5.00 4.00 4.00 4.00 4.00 4.00 4.00 4.00 Maximum 14.00 11.00 18.00 17.00 15.00 19.00 19.00 15.00 11.00 14.00 ICNEDs% Mean 0.59 0.58 0.60 0.64 0.64 0.65 0.67 0.67 0.68 0.61 Std. Deviation 0.10 0.11 0.10 0.11 0.09 0.09 0.08 0.08 0.10 0.18 Minimum 0.45 0.41 0.46 0.45 0.50 0.53 0.54 0.53 0.50 0.10 Maximum 0.81 0.75 0.75 0.85 0.78 0.78 0.78 0.78 0.81 0.77 ICACS Mean 4.09 4.09 4.00 4.25 4.25 4.50 4.58 4.58 4.42 4.58 Std. Deviation 0.83 0.83 1.00 1.06 1.14 1.51 1.24 1.38 1.44 1.38 Minimum 3.00 3.00 3.00 3.00 3.00 3.00 3.00 3.00 3.00 3.00 Maximum 6.00 6.00 6.00 6.00 6.00 7.00 7.00 8.00 8.00 8.00 3 4 5 6 7 8 9 10 11 12 13 14 15 16 17 18 19 20 21 22 23 24 25 26 27 28 29 30 31 32 33 34 35 36 37 38 39 40 41 42 43 44 45 46 47 48 49 50 51 52 53 54 55 56 57
Humanomics
Table 4: Descriptive statistics for all variables
Variables Mean Median Std. Deviation Minimum Maximum
RT1 0.71 0.21 1.02 -0.19 4.12 RT2 1.01 0.91 1.00 -2.88 3.69 ICBS 11.80 12.00 1.96 7.00 17.00 ICBM 8.67 9.00 3.43 4.00 19.00 ICNEDs (%) 0.63 0.63 0.11 0.10 0.85 ICACS 4.34 4.00 1.18 3.00 8.00 ICTA (000) 133541.41 35183.60 311761.57 593.00 3213260.00 ICL% 1.14 0.78 1.20 0.01 6.88
Notes: Variables are defined as follows: Risk taking using ROA (RT1), Risk taking using ROE (RT2), insurance company return on assets (ICROA); insurance company return on equity (ICROE); insurance company board size (ICBS); insurance company board meetings (ICBM); insurance company board independence (ICNEDs); insurance company audit committee size (ICACS); insurance company size (ICTA); and insurance company liquidity (ICL). Full definitions of these variables are presented above in Table 2.
3 4 5 6 7 8 9 10 11 12 13 14 15 16 17 18 19 20 21 22 23 24 25 26 27 28 29 30 31 32 33 34 35 36 37 38 39 40 41 42 43 44 45 46 47 48 49 50 51 52 53 54 55 56 57
Humanomics
Table 5: Pearson correlation among all variables
RT1 RT2 ICBS ICBM ICNEDs ICACS ICTA ICL RT1 1 RT2 0.65** 1 0.00 ICBS 0.33** 0.06 1 0.00 0.55 ICBM 0.38** 0.15 0.068 1 0.00 0.10 0.463 ICNEDs 0.05 0.11 -0.074 0.098 1 0.58 0.25 0.425 0.294 ICACS 0.21* 0.20* 0.081 0.090 0.272** 1 0.02 0.03 0.383 0.335 0.003 ICTA 0.25** 0.13 0.197* 0.519** 0.021 0.132 1 0.01 0.16 0.034 0.000 0.819 0.158 ICL -0.18* -0.21* -0.026 0.107 0.149 0.123 0.099 1 0.05 0.02 0.781 0.252 0.110 0.187 0.290
Notes: Variables are defined as follows: Risk taking using ROA (RT1); risk taking using ROE
(RT2); insurance company board size (ICBS); insurance company board meetings (ICBM);
insurance company board independence (ICNEDs); insurance company audit committee size (ICACS); insurance company size (ICTA); and insurance company liquidity (ICL). Full definitions of these variables are presented above in Table 2.
** Significant at the 0.01 level. * Significant at the 0.05 level. 3 4 5 6 7 8 9 10 11 12 13 14 15 16 17 18 19 20 21 22 23 24 25 26 27 28 29 30 31 32 33 34 35 36 37 38 39 40 41 42 43 44 45 46 47 48 49 50 51 52 53 54 55 56 57
Humanomics
24
Table 6: The impact of internal corporate governance mechanisms on risk taking
OLS regression
Variables
Dependent variable: RT1
Dependent variable: RT2
t
P>|t|
VIF
t
P>|t|
VIF
Panel A: Independent :
Internal Corporate Governance Mechanisms
ICBS
3.927***
0.000
1.057
1.701*
.092
1.057
ICBM
6.561***
0.000
1.388
4.876***
.000
1.388
ICNEDs
0.662
0.510
1.111
0.879
.381
1.111
ICACS
0.092
0.927
1.108
1.760*
.081
1.108
Panel B: Control variables
ICTA
4.216***
0.000
1.439
7.285***
.000
1.439
ICL
-2.181**
0.031
1.041
-1.343
.182
1.041
Constant
6.307***
0.000
-
5.511***
.000
-
D.Year
Included
Included
F value
10.770***
10.231***
R
20.372
0.360
Adjusted R
20.338
0.325
Durbin-Watson
2.120
2.348
Notes: Variables are defined as follows:
Risk taking using ROA (RT1), risk taking using ROE (RT2),insurance company board size (ICBS); insurance company board meetings (ICBM);
insurance company board independence (ICNEDs); insurance company audit committee size
(ICACS); insurance company size (ICTA); insurance company liquidity (ICL); and dummy
variable for each year from 2005 to 2014 (D.Year). Full definitions of these variables are
presented above in Table 2.
*** Significant at the 0.01 level.
** Significant at the 0.05 level.
* Significant at the 0.10 level.
3 4 5 6 7 8 9 10 11 12 13 14 15 16 17 18 19 20 21 22 23 24 25 26 27 28 29 30 31 32 33 34 35 36 37 38 39 40 41 42 43 44 45 46 47 48 49 50 51 52 53 54 55 56 57
Humanomics
25
Table 7: The impact of internal corporate governance mechanisms on risk taking
Fixed effects
2SLS
Variables (1) RT1
(2) RT2
(3) RT1
(4) RT2
t
P>|t| t
P>|t| z
P>|z| z
P>|z|
Panel A: Independent :
Internal Corporate Governance Mechanisms
ICBS
4.359***
0.000 3.463***
0.000 4.025***
0.000 4.589***
0.000
ICBM
3.615***
0.000 0.82
0.414 4.713***
0.000 1.49
0.136
ICNEDs
0.64
0.524 0.26
0.796 0.55
0.580 0.30
0.762
ICACS
0.38
0.705 0.36
0.719 0.32
0.748 0.50
0.618
Panel B: Control variables
ICTA
11.39***
0.000 11.99***
0.000 10.32***
0.000 11.74***
0.000
ICL
-1.02
0.310 -0.87
0.386 -1.19
0.234 -0.99
0.322
Constant
2.40**
0.019 2.04**
0.044 2.39**
0.017 2.17**
0.030
Fixed
effect
Year
Year
Year
Year
clustering Firm
Firm
Firm
Firm
F
value
(χ
2)23.24
25.42
115.37
145.76
R
20.5872***
0.6088***
0.5829***
0.6069***
Notes: Variables are defined as follows:
Risk taking using ROA (RT1); risk taking using ROE (RT2);insurance company board size (ICBS); insurance company board meetings (ICBM); insurance
company board independence (ICNEDs); insurance company audit committee size (ICACS);
insurance company size (ICTA); insurance company liquidity (ICL); and dummy variable for each
year from 2005 to 2014 (D.Year). Full definitions of these variables are presented above in Table 2.
*** Significant at the 0.01 level.
** Significant at the 0.05 level.
* Significant at the 0.10 level.
3 4 5 6 7 8 9 10 11 12 13 14 15 16 17 18 19 20 21 22 23 24 25 26 27 28 29 30 31 32 33 34 35 36 37 38 39 40 41 42 43 44 45 46 47 48 49 50 51 52 53 54 55 56 57