Contribution of Sell-Side Equity Analyst Reports to Client’s Return and Stock Price
Efficiency: Indonesia Stock Market Evidence
(Sumbangan Laporan Penganalisis Ekuiti terhadap Pulangan Pelabur dan Kecekapan Harga Saham: Bukti Empirikal Bursa Saham Indonesia)
Irwan Adi Ekaputra
(Department of Management, Faculty of Economics and Business, Universitas Indonesia) C. Erna Susilawati
(Faculty of Business, Unika Widya Mandala, Surabaya) Cynthia Afriani Utama
(Department of Management, Faculty of Economics and Business, Universitas Indonesia)
ABSTRACT
The present study investigates whether equity analyst reports benefit clients and improve stock price efficiency. Company-focus reports issued and documented by six brokerage companies in Indonesia are collected and the analysis Company-focuses on the revisions of stock recommendations (upgrade, downgrade, or reiteration); earnings forecasts; and price targets. First, the results show that analyst reports contribute to client’s returns. Upgrade revisions, downgrade revisions and price target revisions significantly influence clients’ abnormal returns. However, clients do not seem to take into account earnings forecast revisions. Second, the finding reveal that analyst reports contribute to stock price efficiency. Upgrade revisions and price target revisions improve price efficiency. However, earnings forecast revisions and downgrade revisions do not appear to improve price efficiency. Third, the results indicate that price efficiency improvement tends to reduce non-client (market) abnormal returns, which corroborates the second finding.
Keywords: Abnormal return; analyst; brokerage; price efficiency; price informativeness
ABSTRAK
Kajian ini terdiri dari tiga bagian guna mempelajari apakah laporan analis saham: (1) menguntungkan nasabah, (2) meningkatkan efisiensi harga saham. Kami mengumpulkan laporan analis yang diterbitkan dan didokumentasikan oleh enam broker saham di Indonesia, dan berfokus pada revisi atas rekomendasi saham (upgrade, downgrade, atau reiteration), prakiraan laba, dan target harga. Hasil pertama menunjukkan bahwa laporan analis berkontribusi pada imbah hasil nasabah. Revisi upgrade, downgrade dan revisi target harga berpengaruh signifikan pada imbal hasil abnormal yang diperoleh nasabah. Namun demikian, nasabah tampaknya tidak memperhatikan revisi atas prakiraan laba. Hasil kedua mengungkapkan bahwa laporan analis berpengaruh pada efisiensi harga saham. Revisi upgrade dan target harga mampu meningkatkan efisiensi harga saham,sedangkan revisi prakiraan laba dan revisi downgrade tidak mempengaruhi efisiensi harga saham. Hasil ketiga menunjukkan bahawa peningkatan efisiensi harga saham cenderung menurunkan imbal hasil abnormal non-nasabah (pasar). Hal ini selaras dengan hasil kedua.
Kata kunci: Pulangan tidak normal, penganalisis; broker; kecekapan harga; penerangan harga
INTRODUCTION
According to the efficient market hypothesis, higher price efficiency or price informativeness is desirable because more information is impounded into stock price. To increase stock price efficiency, agents must actively search for and disseminating good quality information in the market (Grossman & Stiglitz 1980). An equity analyst is one of the aforementioned agents whose role is to preempt insiders’ information and to interpret complex public information.
After gathering and evaluating all relevant information, analysts generally issue company-focus reports containing stock recommendations, earnings estimates and price targets. In developed markets, such reports contain valuable information that can normally
generate abnormal returns (Asquith et al. 2005). Whether the finding is also applicable in an emerging market such as Indonesia is what motivates the present study. Generally, emerging markets are perceived to be more risky due to higher stock return volatility and the lack of credible information dissemination (Moshirian et al. 2009). Furthermore, even if compared to other emerging markets, Indonesia implements specific trading rules (Commerton-Forde & Rydge 2006) that may distort the value of equity analyst reports, such as single lot size of 500 shares, non-decimal (full Indonesian Rupiah) tick sizes, and limited short sell.
The first objective of the present study is to investigate whether equity analyst reports actually benefits brokers’ clients. As in many countries, employing sell-side equity analysts in Indonesia is costly. Only brokerage companies
with a significant pool of clients can afford such personnel. When the company focus reports are available, the reports are firstly given to loyal clients of the brokerage house employing the analysts. Once becoming more informed about a particular stock, the clients are then expected to trade with the broker (Irvine 2000). If equity analysts benefit clients, then the clients should be able to generate abnormal returns.
The second objective of the present paper, which is rarely addressed in extant academic literature, is to investigate whether equity analyst reports contribute to improving stock price efficiency. After the release of analyst reports to a limited pool of clients, the price of the stock should gradually be more informative due to clients’ transactions and information outflow (Jones et al. 1994). In other words, because of clients’ transactions and information leakage, the stock price efficiency should gradually be higher. Regrettably, for non-clients, higher price efficiency also means the stock price is already approaching its “fair price” level. If stock price efficiency is enhanced, then the possibility for broader market participants to acquire abnormal returns from that particular stock should be lower.
In the present study, the primary focus is on the information content of revisions of stock recommendations (upgrades, downgrades, or reiteration), earnings estimates and price targets. The information content of the revisions of stock recommendations is documented in many studies (e.g., Asquith et al. 2005; Ivkovic & Jegadeesh 2004; Jegadeesh et al. 2004). The information content of earnings forecast revisions is documented in Aitken et al. (1996) and Liu and Thomas (2000). Meanwhile, the importance of price target revisions is acknowledged in Asquith et al. (2005) and Huang et al. (2009).
The rest of the paper is organized as follows. Section 2 describes the methodology employed in the present research. Section 3 explains the empirical model. Section 4 briefly describes the data. Section 5 presents and discusses the results of the study. Section 6 provides some concluding remarks.
METHODOLOGY
REVISIONS OF RECOMMENDATIONS, EARNINGS FORECASTS, AND PRICE TARGETS
Stock recommendations are classified into buy, hold and sell. The revisions of stock recommendations are categorized into upgrade, downgrade and reiteration. Upgrade is a revision from sell to hold; sell to buy; or hold to buy. Downgrade is a revision from buy to hold; buy to sell; or hold to sell. Reiteration is when the current and previous recommendations are the same. Analyst earnings forecasts are stated in reports one year in advance. Earnings forecast revisions are calculated using Eq. (1):
EFt − EFt-1
EFR = (1)
EFt-1
EFRis the earnings forecast revision, EFt is the earnings forecast stated in the analyst report of the current period (t), and EFt-1 is the earnings forecast stated in the analyst report of the previous period (t-1). EFRis positive (negative) if the current period earnings forecast is higher (lower) than the forecast of the previous period.
Similar to earnings forecasts, price targets are calculated one year ahead of predicted stock prices, which are indicated in published analyst reports. Price target revisions are calculated using Eq. (2):
PTt − PTt-1
PTR = (2)
PTt-1
PTRis the price target revision, PTt is the price target stated in the analyst report of the current period (t), and PTt-1 is the price target stated in analyst report of the previous period (t-1). PTR is positive (negative) if the price target of the current period is higher (lower) than the price target of the previous period.
ABNORMAL RETURN
Abnormal returns are realized returns that exceed expected returns. In the present study, two types of abnormal returns are calculated: (1) abnormal returns earned by brokerage clients, and (2) abnormal returns earned by non-clients or the general market. In principal, the same methods are utilized to compute both abnormal returns, but different observation intervals and stock price data utilized in each calculation.
To calculate clients’ realized returns, modifying the approach taken by Brav and Lehavy (2003) and Asquith et al (2005), observation periods are used beginning one day prior (t–1) until four days after (t+4) the release date of the report. The observation window reflects the possibility that some clients receive the report earlier or later than the date stated in the report. The approach is also consistent with the conjecture that clients may receive equity reports before other market participants who are non-clients. Moreover, on the day company-focus report is released, some clients may already have executed their trades.
The price used to calculate broker’s client realized returns is the last trading price executed by the broker. Transaction data is utilized to find the last trading price of a particular stock by a particular broker, irrespective of whether the broker is a seller or a buyer. Broker codes consist of two letters, for example “OD” represents Danareksa Sekuritas. The realized returns are then calculated for four domestic brokerage companies: BJ (Andalan Artha Advisindo), DX (Bahana Securities), LG (Trimegah Securities) and OD (Danareksa Sekuritas); and two foreign brokerage companies: BW (BNP Paribas
Securities Indonesia) and DP (DBS Vickers Securities Indonesia). The brokerage companies are the firms that participated in the present research.
To calculate non-client (market) realized returns, following Kim and Shamsuddin (2008), the observation period used begins on the report release date (t – 0) and continues until ten days after the release date (t + 10). The price used to calculate non-client realized returns is the stock daily closing price, irrespective of whether the brokers are involved in the last stock trade of the day.
To calculate abnormal returns, each respective expected return must be estimated. The present study employs the market model to estimate expected returns and the formula to calculate abnormal returns is presented in eq. (3):
ARit = Rit – βi Rmt (3)
ARit is either client or market (non-client) abnormal returns of stock i at period t. Rit is either client or market (non-client) realized returns of stock i at period t. βiis Dimson beta adjusted for non-synchronous trading problems of stock i (Dimson 1979; Liu et al. 2012) and Rmt is market return at time t. The Dimson beta is utilized due to the fact that many stocks in emerging markets are lightly or infrequently traded. Most lightly traded stocks will experience non-synchronous trading problems and adjustments are required to measure the risk of infrequently traded stocks. Empirical model (4) is utilized to estimate the beta of the stock:
Rit = ai +
∑
bij Rmt+j + eit (4)Rit is the return of stock i at time t, Rmt+j is the market return at time t + j, where j is the time lag and lead. The choice of j = -4 to 4 follows the methodology of Tandelilin and Lantara (2001). To obtain the Dimson beta of stock i (βi), the sum of all nine bij regression coefficients from eq. (4), regardless of their individual statistical significance, is utilized as presented in Eq. (5).
βi =
∑
bij (5)As previously discussed, both client and non-client (market) abnormal returns are calculated. The steps in eq. (3) to (5) are applicable to calculate both abnormal returns, but each group uses different stock prices and observation intervals. After computing each stock abnormal return at period t (ARt), the cumulative abnormal returns at period t(CARt) are then calculated, for both clients and non-clients, using eq. (6). The client cumulative abnormal returns (CCAR) comprise abnormal returns from period t – 1 (n = –1) until t + 4 (m = 4), while market (non-client) cumulative abnormal returns (MCAR) comprise abnormal returns from period t + 0 (n = 0) until t + 10 (m = 10).
CARt =
∑
ARt (6)MEASURING PRICE INEFFICIENCY
Instead of directly measuring stock price efficiency, price inefficiency is measured to infer price efficiency improvement. The level of price inefficiency (PINE) is measured based upon the market efficiency coefficient (MEC) concept of Hasbrouck and Schwartz (1988), as presented in Ekaputra and Asikin (2012). If a series of prices P0, P1, P2, P3,…, PT exists, the gross returns for T period can be computed using Eq. (7):
PT P1 P2 P3 PT (7)
= x x x...x
P0 P0 P1 P2 PT-1
If log returns are applied to eq. (7), long period returns (LHS) are found to be the sum of shorter period returns within that period (RHS), as presented in Eq. (8):
RL =
∑
RS,m (8)RL is long term log return and RS,m is short period log returns within the respective long term period. If the stock price is informational efficient (assuming that short term returns are not correlated), the variance of a long term return should be equal to the sum of variances of its respective shorter term returns (Ekaputra & Asikin 2012). In the present study, long term returns are measured as daily returns and short term returns are measured as 30 minute returns. The variances are measured over a period of ten days after the report is released. Generally, if the price is efficient, the following Eq. (9) should hold:
Var (RL) =
∑
Var (RS, m) = T(Var (RS)) (9)Var (RL) is the long term (one day) return variance and
Var (RS) is the short term (thirty minutes) return variance. In the present study, T equals to ten since there are ten thirty minute intervals in one trading day in the Indonesia Stock Exchange. MEC is measured as the ratio of the long term return variance in relation to its short term return counterpart, as stated in Eq. (10):
Var (RL)
MEC = (10)
10Var (RS ))
If the stock price is efficient (information is fully reflected in stock price), then MEC should be equal to one. If MEC is less than one, then the market overreacts or overshoots price discovery. If MEC is more than one, then the market underreacts or undershoots price discovery.
Ideally, the perfect MEC is one, so price inefficiency (PINE) is defined as the absolute difference of MEC from unity (Ekaputra & Asikin 2012) as stated in Eq. (11):
(PINE) = |MEC – 1| (11) j=-4 4 j=-4 4 t=n m m=1 T m=1 T
A higher PINE means lower price efficiency. So, if equity analyst reports contribute to stock price efficiency, the reports are expected to reduce PINE. Henceforth, the empirical interest of the present study is the change of PINE (ΔPINE) before and after the release of report revisions, as specified in Eq. (12).
ΔPINE = PINEbefore –PINEafter (12)
If ΔPINE is positive, then report revisions improve price efficiency since price inefficiency prior to the release of the report revision is greater than price inefficiency after the release of the report revision. On the other hand, if ΔPINE is negative, then report revisions do not make stock price more informative.
EMPIRICAL MODEL
THE IMPACT OF ANALYST REPORTS ON CLIENT ABNORMAL RETURN
To investigate the impact of analyst reports on client abnormal returns, the following empirical model (13) is utilized:
CCARi =α0+α1D_UPi+α2 D_DOWNi+α3 EFRi+ α4 PTRi + ei (13)
where CCARi is the cumulative abnormal returns accrued to brokers’ clients since one day before (t-1) until four days after (t + 4) report-i release date. D_UPi is a dummy variable that equals one if report-i provides an upgrade stock recommendation and zero if otherwise. D_DOWNi is a dummy variable equal to 1 if report-i gives a down grade stock recommendation and zero if otherwise. Both dummies will be zero if report-i reiterates the previous stock recommendation. EFRi is the earnings forecast revision in report-i relative to the earnings forecast stated in the previous report, as defined in eq. (1). PTRi is the price target revision in report-i relative to the price target stated in the previous report, as explained in eq. (2).
Upgrade revisions are expected to positively impact CCAR, while downgrade revisions are expected to negatively impact CCAR. Earnings forecast revisions and price target revisions are expected to positively impact CCAR. Thus, except for α2, the signs of all coefficients are expected to be positive. Coefficient α2 is expected to be negative since downgrade revisions are expected to reduce client cumulative abnormal returns.
THE IMPACT OF ANALYST REPORTS ON PRICE EFFICIENCY To determine whether revisions improve price efficiency, the two following empirical models are utilized:
ΔPINEi = β0+ β1D_UPi + β2D_DOWNi + β3EFRi +
β4PTRi + β5ΔPi + β6ΔVi + ei (14)
ΔPINEi = δ0+ δ1D_UPi + δ2D_DOWNi + δ3EFRi + δ4PTRi + δ5CCAR + δ6ΔPi + δ7ΔVi + ei (15) where ΔPINE is price efficiency improvement, as defined in eq. (12). As previously described, D_UPi is a dummy variable equal to one if report-i gives an upgrade stock recommendation and zero if otherwise. D_DOWNi is a dummy variable equal to 1 if report-i provides a down grade stock recommendation and zero if otherwise. EFRi is the earnings forecast revision in report-i as specified in eq.(1). PTRi is the price target revision in report-i relative to the price target stated in the previous report, as explicated in eq. (2).
The only difference between the two models is the inclusion of variable CCAR as an independent variable. The inclusion of the variable is to check and control for the influence of client cumulative abnormal returns on price efficiency improvement. Following the findings of Hasbrouck and Schwartz (1988), two further control variables are also included: price changes and transaction volume changes. The calculation of ΔPi is presented in eq. (16). APi,after is the average stock closing price during the ten day period after the release of report-i. APi,before is the average stock closing price during the ten day period prior to the release of report-i.
ΔPi= (APi,after – APi,before) / APi,before (16) The computation of ΔVi is presented in eq. (17). AVi,after is the average stock transaction volume for ten days following the report-i release date. AVi,before is the average stock transaction volume for the ten days prior to the release of report-i.
ΔVi= (AVi,after – AVi,before) / AVi,before (17)
All variables in Eq. (14) and (15) are expected to positively impact price efficiency improvement.
THE IMPACT OF PRICE EFFICIENCY IMPROVEMENT ON MARKET ABNORMAL RETURN
To test the impact of price efficiency improvement on cumulative abnormal returns earned by the whole market, the following empirical model (18) is utilized:
MCARi = γ0 + γ1 ΔPINEi + ei (18) where MCARi is the cumulative abnormal returns accrued to the whole market for the period of ten days following the release date of report-i. ΔPINEi is the improvement of price efficiency (positive value means improved price efficiency) as explicated in eq. (7) to (12). γ1 is expected to be negative since the improvement of price efficiency should reduce the possibility of earning MCAR.
DATA
The unit of analysis in the present research is the company-focus report issued by equity analyst. Written requests were conveyed to fifty brokerage companies, but positive responses were only received from six brokerage companies. The initial data sample consists of 1182 company-focus reports from six brokers for the period between 2006 and 2008. In addition to the company-focus reports, daily closing stock prices, daily transaction volume, the Jakarta Composite Index and tick by tick transaction data are utilized to identify the brokers’ transactions. Each broker has a two letter code and the present study focuses upon the activities of six contributing brokers representing the aforementioned domestic and foreign brokerage companies in Indonesia.
Since the present study focuses on revisions, reports with no prior issue cannot be used. Additionally, measures are taken to ensure that no corporate action from the relevant company under analysis occurs during the ten days before and the ten days after the report is released. Hence, the final sample consists of 963 observations.
RESULTS AND DISCUSSIONS
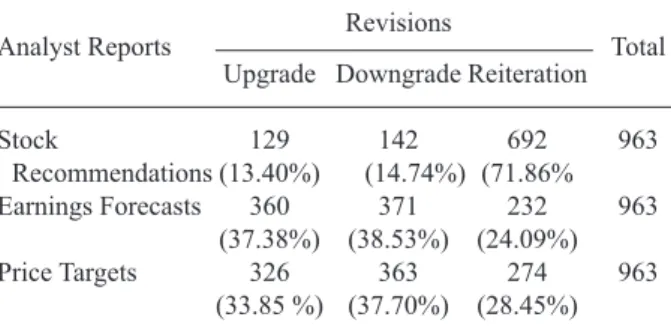
Using all 963 equity analyst report revisions in the final sample, the reports are classified into three categories: stock recommendations, earnings forecasts and price targets. The reports are then cross tabulated into three revision categories: upgrade, downgrade and reiteration. The complete cross tabulation of the reports is presented in Table 1.
TABLE 1. Description of Analyst Report Revisions
Analyst Reports Revisions Total
Upgrade Downgrade Reiteration
Stock 129 142 692 963 Recommendations (13.40%) (14.74%) (71.86% Earnings Forecasts 360 371 232 963 (37.38%) (38.53%) (24.09%) Price Targets 326 363 274 963 (33.85 %) (37.70%) (28.45%)
Notes: Figures in middle columns refer to number (percentage) of revisions on the
three types of analyst reports.
In Table 1, reiterations of previous recommendations are found to comprise 71.86 percent of total recommendations issued. Downgrades from previous stock recommendations are 14.74 percent, while upgrades are only 13.40 percent. During the observation period of the present research (2006-2008), analysts tend to be sticky or tend to reiterate their previous recommendations. Moreover, during the observation period, analysts seem reluctant to issue recommendation
upgrades. The findings are possibly due to the period of plummeting global stock markets during 2007-2008.
From earnings forecast revisions, earnings forecast downgrades are found to comprise 38.53 percent of the 963 earnings forecast revisions issued. Earnings forecast upgrades are 37.38 percent and earnings forecast reiterations are 24.09 percent. The high proportion of earnings forecast downgrades may also be due to the observation period of 2006-2008, which contains a downturn cycle for international stock markets including Indonesia.
Similar to earnings forecast revisions, price target downgrades are found to be the most prevalent with a proportion of around 37.70 percent. Price target upgrades are 33.85 percent, while price target reiterations are 28.45 percent. The high proportion of price target downgrades appears to be caused by events during the observation period, which includes the international stock market downturn period.
In the present study, nine variables are employed, consisting of two dummy variables and seven continuous variables. The dummy variables represent stock recommendation upgrades and stock recommendation downgrades. The complete descriptive statistics of the variables used in this research is exhibited in Table 2.
From Table 2, the highest earnings forecast revision (EFR) is found to be 5.3917 times and was issued on 4 September 2008 by Danareksa Sekuritas (OD) on a state-owned coal mining company, PT. Bukit Asam, Tbk. (PTBA). The lowest earnings forecast revision is -0.9972 and the median is zero. The highest price target revision (PTR) is found to be 4.1282 times and was issued on 23 March 2007 by DBS Vickers Securities Indonesia (DP) on a cement producer, PT. Indocement Tunggal Prakarsa, Tbk (INTP). The lowest price target revision (PTR) is -0.9874 and the median is zero.
The highest client cumulative abnormal return (CCAR) is 0.2507 or around 25 percent. The lowest CCAR is -0.2507 and the median is 0.0052. The CCAR is accumulated from one day before the report date until four days after the report date. The highest market cumulative abnormal (MCAR) return is 0.6871 or 68.71 percent. The lowest MCAR is -0.6989 and the median is 0.0033. The MCAR is calculated from the release date of the report until ten days after the date of the release of the report.
The first part of the present study assesses the value of analyst report revisions for brokers’ clients. To investigate the value of analyst report revisions for the clients, an OLS cross sectional regression with Newey-West heteroskedasticity consistent coefficient covariance is run based upon model (13). The application of the Newey-West is performed to alleviate possible inference bias due to the large coefficient of variations of some variables. The regression result is presented in Table 3. As expected, upgrade stock recommendations positively affect client cumulative abnormal returns (CCAR), downgrade stock recommendations negatively affect CCAR, and price target revisions positively impact CCAR.
TABLE 2. Descriptive Statistics of Variables
D_UP D_DOWN EFR PTR CCAR ΔPINE MCAR ΔP ΔV
Mean 0.1340 0.1464 0.0335 0.0174 0.0080 -0.0813 0.0020 -0.0060 0.1967 Median 0.0000 0.0000 0.0000 0.0000 0.0052 -0.0543 0.0033 -0.0017 -0.0227 Maximum 1.0000 1.0000 5.3917 4.1282 0.2507 1.9844 0.6871 0.5764 4.2927 Minimum 0.0000 0.0000 -0.9972 -0.9874 -0.2507 -1.9726 -0.6989 -0.8784 -1.9343 Std. Dev. 0.3408 0.3537 0.4825 0.4661 0.0607 0.5534 0.1559 0.1138 0.8578 Observations 963 963 963 963 963 963 963 963 963 Notes:
D_UP = 1 if the stock recommendation revision is an upgrade, 0 if otherwise (dummy).
D_DOWN = 1 if the stock recommendation revision is a downgrade, 0 if otherwise (dummy).
EFR = Earnings Forecast Revision (continuous). PTR = Price Target Revision (continuous).
CCAR = client cumulative abnormal returns earned by broker’s client for the period of one day before until four days after the date of issue of the analyst report (continuous).
ΔPINE = Price Inefficiency (PINE) before the issue minus PINE after the issue of analyst report. The value is positive if the PINE before the issue is higher than the PINE after the issue (continuous).
MCAR = market cumulative abnormal returns for the period of ten days after the date of issue of the analyst report(continuous).
ΔP = the relative change of the stock price average ten days after the issue date against the stock price average ten days before the issue date (continuous).
ΔV = the relative change of the average stock transaction volume ten days after the issue date to the average transaction volume ten days before the issue date (continuous).
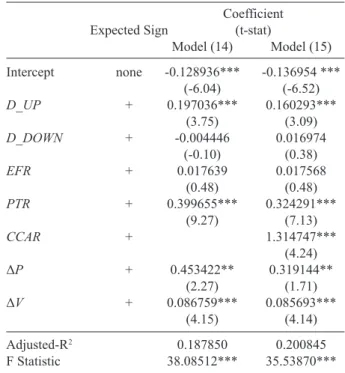
TABLE 4. Results of OLS Regression (with Newey-West
Heteroskedasticity Consistent Coefficient Covariance Regression) of as Dependent Variables. a)
Coefficient
Expected Sign (t-stat)
Model (14) Model (15) Intercept none -0.128936*** -0.136954 *** (-6.04) (-6.52) D_UP + 0.197036*** 0.160293*** (3.75) (3.09) D_DOWN + -0.004446 0.016974 (-0.10) (0.38) EFR + 0.017639 0.017568 (0.48) (0.48) PTR + 0.399655*** 0.324291*** (9.27) (7.13) CCAR + 1.314747*** (4.24) ΔP + 0.453422** 0.319144** (2.27) (1.71) ΔV + 0.086759*** 0.085693*** (4.15) (4.14) Adjusted-R2 0.187850 0.200845 F Statistic 38.08512*** 35.53870***
Notes: To investigate the impact of revisions on price informativeness, Eq. (14)
and (15) are used.
* p < .10; ** p < .05; *** p < .01
Contrary to expectations and previous studies, earnings forecast revisions do not affect CCAR. This outcome is contradictory to the findings of Aitken et al. (1996) and Lim and Kong (2004). Based on this result, it is plausible to conclude that broker’s clients in Indonesia do not pay significant attention to earnings forecasts. Instead, they tend to pay more attention to stock recommendations and price targets issued by the analysts.
The second part of the present study evaluates the impact of report revisions on price efficiency improvement. To test the impact of analyst report revisions on price efficiency improvement, OLS regressions with Newey-West heteroskedasticity consistent coefficient covariance are run based upon models (14) and (15). The complete regression results are presented in Table 4. The
model (14) regression indicates that upgrade revisions and price target revisions tend to improve price efficiency. However, earnings forecast revisions and downgrade revisions do not seem to improve price efficiency. Both control variables, price changes and volume changes, positively impact price efficiency.
The insignificance of earnings forecast revisions is in agreement with the first result, i.e. earnings forecast revisions do not impact CCAR. These results may indicate that clients and other market participants do not seem to respond to earnings forecast revisions. The insignificance
TABLE 3. Results of OLS (with Newey-West Heteroskedasticity
Consistent Coefficient Covariance) Regression Result of CCAR
on Dummy Upgrade (D_UP), Dummy Downgrade
(D_DOWN), Earnings Forecast Revision (EFR),
and Price Target Revision (PTR)
Expected Coefficient Sign (t-stat) Intercept none 0.005880*** (2.81) D_UP + 0.028166*** (6.04) D_DOWN - -0.018514*** (-3.81) EFR + -0.000376 (-0.10) PTR + 0.061728*** (13.43) Adjusted-R2 0.300828 F-statistic 104.4782***
Notes: The estimated model: CCARi = α0+ α1D_UPi + α2D_DOWNi +
α3EFRi + α4PTRi + ei
of downgrade revisions is possibly due to Indonesia Stock Exchange regulations that limit short-selling. This limitation makes downgrade recommendations, especially downgrades to “sell”, more difficult to follow by market participants who do not yet own the stocks.
Even after client cumulative abnormal return (CCAR) is included in model (15), the results are still consistent. The results of model (15) regression indicate that CCAR positively instigates price efficiency improvement. The finding confirms the conjecture that client trades will reveal information and impound more information into the stock price (Jones et al. 1994).
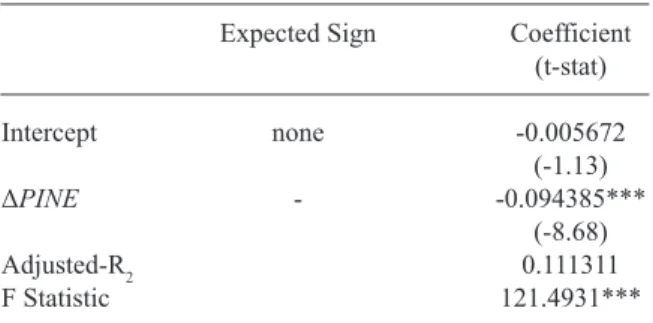
TABLE 5. Results of OLS (with Newey-West heteroskedasticity
consistent coefficient covariance) Regression of Market Cumulative Abnormal Return (MCAR) on Price Inefficiency
Improvement (ΔPINE)
Expected Sign Coefficient
(t-stat) Intercept none -0.005672 (-1.13) ΔPINE - -0.094385*** (-8.68) Adjusted-R2 0.111311 F Statistic 121.4931*** Notes: * p < .10; ** p < .05; *** p < .01
The final part of the present research investigates the impact of price efficiency improvement on cumulative abnormal returns accrued by the general market. The cross sectional OLS, with Newey-West heteroskedasticity consistent coefficient covariance, regression results of model (18) are presented in Table 5. The results indicate that price efficiency improvement tends to decrease the market cumulative abnormal return (MCAR). The finding appears to support the notion that price efficiency improvement will reduce the possibility for non-clients (market) to earn abnormal returns. This result also proves that equity analysts create positive externalities for the whole market by making stock prices reflect more relevant information or more informational efficient.
CONCLUSIONS
Employing sell-side analysts is costly for brokerage companies, therefore only certain brokerage companies can afford to hire them. The main objectives of the present study are to investigate whether equity analyst reports contribute to clients return and stock price efficiency improvement. In the first part of this study, as expected, upgrade stock recommendations are found to positively influence client cumulative abnormal returns (CCAR); downgrade stock recommendations are found to negatively affect CCAR; and price target revisions are found to positively impact CCAR. However, contrary to the expectation of the present study and previous
studies, earnings forecast revisions do not appear to affect CCAR.
In the second part of the present study, as expected, stock recommendation upgrades and price target revisions are found to tend to improve price efficiency. The control variables – price changes and volume changes – also positively impact price efficiency. However, contrary to expectations, stock recommendation downgrades and earnings forecast revisions do not appear to improve price efficiency. The results remain consistent even after considering CCAR as an additional explanatory variable.
The insignificance of downgrade revisions is possibly due to Indonesia Stock Exchange regulations that limit short-selling. The limitation makes downgrade recommendations, especially downgrades to “sell”, more difficult to follow by market participants who do not yet own the stocks. The insignificance of earnings forecast revisions is in agreement with the first result, specifically, earnings forecast revisions do not impact CCAR. As a result, the conclusion is made that clients and other market participants in Indonesia do not react to earnings forecast revisions. Further studies need to be performed to confirm this conjecture.
In the final part of this study, the improvement of price efficiency is found to tend to decrease market cumulative abnormal returns. This finding supports the notion that the more efficient the price, the less likely abnormal returns are to occur.
REFERENCES
Aitken, M., Frino, A. & Winn, R. 1996. Consensus analyst earning forecast and security return. Asia Pacific Journal of Management 13(2): 101-110.
Asquith, P., Mikhail, M. B. & Au, A. S. 2005. Information content of equity analyst reports. Journal of Financial Economics
75(2): 245-282.
Brav, A., & Lehavy, R. 2003. An empirical analysis of analysts’ target prices: short term informativeness and long term dynamic. Journal of Finance 58(5): 1933-1967.
Commerton-Forde, C. & Rydge, J. 2006. The current state of Asia-Pacific stock exchanges: A critical review of market design. Pacific-Basin Finance Journal 14(1): 1-32. Dimson, E. 1979. Risk measurement when shares are subject
to infrequent trading. Journal of Financial Economics
7(2): 197-226.
Ekaputra, I. A. & Asikin, E. S. 2012. Impact of tick size reduction on small caps price efficiency and execution cost on the Indonesia Stock Exchange. Asian Academy of Management Journal of Accounting and Finance 8(Supp.1): 1-13. Grossman, S. J. & Stiglitz, J. E. 1980. On the impossibility of
informationally efficient markets. The American Economic Review 70(3): 393-408.
Hasbrouck, J. & Schwartz. 1988. Liquidiy and execution cost in equity market. Journal of Portfolio Management 14(3): 10-16.
Huang, J., Mian, G. M. & Sankaraguruswamy, S. 2009. The value of combining the information content of analyst recommendation and target prices. Journal of Financial
Irvine, P. J. 2000. Do analysts generate trade for their firms? Evidence from the Toronto stock exchange. Journal of
Accounting and Economics 30(2): 209-226.
Ivkovic, Z. & Jegadeesh, N. 2004. The timing and value of forecast and recommendation revision. Journal of Financial
Economics 73(3): 433-463.
Jegadeesh, N., Kim, J., Krische, S. D. & Lee, C. M. 2004. Analyzing the analysts: When do recommendations add value? Journal of Finance 59(3): 1083-1124.
Jones, C.M., Kaul, G. & Lipson, M.L. 1994. Transactions, Volume and Volatility. Review of Financial Studies 7(4): 631-651.
Kim, J. H. & Shamsuddin, A. 2008. Are Asian stock markets efficient? Evidence from new multiple variance ratio tests.
Journal of Empirical Finance 15(3): 518-532.
Lim, T. K. & Kong, H. C. 2004. New evidence on price impact of analyst forecast revision. International Review of Financial
Analysis 13(2): 161-190.
Liu, J. & Thomas, J. 2000. Stock returns and accounting earning.
Journal of Accounting Research 38(1): 71-101.
Liu, Q., Rhee, S. G. & Zhang, L. 2012. Too Good to Ignore? A Primer on Listed Penny Stocks. Working Paper presented
in the 14th Malaysian Finance Association Conference.
Moshirian, F., Ng, D. & Wu, E. 2009. The value of stock recommendation: Evidence from emerging market.
International Review of Financial Analysis 18(1-2): 74-83. Tandelilin, E. & Lantara, I. N. 2001. Stabilitas dan prediktabilitas
beta saham: Studi empiris di BEJ. Jurnal Ekonomi dan Bisnis Indonesia 16(2): 164-176.
Irwan Adi Ekaputra (corresponding author) Department of Management
Faculty of Economics and Business, Universitas Indonesia UI Campus, Depok 16424, Indonesia
E-mail: [email protected]; [email protected]. C. Erna Susilawati
Faculty of Business, UnikaWidya Mandala, Surabaya Jl. Dinoyo 48A, Surabaya Jawa Timur 60265, Indonesia E-mail: [email protected]
Cynthia Afriani Utama Department of Management
Faculty of Economics and Business, Universitas Indonesia UI Campus, Depok 16424, Indonesia