Persistent link: http://hdl.handle.net/2345/bc-ir:107434
This work is posted on eScholarship@BC,
Boston College University Libraries.
Boston College Electronic Thesis or Dissertation, 2017
Copyright is held by the author, with all rights reserved, unless otherwise noted.
Essays on Corporate Finance and
Governance:
Boston College
Wallace E. Carroll Graduate School of Management
Department of Finance
ESSAYS ON CORPORATE FINANCE AND GOVERNANCE
a dissertation
by
VINH Q. NGUYEN
Submitted in partial fulfillment of the requirements for the degree of
Doctor of Philosophy in Finance
© Copyright by VINH Q. NGUYEN 2017
ACKNOWLEDGEMENTS
I would like to thank my advisor, Philip Strahan for guiding and supporting me over the years. I have highly appreciated the example of excellence that you have set for me as a researcher, mentor, and instructor. I thank my committee members, Mary Ellen Carter, Oguzhan Karakas, and Hassan Tehra-nian for their invaluable discussion and guidance through this process.
This dissertation could not have been completed without the great support that I have received from my family. Ha Lan, my beloved wife, your understanding, encouragement, sacrifices and endless love have been the support that I needed to overcome numerous challenges in the past five years. Thank you for always being by my side. Bach, my sunshine, you gave me the motivation to begin this journey and have always been my source of joy and encouragement. Lucario, you are the best thing that has happened this year and gave me the boost to finish this journey. We can’t wait to see you this July.
Finally, I thank my parents, parents-in-law, sister and brother-in-law for their love, support, and encouragement for my family and me throughout the years. I could never get to this point without any of you.
ESSAYS ON CORPORATE FINANCE AND GOVERNANCE VINH Q. NGUYEN
ADVISOR: Philip Strahan COMMITTEE:
Mary Ellen Carter, Oguzhan Karakas, Hassan Tehranian
ABSTRACT:
In my first essay, I explain the rise of transferable managerial skills in the CEO market. I show that growing competition in the product markets is a key factor driving the increased importance of CEOs’ transferable managerial skills, specifically industry-transferable skills. To rule out the endogeneity of CEO-firm matching, I exploit the exogenous shocks of the Canada-United States Free Trade Agreement (FTA) of 1989 and the deregulatory policy in the 1990s. I show that CEOs with these skills outperform in competitive markets and are a good match for firms’ innovation-based competition strategy.
In my second essay, we explain why firms in the same board-interlock networks tend to have similar corporate governance practices. Specifically, we utilize a novel instrument based on staggered adop-tions of universal demand laws across states to identify causal peer effects in firms’ decisions to adopt various governance provisions. We find that a firm’s propensity to adopt these provisions increases after other firms in the same board interlock network choose to adopt similar policies. The impact of universal demand laws on the incentives faced by directors as they seek to maximize their career outcomes is a likely mechanism explaining these effects.
In my third essay, I identify the effects of the gender of CEOs’ offspring on corporate performance. First, acquisitions, debt and equity offerings made by CEOs with more daughters are better received by the market. Second, CEOs with more daughters are less likely to overpay the targets, and better use newly raised capital. Third, CEOs’ daughter(s) decrease(s) corporate litigation risk. In sum, the gender of a child is arguably a random and natural experiment, which shows a clear effect on CEOs’ behavior.
ESSAYS ON CORPORATE FINANCE AND GOVERNANCE VINH Q. NGUYEN
TABLE OF CONTENTS 1. CEOs as Jacks of All Trades.
Do Executives with Multi-Industry Experience Help Firms Compete? . . . 1 2. Peer Effects in Corporate Governance Practices:
Evidence from Universal Demand Laws. . . .53 Co-authored with Pouyan Foroughi, Alan Marcus, and Hassan Tehranian
Chapter 1: CEOs as Jacks of All Trades. Do Executives with
Multi-Industry Experience Help Firms Compete?
1 Introduction
This paper explains the rising importance of industry-transferable skills over industry-specific skills in the market for chief executive officers (CEOs) over the last several decades. Top executives today tend to acquire business education, move across firms, and gain experience in multiple industries over the course of their career (Bertrand, 2009; Frydman, 2014). According to Lazear (2005), a chief executive officer should act as "a jack of all trades" who coordinates other employees with specialized skills. To play that role, top managers need transferable managerial skills rather than specific technical skills. Custódio et al. (2013, 2015) show that CEOs possessing transferable skills outperform in managing complex tasks and in generating innovations. Murphy and Zabojnik (2004, 2007) and Frydman and Saks (2010) argue that the rising importance of transferable skills explains the surge in CEO compensation. While this is an important trend, interestingly, no economic explanation has been made according to the best of my knowledge.
In the same period, competition has increased as a result of international trade liberalization (e.g. Ty-bout, 2003; Bernard et al., 2006), deregulation (e.g. Cetorelli and Strahan, 2006; Irvine and Pontiff, 2009), and lower business operating costs in general. Motivated by previous studies on the impacts of com-petition on corporate structure and operations (e.g. Guadalupe and Wulf, 2010; Cuñat and Guadalupe, 2009), I ask: Did increased competition induce the rise of industry-transferable skills in the market for CEOs? I find that it does. When competition increases, firms are more likely to retain incumbent CEOs who have greater industry-transferable skills. If companies replace the incumbent CEOs, the incoming CEOs tend to have greater industry-transferable skills than the departing ones. Further, CEOs with these skills outperform when the market becomes more competitive.
Consider Louis Gerstner, IBM’s chief executive officer from 1993 to 2002. Gerstner, formerly CEO of RJR Nabisco, was a senior manager at American Express and McKinsey & Company in his earlier career.
In April 1993, Mr. Gerstner took the position of chairperson and CEO at IBM to replace John F. Akers, who had spent his entire career at IBM. The company, once a dominant player in the personal computer (PC) market, faced intense competition from low-cost PC producers. Gerstner first decided to exit the retail desktop PC market and to enter the market of complete IT solutions and system integration. During his tenure, IBM’s market capitalization grew from around $30 billion to nearly $200 billion. Coming from unrelated industries, CEOs like Louis Gerstner brought transferable managerial skills, such as leadership, restructuring abilities, financial knowledge, and organizational skills to their new position.
Increased competition could raise the demand for industry-transferable skills for two reasons. First, in a competitive market, innovation allows firms to differentiate their products and services. Studies in economics and industrial organization have identified the link between innovation and the intensity of competition in the product markets. Schumpeter (1912), Aghion et al. (1999), and Knott and Posen (2003) show that innovation is more likely in competitive industries. This growth strategy requires that business leaders have the abilities and willingness to engage in risky but innovative projects. Compared with industry-specific skills, industry-transferable skills provide CEOs with more career outside options and thus both greater abilities and willingness to engage in breakthrough projects (Custódio et al., 2015). Hence, the demand for CEOs with industry-transferable skills would naturally go up when firms face higher product-market competition.
Second, the demand for CEOs’ transferable skills could come from the flattened structure of U.S. firms. Guadalupe and Wulf (2010) show that this change in the corporate structure itself came from rising competition in the product markets. To manage flatter corporations, CEOs need to process in-formation from different corporate areas quickly and to coordinate division managers with greater authority and division-specific knowledge. This development requires CEOs to have broad business experience and naturally leads to higher demand for CEOs with transferable managerial skills.
settings: firm fixed effects models; within-firm variation models with a quasi-natural experiment (the Canada-United States FTA of 1989); and deregulation policies in the 1990s.
First, I link CEO outcomes to measure of competition in a firm fixed effects setting. My measure for industry competition is based on two Herfindahl-Hirschman Indices (HHI), one calculated using SIC three-digit industries and the other based on the variable industry classification suggested by Hoberg and Phillips (2011). My measure of industry-transferable skills(Multi-Industry Experience) equals the number of industries at the SIC three-digit level where a manager worked before taking a CEO position. I find that incumbent CEOs possessing greater industry-transferable skills are less likely to be replaced but that this effect is only strong when competition is high. When competition is one standard deviation below average, an increase of one standard deviation inMulti-Industry Experiencereduces the propen-sity of CEO turnovers by 1.9 percentage points. When competition is one standard deviation higher than the mean level, the effects of one standard deviation inMulti-Industry Experienceincreases to 2.9 percentage points. This effect is economically large when compared with the average CEO turnover rate of 8 percent.
When firms in competitive markets decide to replace the current CEOs, executives with greater industry-transferable skills are more likely to be selected. Specifically, when the competition measure increases by one standard deviation, the industry transferable skill measure,Multi-Industry Experience, increases from 0.08 to 0.16 of a standard deviation. Moreover, I find some evidence that CEOs who have industry-transferable skills outperform when competition increases.
Executives are not randomly assigned to firms, but matched with firms to maximize the executives’ career objectives and the companies’ corporate outcomes. This endogeneity is a major obstacle to estimating how CEO skills affect outcomes (see, for example, Bertrand and Schoar, 2003; Fee et al., 2013). For instance, to protect its market position, a firm may increase investment in intellectual properties, raise customer loyalty, and increase customer switching costs. In such a case, the firms’ competition strategy could explain both their CEO selection and firms’ performance.
To overcome this identification challenge, my second approach combines the within-firm variation of segment data with a quasi-natural experiment, the Canada-United States FTA of 1989. Following the passage of the agreement, all tariff barriers between the two countries were eliminated (Trefler, 2004). Thus, an industry which was protected by a higher tariff rate in the pre-FTA period would face a larger increase in competition in the post-FTA period. This allows me to use the pre-FTA tariff rates as a measure of heterogeneous treatment effects of the FTA on different industries.
Segment data allow me to assess the impacts of CEO’s industry-transferable skills on the perfor-mance of a more affected segment, relative to his/her effects on the perforperfor-mance of a less affected one withinthe same firm-year. The within-firm variation of segment data enables me to identify the effects by includingfirm-year fixed effectsin my models. As the fixed effects absorb all firm and CEO unobserv-ables, my estimation cannot be affected by CEO-firm matching decisions made at the firm level. Chief executives who have greater industry-transferable skills are more successful in maintaining revenue growth and profitability than ones who have lesser industry-transferable skills; and crucially, the effects are stronger in segments which were more exposed to the FTA after the passage of the trade agreement. My results are robust to the inclusion of different fixed effects and control variables for CEO and firm characteristics. Consistent with results in the first setting, I also find that increased international com-petition causes companies to retain and to recruit CEOs who have greater industry-transferable skills. Third, I examine the effects of product-market deregulation. I analyze two important deregulations in the 1990s: the National Energy Act of 1992 in the electricity sector and the Telecommunications Act of 1996 in the telecommunications industry (Andrade et al., 2001; London, 2004; Irvine and Pontiff, 2009). Consistent with previous results, CEOs with greater industry-transferable skills are more likely to be retained after deregulation. In the telecommunications sector, CEOs possessing greater industry-transferable skills achieve higher revenue and profit growth in deregulated industries.
In my analysis of the mechanisms, I find that CEOs with greater industry-transferable skills to undertake innovative but risky projects more when market competition increases. CEOs who have
these skills tend to pursue riskier but more innovative projects by investing more in Research and Development (R&D). My analysis further indicates that CEOs’ industry-transferable skills positively impact innovative activities by generating more patents and citations. Both effects are stronger in industries facing higher competition.
To the best of my knowledge, this is the first paper explaining the rising trend toward transferable managerial skills in the market for CEOs. The literature has documented the trend but not explained what drive it. Murphy and Zabojnik (2007), and Lazear (2005) suggest that modern-day entrepreneurs tend to possess transferable managerial skills. Custódio et al. (2013, 2015) show that the market com-pensates more for CEOs who have these skills. Transferable managerial skills have increased in value over the last several decades; firms are more likely to choose external candidates for the CEO position now than they were several decades ago (Huson et al., 2001; Murphy and Zabojnik, 2007; Frydman, 2014). My paper identifies increased competition as a key force behind this movement in the CEO market.
The rest of the paper is structured as follows. In Section 2, I discuss the data, empirical strategy and main results for the firm fixed-effects models. Section 3 discusses the institutional background of the Canada-United States FTA and presents my empirical strategy. Section 4, I discuss the set of tests under the setting of deregulation. I conclude in Section 5.
2 Firm Fixed-Effects Models
The trend toward transferable managerial skills in the market for CEOs has started since at least 30-40 years ago (Bertrand, 2009). In this part, I estimate firm fixed-effects models to examine the role of product-market competition in this trend. To measure variation in competition from various sources, I construct variable,Competition, based on the HHI. This index, as a measure of competition, was found in industrial organization theory and is widely used in economic literature (Curry and George, 1983; Tirole, 1988). Moreover, this analysis allows me to generalize findings in this paper by using a recent sample of CEOs from 1999 to 2012.
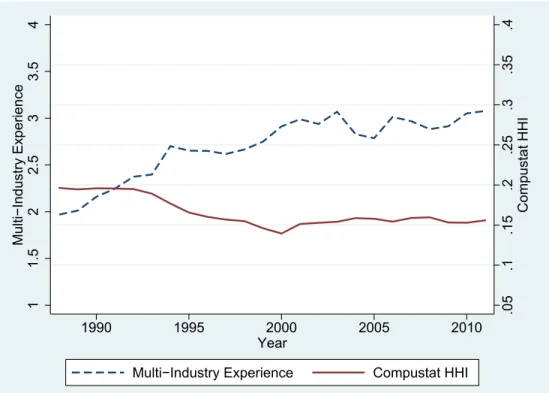
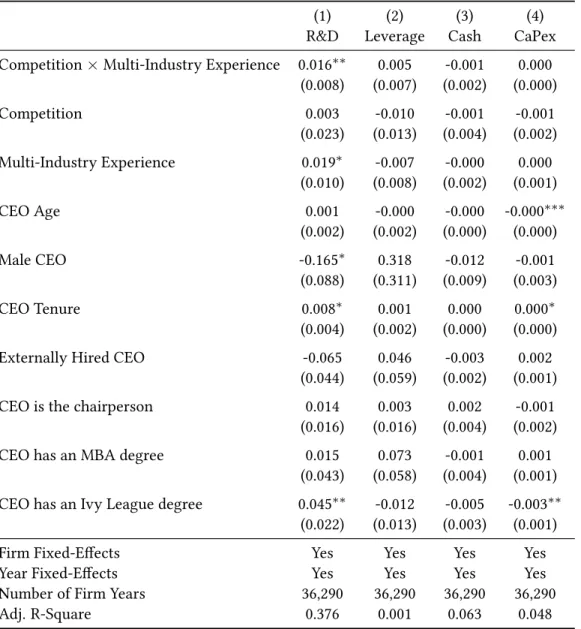
I first document a trend toward CEOs with greater industry-transferable skills in competitive indus-tries. To illustrate this trend, Figure 1 plots the HHI and CEOs’Multi-Industry Experience. Both variables are weighted by total assets. The HHI is calculated using Compustat revenue for non-financial indus-tries at the SIC-three digit level in the period from 1985 to 2012. The graph presents opposite trends in the HHI, lower/higher HHI means higher/lower competition, and CEOs’Multi-Industry Experience. These trends were strongest in the 1980s and 1990s reflecting the significant increase in product-market competition as a result of deregulatory policies and trade liberalization in this period. Since early 2000s, the trends in both competition and CEOs’Multi-Industry Experiencehave been weaker. This figure sug-gests a positive correlation between product-market competition and the demand for CEOs possessing industry-transferable skills.
[Figure 1 about here]
2.1.Data Description
Industry Transferable Skills- I chooseMulti-Industry Experience, the number of industries at the SIC three-digit level in which an executive has experience before taking a CEO position, to be the measure of industry-transferable skills. This measure is constructed using BoardEx database. I start with all directors who have held CEO title according to BoardEx.1 The database provides directors’ biography which contains the name, past positions, start time, and end time for each position. To obtain firms’ SIC code, I match companies in the biographies to CRSP using CUSIP. For the firms which are not included in CRSP, I look up their SIC codes in a company information database,www.buzzfile.com. As executives can increase their human capital in response to changes in the market for CEOs, reverse causality is a concern in constructing this measure. To minimize this concern, I exclude from the mea-sure all positions such as board seats or advisory positions at other firms after an executive has taken a CEO position. The measureMulti-Industry Experience, therefore, is constant during each CEO tenure. 1A conditition for CEOs to be reported in BoardEx is that the CEOs must hold positions in public firms in 1999. Analyses
using BoardEx for pre-1999 periods is potentially subjected to this survivorship bias. Therefore, my analysis in this part only use the sample of CEOs in the post-1999 period.
For the convenient interpretation of the results, variableMulti-Industry Experienceis standardized to have mean zero and standard deviation one.
Product Market Competition- In this setting, I define the competition measure,Competition, as one minus the HHI. I estimate the HHI using two methods: the Compustat HHI at the SIC three-digit industry level and the TNIC3 HHI suggested by Hoberg and Phillips (2011).2For the Compustat HHI, I group firms into industries according to their pre-assigned SIC codes, then, calculate the index using the companies’ annual revenue. The Compustat HHI provides a yearly measure of competition intensity. One shortcoming of the Compustat HHI is that companies are rarely reassigned new SIC code when the firms enter a new industry. To overcome this issue, Hoberg and Phillips (2011) suggests classifying firms using the product description taken from firms’ SEC filings. According to their method, firms with similar product descriptions are more likely to compete in the same industry. Since firms update the product description in their filings annually, this classification accounts for the movement of a firm across industries. In both methods, the HHI ranges between zero, for most competitive industries, and one, for least competitive industries.
Innovation - I construct two measures for corporate innovation using the NBER Patent Citation database created by Hall et al. (2001). The sample period is from 1999 to 2006. The first measure is the number of patent applications that are filed in a year and eventually granted to a firm. To assess the importance of the patents, the second measure is the number of citations that a company’s patents receive each year. These measures are subject to two truncation problems in the NBER database. The first problem arises since the database only reports patent applications after the patents are granted. On average, the lag between patents’ application year and grant year is about two years. Hence, patents, applied before 2006 but granted in later years, do not show up in the sample. The second problem arises as a patent may receive citations for many years but the database only reports the citations up to 2006. Follow Hall et al. (2001), I estimate the patent application-grant distribution and the citation-lag distribution to correct for the truncation problems in the number of patents and citations.
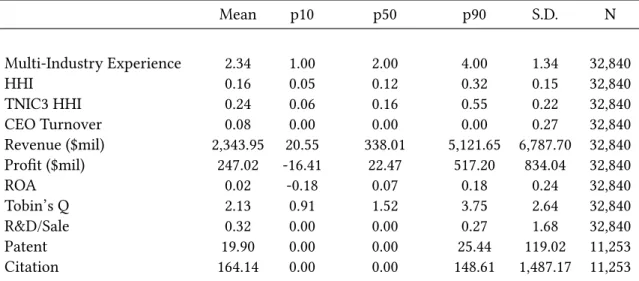
Control variables for CEO characteristics such as age, externally versus internally hired, and edu-cation are collected from BoardEx. Firm accounting variables are collected from Compustat and win-sorized at 1 percent and 99 percent levels. Panel A of Table 1 reports the statistics of the main dependent and independent variables in this setting.
[Table 1 about here]
2.2.Empirical Analysis and Results
In the first set of tests, I examine whether increased competition would affect firms’ decision to retain incumbent CEOs if the chief executives possess industry-transferable skills. I create a dummy variable,CEO Turnover, which equals to one if a CEO is replaced at the end of the financial year and equals to zero, otherwise. In the models, I regressCEO Turnoveron the competition measure, CEOs’ industry-transferable skills, the interaction of the two variables, firm fixed effects, and year fixed effects. The estimated coefficient on the interaction term shows the effects of CEOs’ industry-transferable skills on the propensity of CEO turnovers when competition increases. The regression equation is as follows:
(1) CEO T urnoveri,j,t=α+β1Competitionj,t×Multi-Industry Experiencei,t
+β2Competitionj,t+β3Multi-Industry Experiencei+β4CEO Controlsi,t +FirmFEj+YearFEt+i,j,t
If industry-transferable skills lower the turnover propensity of CEOs in a competitive market, the coefficient on the interaction term should be negative and significant. Table 2 reports the results of these models. In Columns (1) to (2),Competitionis based on the Compustat HHI; in Columns (3) and (4), the variable is based on the TNIC3 HHI. The coefficient of the interaction term is negative and significant at the 10 percent level in the first model and the 5 percent level in the remaining three models. When competition is one standard deviation below average, an increase of one standard deviation in Multi-Industry Experiencereduces the propensity of CEO turnovers by 1.9 percentage points (equals to the sum ofβ1andβ3). When competition is one standard deviation higher than the mean level, the effects
of one standard deviation inMulti-Industry Experienceincreases to 2.9 percentage points. Compared with the average CEO turnover rate of 8 percent, these results indicates a large impact of industry-transferable skills and product-market competition on CEOs’ turnover propensity.
[Table 2 about here]
Next, I check whether increased competition would make firms choose executives with greater industry-transferable skills when the firms decide to replace the incumbent ones. Specifically, I regress my measureMulti-Industry Experience on Competition, firm fixed effects, and year fixed effects. A possible concern in this test is that my results could be driven by other CEO characteristics that are correlated with industry-transferable skills. To address this concern, I estimate similar models in which other CEO characteristics are regressed onCompetition. The concern is negligible if the coefficient on Competitionis insignificant in these models.
Since most of these CEO characteristics only vary when CEO turnovers happen, the sample for these tests consists of the first year when an executive takes a CEO position. For example, CEO A joint Firm 1 in 2000 and is replaced by CEO B in 2007. In my sample, Firm 1 provides two observations. When I include firm fixed effects, the estimated coefficient ofMulti-Industry ExperienceonCompetition indicates how much the difference inMulti-Industry Experiencebetween CEO A and CEO B could be explained by the difference in variableCompetitionof Firm 1 between 2000 and 2007. In the 1999-2012 period, there are 5,464 CEOs in my sample. The coefficient on variableCompetitionshould be positive and significant if increased competition drives up the demand for CEOs’ industry-transferable skills.
Table 3 reports results of these models. Panels A and B present the results of regression models in which variableCompetitionis based on the Compustat HHI and TNIC3 HHI, respectively. Column (1) of both panels shows that the growth inCompetitionis positively correlated with the increase in CEOs’Multi-Industry Experience. The coefficient is positive and significant at the 1 and 5 percent levels. The magnitude of the coefficient is significantly large, one standard deviation increase in industry competition explains from 0.08 to 0.16 standard deviation increase in CEOs’ industry-transferable skills.
These results indicate that firms choose executives possessing greater industry-transferable skills when they replace their incumbent CEOs.
In Column (3) of panel A, the coefficient onCompetitionis positive and significant at the 10 percent level. I expect this result since the number of industries and the number of firms that an executive gains experience in are highly correlated. The correlation between these two variables is 0.73 in my sample. However, whenCompetitionis measured base on TNIC3 HHI, Column (3) in panel B, the coefficient is insignificant. In the remaining Columns, the coefficient is insignificantly different from zero. These tests indicate that other CEO characteristics are unlikely to drive my results.
[Table 3 about here]
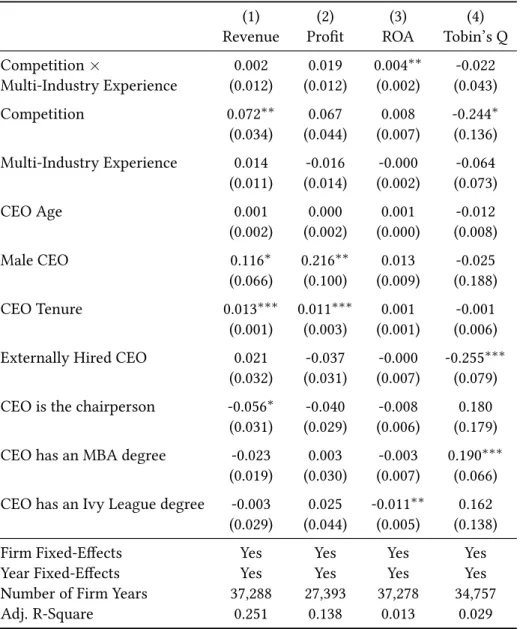
The results in Table 3 show that the intensity of competition could cause firms to select new CEOs who have greater industry-transferable skills. My next set of tests aims at answering why CEOs with transferable skills are preferred in a competitive market. My conjecture is that industry-transferable skills allow CEOs to outperform when competition intensifies. To test this hypothesis, I regress four measures of firm performance the logarithm of revenue, the logarithm of operating profit, return on assets (ROA), and Tobin’s Q onCompetition,Multi-Industry Experience, the interaction of the two variables, firm fixed effects, and year fixed effects. If CEOs’ industry-transferable skills positively affect firms’ performance in a competitive market, the coefficient on the interaction term should be pos-itive and statistically significant. Table 4 reports the results of these regressions. Out of the four models, the estimated coefficient in the models for ROA is positive and significant at the 5 percent level. In an average competition market, greater CEOs’ industry-transferable skills, one standard deviation higher inMulti-Industry Experience, do not have significant impacts on firms’ performance. However, in a high competition market, one standard deviation higher inCompetition, greater CEOs’ industry-transferable skills positively impact firms’ performance. One standard deviation higher inMulti-Industry Experience is correlated with a 0.4 percentage point increase in ROA. These results suggest that the positive impact of industry-transferable skills on firm performance in a competitive market could be the underlying
reason for the growing demand for CEOs’ industry-transferable skills.
[Table 4 about here] 2.3.Channels of Effects
When barriers to entry are removed, new entrants supply similar products and services to those offered by existing players and drive down the average profitability of the sector. To maintain monopo-listic profit, existing firms need to raise new barriers by achieving technological patents or intellectual properties, investing in brand identity, or increasing customer switching costs. Aghion et al. (2001) in-dicate that competition could incentivize firms to invest in research and development (R&D) since the incremental profits from innovating are higher in a competitive market. Executives with transferable skills are a good match for the CEO position in such an environment. These skills have been shown to impact firms’ innovation outputs positively. Custódio et al. (2015) find that firms led by CEOs with greater transferable skills generate more patents and acquire more patents through mergers and ac-quisitions. Their patents are also more important, as measured by the number of citations, and more exploratory (i.e., involving riskier research for new technologies) than those of firms led by CEOs with firm-specific skills. The authors suggest that CEOs who have transferable skills could help the firms generate more innovation since these skills reduce career risk and thereby allow them to pursue risker but more breakthrough projects. My results in the previous tests are consistent with this argument: as competition increases, firms tend to retain and to select executives who possess greater industry-transferable skills for the CEO position. To further test this channel of effects, I estimate regression models in which R&D and corporate innovation are regressed on the interaction ofCompetitionand Multi-Industry Experience.
[Table 5 about here]
Table 5 presents the results for research and development activities. The sample consists of non-financial Compustat firms from 1999 to 2012. In Column (1), R&D, normalized by revenue, is the depen-dent variable. The results show that CEOs’ industry-transferable skills positively impact R&D in a high
competition market. The coefficient on the interaction ofCompetitionandMulti-Industry Experienceis positive and significant at 5 percent level. In a high competition market, an increase of one standard deviation in CEOs’Multi-Industry Experienceleads to 1.2 percentage point increase in the R&D to rev-enue ratio. For comparison, in Columns (2) to (4), I estimate similar models in which different measures for corporate risk taking, leverage, cash holdings, and capital expenditure, are the dependent variable. In these models, the coefficient on the interaction term is statistically insignificant. The results indicate that CEOs’ industry-transferable skills make the firms invest more in innovative activities rather than just taking more risks in general.
Next, I test the direct effects of CEOs’ industry-transferable skills on innovation outputs, measured by the logarithm of the number of patents and the logarithm of the number of citations, is the depen-dent variable. Table 6 reports the results of these models. In Columns (1) and (2), the coefficient on the interaction term is positive and significant at the 10 and 5 percent levels, respectively. In a high compe-tition market, one standard deviation increase in CEOs’ industry-transferable skills is associated with 3.3 percent growth in the number of patents. In the models for citations, Columns (3) and (4), I obtain similar results, one standard deviation increase in CEOs’ industry-transferable skills is associated with 6.1 to 6.3 percent growth in the number of citations. In all models, the coefficient is significant at the 5 and 10 percent levels. These results suggest that the corporate innovation channel is one mechanism leading to the rising demand for CEOs’ industry-transferable skills in a competitive market.
[Table 6 about here]
Another possible channel of effects is through the changes in corporate structure which require CEOs to have transferable skills. Using a proprietary dataset on the structure of 300 large U.S. firms, Rajan and Wulf (2006) show that firms’ organizational structure has been flattened. In that structure, more managers report directly to the CEO, and the CEO delegates more authority to lower-level man-agers. Guadalupe and Wulf (2010) use the same data and show that market competition plays a major role in that organizational change. The findings in these two papers suggest that modern CEOs must
interact with more divisional employees within their firms and are likely to have a boarder set of skills. Since a similar data on organizational structure is not available for my study, I could not directly test this channel of effects. However, the change in corporate structure in response to increased competi-tion also could be another channel explaining the rising importance of industry-transferable skills in the CEO market.
3 The Canadian-United States Free Trade Agreement
In this section, I discuss the second set of analysis using the Canada-United States FTA to address several identification concerns of firm fixed-effects models. First, the actual HHI is not available for all industries and in all years. The most precise estimate of the index, provided by the Department of Commerce, only covers manufacturing sectors and is released every five years. The Compustat HHI does not include private and foreign companies. The TNIC3 HHI provides better industry classifications but, similar to the Compustat HHI, covers only public firms. Second, firm fixed-effects models cannot address firm time-variant unobservables in CEO-firm matching. This endogeneity is a major challenge in identifying the effects of CEOs’ industry-transferable skills on companies’ performance.
To overcome these concerns, my second empirical setting takes advantage of the within-firm vari-ation of segment data and an exogenous shock to product-market competition from the unexpected passage of the Canada-United States FTA in 1989.
3.1.Institutional Background
I take advantage of the unexpected passage of the Canada-United States FTA in my identification strat-egy. The trade agreement led to a short period of CEO-firm mismatch allowing me to identify the main questions in this paper.
The Canada-United States FTA in 1989 is the second trade agreement between the United States and another country.3In 1985, the idea for a bilateral free-trade agreement was advanced by the Canadian Prime Minister Brian Mulroney and embraced by the US President Ronald Reagan. Negotiations for the
agreement were started in May 1986 and concluded in October 1987. Both countries agreed to phase out most of the tariff barriers over a ten-year period. The Canada-United States Free Trade Agreement substantially increased trade between the two nations (Clausing, 2001; Romalis, 2007). To illustrate the impacts of the agreement on the Canada-US trade, Figure 2 presents the growth of U.S. imports from Canada, grouped based on different tariff levels, and the growth of similar products imported from the other countries. For U.S. imports from Canada, there is a strong positive relationship between the pre-FTA tariff levels and the increase in imports following the passage of the FTA. However, for U.S. imports from the other countries, there is no significant difference in the growth of U.S. imports in each group of products. Moreover, for the group of tariff-free products, there is no significant difference in the growth of U.S. imports from Canada and of those from other countries. The figure evidences that the passage of the agreement positively affected the growth U.S. imports from Canada, particularly for the products in high tariff brackets.
[Figure 2 about here]
In Canada, the negotiated agreement, however, was highly controversial and was not expected to be approved. Two opposition parties, the Liberal Party of Canada and the New Democratic Party, strongly opposed the FTA and used their majority in the Senate to block the trade agreement. The agreement became the most important issue for the election in October 1988. Although a majority of the voters had voted for the two opposition parties, The Progressive Conservative Party of the prime minister won a governing majority allowing the Canadian Senate to pass the agreement into law. The FTA came into effect on January 1st, 1989. The high contest over the Canada-United States FTA and the unexpected outcome are the key features making the agreement a likely exogenous shock to product-market competition in the two countries.
The United States and Canada are the world’s largest bilateral trade partners.4Given the size of the two economies and the high elasticity of substitution (Head and Ries, 2001), the impacts of the FTA on
the US economy and Canada’s economy were significant. Romalis (2007) shows that for commodities that experienced deepest US tariff cuts, Canada’s share of US imports almost doubled in 5 years after the agreement. Trefler (2004) finds that the trade agreement significantly increased the productivity of Canadian firms. Industries, most protected by Canadian tariffs before the agreement, reduced em-ployment by 12 percent and raised labor productivity by 15 percent after the tariffs were phased out. In industries, facing the highest level of US tariffs before the FTA, labor productivity increased 14 per-cent after the FTA. Guadalupe and Wulf (2010) find that American firms change their organizational structure in response to the growing competition from Canadian products.
The unexpected passage and significant impacts of this trade agreement make it an arguably quasi-natural experiment for my study.
3.2.Sample Construction
Segment Data - The sample for my main hypothesis tests starts with all segment-years reported in Compustat’s Historical Segments during the period from 1984 to 1994. Since 1976, the Statement of Financial Accounting Standards No. 14 (FAS 14) of the Financial Accounting Standard Board (FASB) has required firms to report information about segments of which sales, assets, or profits account for over 10 percent of consolidated totals. While 10 percent is the threshold for reporting requirement, firms often continue disclosing information when sales or profit of a business segment falls below 10 percent of the totals. Following previous studies, I include those firm-segments in my sample. Compustat’s Historical Segments identifies firms using Global Company Key (GVKEY) and one unique identification number (SID) for a segment of the company. GVKEY is the identification that I use to match segment data with other datasets for firm-level variables. Combining GVKEY and SID, I can track different segments within a firm over my sample period. Since I am only interested in business segments, I exclude other types of reported segments such as geographical segments, operating segments, and state segments. Following Hoechle et al. (2012) and others, I exclude firms in the financial industries (SIC code 6000-6999) and American Depository Receipts (ADR) from my sample. I impose two additional filters to ensure that the sample is appropriate for my empirical strategy and to reduce the hand-collecting requirement
to construct the measure of industry-transferable skill. First, each segment must be reported in, at least, two years before 1989 and two years after 1989. I exclude all segments which do not meet this requirement. Second, for a firm-year to be included in the sample, it must have at least two reported segments. After applying these filters, I match the data with the CEO data constructed in the next step. Treatment Effect - The effects of the FTA on each business segment are measured by the pre-1989 tariff level applicable to Canadian imports in that segment. Because the tariff phase-out process for each sector varies from zero to ten years, the choice of the phase-out time may be endogenously affected by factors such as lobbying, negotiations, and the relative importance of each sector in the US economy. To address this concern, I follow Guadalupe and Wulf (2010) in constructing variableTariffs_89which is the three-year average tariff rate on Canadian imports by the segment’s SIC four-digit code in the pre-FTA period from 1986 to 1988. I calculate the US tariffs on Canadian imports by dividing duty by customs value. The yearly values of duty and customs are available on the website of the Center for International Data at the University of California at Davis.Tariffs_89is matched with firm and segment data using SIC codes. This measure quantifies treatment effects of the FTA on US companies and segments. Within my sample, the variable ranges from zero to 21 percent. For convenient interpretation of results, I standardize this variable to have mean zero and standard deviation one. I create dummy variablePost indicating 1989 and following years in the sample period.
Industry-Transferable Skills- As in the previous part, the measure of CEOs’ industry-transferable skills isMulti-Industry Experience, the number of industries at the SIC three-digit level in which an ex-ecutive has experienced before taking a CEO position, to be the measure of industry-transferable skills. This variable is also standardized to have mean zero and standard deviation one. A condition for CEOs to be reported in BoardEx is that the executives must hold positions in notable firms in 1999. Therefore, analyses using BoardEx for pre-1999 periods are potentially subjected to this survivorship bias (Custó-dio et al., 2013). My identification strategy based on three differences could partly mitigate this concern. Specifically, the survivorship bias could affect my estimation only if the probability of being included in BoardEx is correlated with all three differences: the passage of the FTA, CEOs’ industry-transferable
skills, and the pre-1989 tariff levels. Moreover, to address this concern directly, I hand-collect a sample of 262 CEOs of my sample firms who cannot be identified in BoardEx.5 I first estimate all regression models on the sample of 696 CEOs from BoardEx, then, re-estimate the models on a combined sample of hand-collected CEOs and CEOs from BoardEx. If the difference between the estimation from the two sample is negligible, the effect of this survivorship bias is likely to be insignificant.
I use other CEO characteristics such as age, gender, tenure, and education background as con-trol variables. After merging this CEO data with the segment data, I end up with a sample of 15,483 CEO-segment-year observations. The statistics of the main dependent and independent variables are presented in Panel B of Table 1.
3.3.Empirical Strategy and Results
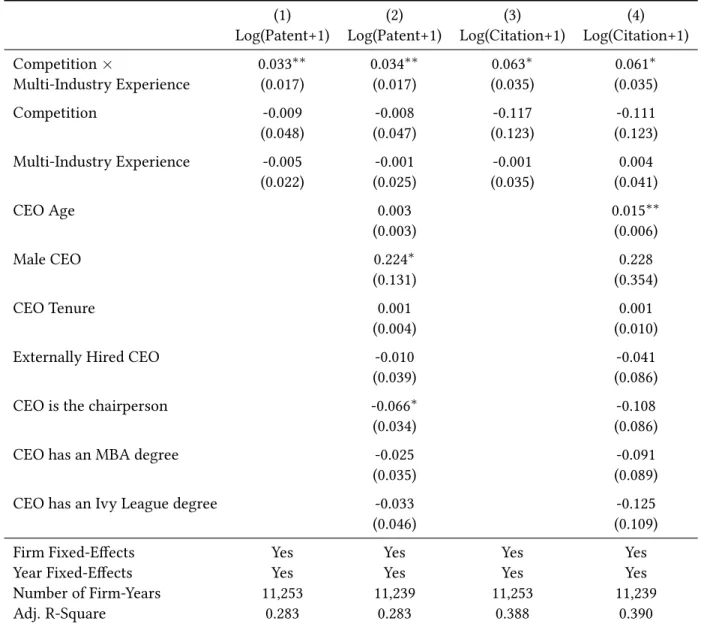
To determine whether there is a causal relation between market competition and the demand for CEOs’ industry-transferable skills, I first investigate the change in the CEO market following the pas-sage of the FTA. If increased competition from international trade liberalization contributes to the value increase of industry-transferable skills in the market for CEOs, executives with greater Multi-Industry Experience will be more preferred than executives with lesserMulti-Industry Experience fol-lowing this trade agreement. Firms should try to retain incumbent CEOs who have greater industry-transferable skills. To test this in a differences-in-differences framework, I subdivide my CEO sample into high industry-transferable skills and low industry-transferable skills, based on whether a CEO’s Multi-Industry Experienceis greater than the median value of 2. I then estimate the following specifi-cation on each sample:
CEO T urnoverj,t =α+β1Postt×Weighted T ariffs_89j+CEOControlsj,t+FirmFEj+YearFEt+j,t (2) whereCEO T urnoverj,tindicates whether the CEO is replaced by the end of the year;Posttindicates 1989 and subsequent years;Weighted Tariffs_89jis the segment-revenue-weighted tariff rate of the firm
5The information about the biography of these CEOs come from the combination of SEC filings, International Directory
from 1986 to 1988;CEO Controlsj,tis a vector of control variables for CEO characteristics;FirmFEjare firm fixed effects; andYearFEjare year fixed effects.
[Table 7 about here]
Table 7 presents the results of this set of tests. Columns (1) and (3) report the estimated coefficients for the sample of executives who could be identified in BoardEx database. In Column (1), the test on the subsample of chief executives who have worked in two or fewer industries indicates that the passage of the FTA increases the turnover propensity. The coefficient on the interaction term is positive and significant at the 10 percent level. After the passage of the FTA, one standard deviation higher in the tariff rates is correlated with 1.7 percentage point increase in the turnover propensity. Likewise, for the subsample of CEOs who have worked in more than two industries, the passage of the FTA has insignificant effects on the turnover propensity. I obtain similar results for the test on the combined sample of BoardEx data and hand-collected data. In Column (2), the coefficient on the interaction of Postdummy andWeighted T ariffs_89is positive and significant at the 5 percent level. CEOs in firms which were protected from Canadian imports before 1989 face a higher chance of turnovers following the passage of the FTA. After the passage of the FTA, one standard deviation higher in the tariff rates is correlated with 2.0 percentage point increase in the CEO turnover rate. For the group of CEOs with experience in more than two industries, Column (4), the passage of the Canada-United State FTA does not have a significant impact on the propensity of CEO turnovers. These results indicate that when product markets become more competitive, firms are more likely to retain the chief executives who possess greater industry-transferable skills than ones who have lesser industry-transferable skills.
So far, I have shown that companies are less likely to replace CEOs with industry-transferable skills when product-market competition increases. To further test the impacts of product-market competi-tion on the CEO market, I check whether firms choose executives with greater industry-transferable skills for the CEO position when competition increases. I estimate a differences-in-differences model in whichMulti-Industry Experiencej,tis regressed on the interaction term ofWeighted Tariffs_89j and
Postt, firm fixed effects, and year fixed effects. As in firm fixed-effects models, I use a sample of CEO positions rather than the full panel data. Table 8 reports the results of different regression specifications for this test. In all specifications, the coefficient on the interaction term is positive and statistically sig-nificant at the 5 percent level. A positive coefficient of the interaction term indicates that firms choose executives with greater industry-transferable skills for the CEO position after the FTA removed the tar-iff protection. Specifically, after the passage of the FTA, a firm with one standard deviation higher in the pre-FTA tariff level selects a new CEO who has 0.16 to 0.19 standard deviation higher inMulti-Industry Experience.
[Table 8 about here]
The purpose of the next set of tests is to examine whether CEOs who have industry-transferable skills are preferred because they can deliver higher performance in competitive environment. A major challenge in making a causal inference about the relationship between CEO characteristics and firms’ performance is the endogeneity of CEO-firm matching. The early seminal work of Bertrand and Schoar (2003) recognized this important empirical problem. The firm fixed effects or differences-in-differences approach using firm-level data only address endogenous matching based on time-invariant firm char-acteristics. To address this empirical challenge, I rely on the with-in firm variation of segment data and the exogenous shock to product-market competition from the passage of the Canadian-United State FTA. The intuition for these segment-level tests is that in a conglomerate with two business segments, the CEO is selected as the ultimate decision makers for both segments. Since each segment within the firm has a different level of exposure to the FTA, the CEO’s performance in the more affected segment could be compared to his/her owner performance in the less affected segment. The segment data also allow me to includefirm-year fixed effects which absorb almost all CEO and firm unobservables. Be-cause both segments are in one firm-year and managed by the same CEO, the endogenous CEO-firm matching does not affect my estimation. My identifying assumption is that without the Canada-United States FTA, the growth, before and after 1989, in the performance of all segments are insignificantly
different.
I first use differences-in-differences models to test the impacts of CEOs’ industry-transferable skills on segments’ performance after the passage of the FTA. As in the earlier tests, I split my sample into one for CEOs withMulti-Industry Experienceof 2 and under and the other for CEOs withMulti-Industry Experienceof over 2. On each subsample, I then test the following regression model:
(3) Segment Outcomesi,j,t = α+β1Postt×T ariffs_89i,j+β2T ariffs_89i,j
+Firm-YearFEj,t+i,j,t
wherei,j andtdenote segmenti, firmj, and yeart. Segment Outcomesi,j,tare the segment-level out-comes of interest;Posttis a dummy which is equal to 1 for 1989 and subsequent years and zero, other-wise;Tariffs_89i,jis the average tariff rate of the segmentiin firmjfrom 1986 to 1988;Firm-Year FEj,t is a series of fixed effects for each pair of firm-year. The coefficient of interestβ1estimates the impacts of the trade agreement on a more affected segment relative to the impacts on a less affected segment in the same firm-year.
Two available measures for segment performance are the logarithm of segment revenue, variable SALES in Compustat’s Historical Segments data, and segment return on assets (ROA), measured as the ratio of OPS to IAS. Table 9 reports the results of these tests. For the subsample of CEOs with Multi-Industry Experienceof 2 and under, the coefficient onPostt×T ariffs_89i,jis negative and statistically significant for the segment ROA models. Specifically, one standard deviation higher in tariff protection against Canadian imports is associated with a 1.6 to 2.5 percentage point drop in segment ROA after the tariffs are phased out. On the other side, the passage of the FTA seems to have no significant impact on the ROA and revenue of segments managed by CEOs withMulti-Industry Experienceof over 2. These results indicate that CEOs with greater industry-transferable skills are more successful in maintaining segment profitability than those with lesser industry-transferable skills when competition increases.
I then use a differences-in-differences-in-difference method to formally test the results in Table 9. The regression equation is as follows:
Segment Outcomesi,j,t=α+β1Multi−Industry Experiencej,t×Postt×T ariffs_89i,j
+β2Multi−IndustryExperiencej,t×T ariffs_89i,j
+β3Postt×T ariffs_89i,j+β4T ariffs_89i,j+Firm-Year FEj,t+i,j,t
(4)
The coefficient of interest is on the interaction of Multi-Industry Experiencej,t, Postt and
T ariffs_89i,j. The estimated coefficients are reported in Table 10. In both segment revenue models and segment ROA models, the estimated coefficient on the interaction term is positive and statistically significant. A positive coefficient indicates that CEOs who have greater industry-transferable skills are more successful in growing revenue and operating profits in segments which were more affected by the FTA passage. One standard deviation higher inMulti-Industry ExperienceandTariffs_89 leads to a 4.2 percent to 5.6 percent increase in segment revenue and a 0.9 to 2.3 percentage point increase in segment ROA.
[Table 10 about here]
The results are robust to the inclusion offirm fixed effectsand control variables, Columns (1), (3), (5) and (7). When firm-year fixed effects are included, Columns (2), (4), (6) and (8), the interaction coefficient becomes larger and more significant. My results from the BoardEx sample and the combined sample indicate that the possible survivorship bias does not seem to affect my estimation. The estimated coefficient on the interaction term has similar magnitude and significance in both samples.
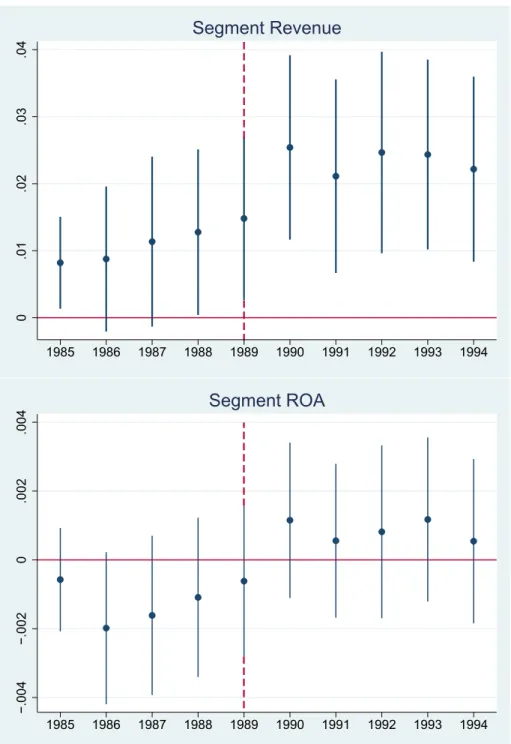
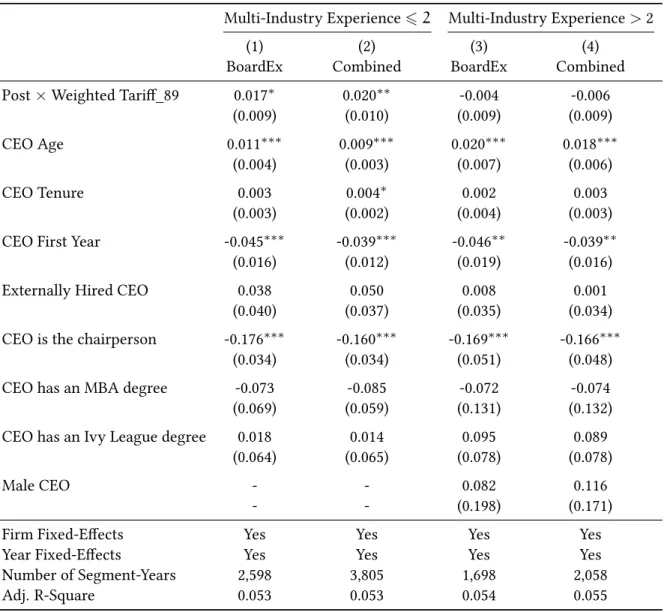
An important assumption in my triple difference analysis is that the performances of a more af-fected segment and a less afaf-fected segment followed parallel trends prior to the adoption of the FTA. To validate this assumption, I first use graphs to check whether there are pre-trends in segment per-formance prior to the passage of the FTA. I replace thePosttin the equation (4) with dummy variables,
Year Dummyt, indicating each year during the sample. Then, I estimate the models for segment rev-enue and segment ROA and plot the coefficients on the interaction term ofMulti-Industry Experiencej,t,
Tariffs_89i,j, andYear Dummytfor each year in the sample period. If the parallel condition is satisfied, the graphs will show a clear jump around the passage of the FTA. Figure 3 plots the estimated coeffi-cients and their 95 percent intervals. Both segment revenue and ROA graphs show a clear jump around the event year. The figures indicate that my results are not explained by possible pre-trends in segment performance.
[Figure 3 about here]
Second, I directly test the parallel trend condition by including in my models a dummy variable, False Postt, which equals to one in the period 1987-1992, and zero in other years. In the each model, I estimate the coefficient onPostt ×Multi-Industry Experiencej,t × Tariffs_89i,j, and the coefficient onFalse Postt ×Multi-Industry Experiencej,t ×Tariffs_89i,j. If the condition is satisfied, the former coefficient should be similar to that in Table 10; the later coefficient should be insignificantly different from zero. As shown in Table A3, the coefficients ofFalse Posttand its interaction terms are statistically insignificant in both models, the coefficients of interest are significant and mostly unchanged. This test suggests that pre-existing trends are not a concern in my empirical strategy.
4 Deregulation
Besides international trade agreements, different waves of deregulation in major industries have changed the competition environment in the US over the last several decades. I use these policy changes to confirm that increased competition induces higher demand for industry-transferable skills in the CEO market. There were two major deregulations in the 1990s: the National Energy Policy Act of 1992 that opened the energy distribution market and the Telecommunications Act of 1996 that opened the telecommunications industry.
The National Energy Policy Act of 1992 (EPACT) directly change the competition environment of the electric utility industry. This act affected the competition in the electricity distribution sector in two ways. First, EPACT directed the Federal Energy Regulatory Commission (FERC) to order electric utilities to transmit electricity generated by other suppliers to the US power transmission grid at just and reasonable rates. This change opened the distribution market, which used to be accessible exclu-sively to transmission-owning electric utilities, for all electricity suppliers. Second, the Act removed corporate ownership and geographical regulations imposed by the Public Utility Holding Company Act of 1935 (PUHCA) that restrained the use of certain electric power generators. This change enabled non-utility wholesale power generators to compete without being constrained by regulations designed for utility companies. This Act created a new category of independent power generators, called "exempt wholesale generators." As a result, EPACT has considerably increased the level of competition in the electric utility industry.
The Telecommunications Act of 1996 was the most significant change in the telecommunications law since the Communications Act of 1934. Although telecommunications had traditionally been con-sidered a natural monopoly and regulated sector, the sector has evolved significantly following tech-nological breakthroughs in transmission and the breakup of AT&T. In passing the Telecommunications Act of 1996, Congress aimed to clear the way for necessary changes with the main goal to "let any-one enter any communications business -to let any communications business compete in any market against any other."6The Act prevented companies from becoming monopolies and eliminated old reg-ulations that had kept businesses in the industry from competing.
4.2.Sample Construction
To test for the impact of deregulation in the electricity sector, I use the sample of Compustat non-financial firms from 1988, four years before deregulation, to 1995, four years after deregulation. As in Section 2, my measure of CEOs’ industry-transferable skills, variableMulti-Industry Experience, is constructed as the number of industries at the SIC three-digit level of CRSP firms where a manager had
worked before taking a CEO position. VariablePost Deregulation indicates 1992 and the subsequent years in the sample period. Deregulated is a dummy variable which equals to one for electricity firms (SIC codes: 4910, 4911, 4931) and zero for firms with other SIC codes. In 1992, there were 17 companies in the deregulated sector which have data for all variables.
In the tests for the telecommunications deregulation, the sample is Compustat non-financial firms from 1992 to 1999. Since this sample overlaps with the sample for the telecom deregulation, all electric-ity firms (SIC codes: 4910, 4911, 4931) are excluded. VariableMulti-Industry Experienceis constructed using the similar method in Section 2. In these tests, variable Post Deregulationindicates 1996 and the subsequent years in the sample period. Deregulated is a dummy variable which equals to one for telecommunications firms (SIC codes: 4800 to 4899) and zero, otherwise. In 1996, there were 39 telecom-munications companies which have data for all variables.
I collect control variables for CEO characteristics from BoardEx. Accounting variables are obtained from Compustat and winsorized at 1 percent and 99 percent levels. The statistics of the main dependent and independent variables are presented in Panel C of Table 1.
4.3.Empirical Analysis and Results
As in the previous sections, I examine the impact of deregulation on the increased importance of transferable skills in the CEO market. I then test whether CEOs with greater industry-transferable skills outperform in deregulated industries after the passage of the deregulation. To verify the impact on CEO retaining decision, I estimate the following regression model:
(5) Yj,t=α+β1Multi−Industry Experiencej,t×Post Deregulationt×Deregulatedj
+β2Multi−Industry Experiencej,t×Post Deregulationt
+β3Post Deregulationt×Deregulatedj
+β4Multi−Industry Experiencej,t×Deregulatedj
+β5Multi−Industry Experiencej,t+β6CEO&FirmControlsj,t
whereYj,t is a dummy variable indicating whether the incumbent CEO of firm j is replaced at the end of yeart; Multi-Industry Experiencej,t is the measure of CEOs’ industry-transferable skills; Post
Deregulationt equals to one for the year in which the deregulation came into effect and subsequent years; Deregulatedj indicates firms in the deregulated industries; CEO& Firm Controlsj,t is a vector of CEO and firm control variables;FirmFEj are firm fixed effects;YearFEt are year fixed effects. The coefficient on the interaction term ofMulti-Industry Experiencej,t,Post Deregulationt, andDeregulatedj estimates the marginal impact of industry-transferable skills on firms’ propensity to retain the CEOs.
Table 11 reports the results of these tests. In Columns (1) and (2), the triple difference coeffi-cient shows that for an electricity firm after the deregulation, one standard deviation higher in CEOs’ industry-transferable skills reduce the propensity of CEO turnovers by 2.3 percentage points. The co-efficient is significant at 1 percent level. CEOs’ industry-transferable skills also reduce the propensity of CEO turnovers when the telecommunications sector was deregulated. In Columns (3) and (4), the coefficient on the interaction ofMulti-Industry Experiencej,t, Post Deregulationt, and Deregulatedj is economically large and statistically significant at the 5 percent level. For a CEO of a telecommunica-tion company, one standard deviatelecommunica-tion higher in industry-transferable skills reduces the propensity of CEO turnovers by 4.1 percentage points. These results are consistent with those in Section 2.
[Table 11 about here]
Because of the size of the treatment groups in both deregulation shocks, I could not estimate the models for CEO selection decision as in the previous two settings. Therefore, I continue my analy-sis by examining whether CEOs who have greater industry-transferable skills would perform better in deregulated industries. To test this hypothesis, I use regression equation (5) with dependent vari-ables, the logarithm of firm revenue and firm ROA. The coefficient of interest is on the interaction of Multi-Industry Experiencej,t,Post Deregulationt, andDeregulatedj. Table 12 presents the results of this test. Regarding the electricity deregulation, Columns (1) and (2), the coefficient on the interaction is insignificant in both models. For the telecommunications deregulation, Columns (3) and (4), the
coef-ficient is positive and significant at 1 percent level in both models. One standard deviation higher in CEOs’ industry-transferable skills leads to 3.3 percent growth in firm revenue and 2.5 percentage points higher in ROA.
[Table 12 about here]
The results in this section support my proposed hypotheses in this paper. Increased competition, resulted from deregulation, leads to higher demand for CEOs with greater industry-transferable skills. In deregulated industries, CEOs with greater industry-transferable skills outperform CEOs with lesser industry-transferable skills.
5 Conclusion
As Bertrand (2009) discusses, CEOs are "the key decision-makers in corporations that account for most of the economic activity in modern economies." Over the past several decades, the CEO market has evolved significantly and presents major questions for studies in the CEO literature. This paper addresses one of those questions: Why would the importance of transferable managerial skills have increased so much over the last 30-40 years? (Bertrand, 2009)
Studying the CEO market in three different empirical settings, I identify increased competition in the product markets as a driving force behind the rising importance of transferable managerial skills, specifically industry-transferable skills. When competition increases, firms tend to retain incumbent chief executives with greater industry-transferable skills and to select new ones who have these skills. CEOs with greater industry-transferable skills are preferred in a competitive market since these ex-ecutives have positive impacts on revenue growth and profitability. My analysis identifies corporate innovation as one channel of effects. CEOs with greater industry-transferable skills are more likely to undertake risker but more innovative projects when the firms face with increased competition pressure. As companies need these projects to differentiate from new market entrants, this explains the rising demand for CEOs who possess these skills.
This study highlights the role of product-market competition in the rising importance of chief ex-ecutives’ industry-transferable skills. Other transferable skills such as leadership, business education, restructuring abilities, organizational skills, have also become more and more valuable in the labor market for top executives. Firms’ increased dependence on external financing, rising role of public relation, and waves of mergers and acquisitions may be among the economic forces that drive the de-mand for those managerial qualities. Future research could shed light on how those processes impact the executive market.
References
Aghion, P., M. Dewatripont, and P. Rey. 1999. Competition, financial discipline and growth.The Review of Economic Studies66:825–852.
Aghion, P., C. Harris, P. Howitt, and J. Vickers. 2001. Competition, imitation and growth with step-by-step innovation. The Review of Economic Studies68:467–492.
Andrade, G., M. Mitchell, and E. Stafford. 2001. New evidence and perspectives on mergers.The Journal of Economic Perspectives15.
Bernard, A. B., J. B. Jensen, and P. K. Schott. 2006. Trade costs, firms and productivity. Journal of monetary Economics53:917–937.
Bertrand, M. 2009. CEOs. Annu. Rev. Econ.1:121–150.
Bertrand, M., and A. Schoar. 2003. Managing With Style: The Effect Of Managers On Firm Policies.The Quarterly Journal of Economics118:1169–1208.
Cetorelli, N., and P. E. Strahan. 2006. Finance as a barrier to entry: Bank competition and industry structure in local US markets. The Journal of Finance61:437–461.
Clausing, K. A. 2001. Trade creation and trade diversion in the Canada–United States free trade agree-ment. Canadian Journal of Economics/Revue canadienne d’économique34:677–696.
Cuñat, V., and M. Guadalupe. 2009. Globalization and the provision of incentives inside the firm: The effect of foreign competition. Journal of Labor Economics27:179–212.
Curry, B., and K. D. George. 1983. Industrial concentration: a survey.The Journal of Industrial Economics pp. 203–255.
Custódio, C., M. A. Ferreira, and P. Matos. 2013. Generalists versus specialists: Lifetime work experience and chief executive officer pay. Journal of Financial Economics108:471–492.
Custódio, C., M. A. Ferreira, and P. P. Matos. 2015. Do General Managerial Skills Spur Innovation? ECGI-Finance Working Paper.
Fee, C. E., C. J. Hadlock, and J. R. Pierce. 2013. Managers with and without style: Evidence using exogenous variation. Review of Financial Studiesp. hhs131.
Frydman, C. 2014. Rising through the ranks. the evolution of the market for corporate executives, 1936-2003. Working Paper .
Frydman, C., and R. E. Saks. 2010. Executive compensation: A new view from a long-term perspective, 1936–2005. Review of Financial Studies23:2099–2138.
Guadalupe, M., and J. Wulf. 2010. The Flattening Firm and Product Market Competition: The Effect of Trade Liberalization on Corporate Hierarchies.American Economic Journal. Applied Economics2:105.
Hall, B. H., A. B. Jaffe, and M. Trajtenberg. 2001. The NBER patent citation data file: Lessons, insights and methodological tools. Tech. rep., National Bureau of Economic Research.
Head, K., and J. Ries. 2001. Increasing returns versus national product differentiation as an explanation for the pattern of US-Canada trade. American Economic Reviewpp. 858–876.
Hoberg, G., and G. Phillips. 2010. Real and financial industry booms and busts. The Journal of Finance 65:45–86.
Hoberg, G., and G. Phillips. 2011. Text-Based Network Industries and Endogenous Product Differenti-ation. Journal of Political Economy,forthcoming.
Hoechle, D., M. Schmid, I. Walter, and D. Yermack. 2012. How much of the diversification discount can be explained by poor corporate governance? Journal of Financial Economics103:41–60.
Huson, M. R., R. Parrino, and L. T. Starks. 2001. Internal monitoring mechanisms and CEO turnover: A long-term perspective. The Journal of Finance56:2265–2297.
Irvine, P. J., and J. Pontiff. 2009. Idiosyncratic return volatility, cash flows, and product market compe-tition. Review of Financial Studies22:1149–1177.
Knott, A. M., and H. E. Posen. 2003. Does competition increase innovation? New evidence from old industries. Mack Center for Technological Innovation Working Paper.
Lazear, E. P. 2005. Entrepreneurship. Journal of Labor Economics23:649–680. London, P. A. 2004. Competition Solution.Books.
Murphy, K. J., and J. Zabojnik. 2004. CEO pay and appointments: A market-based explanation for recent trends. The American Economic Review94:192–196.
Murphy, K. J., and J. Zabojnik. 2007. Managerial capital and the market for CEOs. Working Paper. Rajan, R. G., and J. Wulf. 2006. The flattening firm: Evidence from panel data on the changing nature
of corporate hierarchies. The Review of Economics and Statistics88:759–773.
Romalis, J. 2007. NAFTA’s and CUSFTA’s Impact on International Trade. The Review of Economics and Statistics89:416–435.
Schumpeter, J. A. 1912. The Theory of economic development. Tirole, J. 1988.The theory of industrial organization. MIT press.
Trajtenberg, M., R. Henderson, and A. Jaffe. 1997. University versus corporate patents: A window on the basicness of invention. Economics of Innovation and new technology5:19–50.
Trefler, D. 2004. The Long and Short of the Canada-US Free Trade Agreement. American Economic Review94:870–895.
Tybout, J. R. 2003. ’Plant-and Firm-level Evidence on the’New’Trade Theories’ in E. Kwan Choi and James Harrigan, ed., Handbook of International Trade.
.05 .1 .15 .2 .25 .3 .35 .4 Compustat HHI 1 1.5 2 2.5 3 3.5 4 Multi−Industry Experience 1990 1995 2000 2005 2010 Year
Multi−Industry Experience Compustat HHI
Figure 1: Market Competition and Multi-Industry CEOs
0
.5
1
1.5
Increase in Trade
free less than 5% 5% to 10% 10% to 25% more than 25% Extent of Tariff Liberalization on Canadian Goods
Source: Clausing (2001)
Canada Others
0 .01 .02 .03 .04 1985 1986 1987 1988 1989 1990 1991 1992 1993 1994
Segment Revenue
−.004 −.002 0 .002 .004 1985 1986 1987 1988 1989 1990 1991 1992 1993 1994Segment ROA
Figure 3: Parallel Trend Analysis
This figure presents the point estimate and the 95% confidence interval of interaction coefficients of Multi−IndustryExperiencej,t×Year Dummyt×T ariffs_89i,j estimated in this model
Segment Outcomesi,j,t =α+β1Multi-Industry Experiencej,t×Year Dummyt×T ariffs_89i,j +β2YearDummyt×T ariffs_89i,j+β3Multi-Industry Experiencej,t×T ariffs_89i,j +β4T ariffs_89i,j+Firm-YearFEj,t+i,j,t
Table 1: Summary Statistics Panel A: Firm Fixed-Effects Models
Mean p10 p50 p90 S.D. N Multi-Industry Experience 2.34 1.00 2.00 4.00 1.34 32,840 HHI 0.16 0.05 0.12 0.32 0.15 32,840 TNIC3 HHI 0.24 0.06 0.16 0.55 0.22 32,840 CEO Turnover 0.08 0.00 0.00 0.00 0.27 32,840 Revenue ($mil) 2,343.95 20.55 338.01 5,121.65 6,787.70 32,840 Profit ($mil) 247.02 -16.41 22.47 517.20 834.04 32,840 ROA 0.02 -0.18 0.07 0.18 0.24 32,840 Tobin’s Q 2.13 0.91 1.52 3.75 2.64 32,840 R&D/Sale 0.32 0.00 0.00 0.27 1.68 32,840 Patent 19.90 0.00 0.00 25.44 119.02 11,253 Citation 164.14 0.00 0.00 148.61 1,487.17 11,253
Panel B: The Canada-United States Free Trade Agreement
Mean p10 p50 p90 S.D. N
Multi-Industry Experience 2.36 1.00 2.00 4.00 1.50 5,859
CEO Turnover 0.06 0.00 0.00 0.00 0.23 5,859
Weighted Tariff_89 1.03 0.00 0.00 3.75 2.14 5,859
Tariffs_89 1.83 0.00 0.29 4.79 2.84 15,483
Segment Revenue ($mil) 1,057.20 7.70 194.08 2,364.53 4,109.59 15,483
Segment ROA 0.12 -0.04 0.11 0.30 0.16 15,483
Segment CaPex/Total Capex 0.39 0.02 0.25 0.93 0.67 15,483
Panel C: Deregulations Mean p10 p50 p90 S.D. N Electricity Multi-Industry Experience 1.92 1.00 2.00 3.00 1.24 9,011 CEO Turnover 0.05 0.00 0.00 0.00 0.23 9,011 Revenue ($mil) 1,455.74 9.99 191.80 4,034.04 3,301.26 9,011 ROA 0.02 -0.07 0.04 0.13 0.26 9,011 Telecommunications Multi-Industry Experience 2.00 1.00 2.00 4.00 1.22 15,881 CEO Turnover 0.08 0.00 0.00 0.00 0.27 15,881 Revenue ($mil) 1,342.51 10.25 168.15 3,304.45 3,288.77 15,881 ROA 0.00 -0.14 0.04 0.13 0.21 15,881
Table 2: Product Market Competition, CEOs’ Industry Transferable Skills, and CEO Turnovers
This table reports the results of firm fixed-effects models examining the impact of product-market com-petition and CEOs’ industry-transferable skills on the propensity of CEO turnovers. The dependent variable isCEO Turnover which equals to 1 if the CEO is replaced at the end of the financial year in the sample period from 1999 to 2012. Multi-Industry Experienceis the number of industries at the SIC three-digit level in which an executive had experienced before becoming CEO.Competitionis defined as one minus the Herfindahl-Hirschman Index. The index ranges from zero to one and is constructed using Compustat sale at the SIC three-digit code level, Columns (1) and (2), or the Text Based Industry Classifications, Columns (3) and (4), suggested by Hoberg and Phillips (2010). VariablesMulti-Industry ExperienceandCompetitionare standardized to have mean zero and standard deviation one. Standard errors are clustered at the SIC three-digit level and shown in the paratheses. *, **, and *** indicate statistical significance at the 10%, 5%, and 1% levels, respectively.
CEO T urnoveri,j,t=α+β1Competitionj,t×Multi-Industry Experiencei,t+β2Competitionj,t
+β3Multi-Industry Experiencei+β4CEO Controlsi,t+FirmFEj+YearFEt+i,j,t
Compustat HHI TNIC3 HHI
(1) (2) (3) (4) Competition×Multi-Industry -0.005∗ -0.006∗∗ -0.005∗∗ -0.005∗∗ Experience (0.003) (0.003) (0.002) (0.002) Competition 0.006 0.011∗∗ 0.007∗∗∗ 0.005∗ (0.004) (0.005) (0.003) (0.003) Multi-Industry Experience -0.024∗∗∗ -0.006 -0.023∗∗∗ -0.006 (0.004) (0.004) (0.003) (0.004) CEO Age 0.006∗∗∗ 0.006∗∗∗ (0.001) (0.001) Male CEO 0.013 0.013 (0.023) (0.022) CEO Tenure 0.012∗∗∗ 0.012∗∗∗ (0.001) (0.001)
Externally Hired CEO -0.026∗∗ -0.027∗∗
(0.011) (0.011)
CEO is the chairperson 0.004 0.008
(0.008) (0.009)
CEO has an MBA degree -0.073∗∗∗ -0.071∗∗∗
(0.011) (0.012)
CEO has an Ivy League