Copyright © 2021 by Author/s and Licensed by Modestum. This is an open access article distributed under the Creative Commons Attribution License which permits unrestricted use, distribution, and reproduction in any medium, provided the original work is properly cited.
2021, 6(1), em0134 e-ISSN: 2468-4376
https://www.jisem-journal.com/ Research Article OPEN ACCESS
Technology Acceptance Model Validation in an Educational Context:
A Longitudinal Study of ERP System Use
Elizabeth E. Grandón 1*, Beatriz Díaz-Pinzón 2, Simha R. Magal 3, Karina Rojas-Contreras 1 1 Facultad de Ciencias Empresariales, Universidad del Bío-Bío, Concepción, CHILE
2 Facultad de Ciencias Económicas, Universidad Nacional de Colombia, Bogotá, COLOMBIA 3 Robinson College of Business, Georgia State University, Atlanta, Georgia, USA
*Corresponding Author:[email protected]
Citation: Grandón, E. E., Díaz-Pinzón, B., Magal, S. R., Rojas-Contreras, K. (2021). Technology Acceptance Model Validation in an Educational Context: A Longitudinal Study of ERP System Use. Journal of Information Systems Engineering and Management, 6(1), em0134.
https://doi.org/10.29333/jisem/9582 ARTICLE INFO ABSTRACT
Published: 17 Jan. 2021 Although Enterprise Resource Planning (ERP) systems have been implemented and extensively studied in corporate contexts, there is a lack of research that focuses on educational settings. This study intends to fill this gap by validating the technology acceptance model (TAM) in an educational context to better understand the factors that influence students’ intention to use ERP systems. The research model was empirically tested using data collected from students enrolled in ERP courses in two public universities in different countries at two points in time. The results of this longitudinal, cross-cultural study indicate that perceived ease of use and perceived usefulness predicts behavioral intention, with perceived usefulness the strongest predictor. As students use the ERP system in class, their perceptions of ease of use, usefulness, and intention to use the system are more favorable. Along the same lines, students with previous experience in ERP systems have more favorable perceptions of ease of use and usefulness than students with no experience. Contributions of the study and recommendations for future research are proposed.
Keywords: ERP systems, technology adoption, TAM model, longitudinal study, educational context
INTRODUCTION
Organizations have used Enterprise Resource Planning (ERP) systems to support their business processes for over forty years (Mohammad et al., 2002; Strong et al., 2006). Given the significant investment required to implement and use ERP systems, organizations have sought to ensure successful adoption and use. One body of research on ERP systems has attempted to identify the factors that influence adoption and use. Key factors identified relate to executive commitment, understanding of business processes, proficiency in the use of technologies, adequate training in the use of systems, learning and predisposition for change, and reengineering and integration of business processes (Pinto et al, 2017). A meta-analysis conducted by Ramírez and García (2005), revealed that factors related to education and training were identified most often as leading to successful implementation of ERP systems. This has implications for educational institutions and should inform university curricula and approaches to teaching about ERP system. Most graduates will likely encounter ERP systems in their profession either as end-users or as system administrators, and employers increasingly require knowledge of and hands-on experience with ERP systems (Vluggen and Bollen, 2005). Institutions of higher education are well advised to incorporate ERP-related topics in their curricula.
Over the last two decades, many universities have incorporated ERP-related content in their academic programs (Ramírez and García, 2005; Strong et al., 2006). However, few have included hands-on experiences for students. Vluggen and Bollen (2005) have identified several obstacles, such as resistance to change curricula, lack of resources, challenges with forming multidisciplinary teams of instructors for integrated teaching, and technical challenges of maintaining needed infrastructure. Some of these obstacles are associated with acceptance of new technologies (Vluggen and Bollen, 2005).
The Technology Acceptance Model (TAM) (Davis, 1989) is a widely used model to predict intention and use of new systems and technologies. This is largely due to its simplicity and predictive power. However, much of the TAM research is in an organizational context (Al-Jabri and Roztocki, 2015; Kumar and Van Hillsgersberg, 2000; Lodhi et al., 2016) and there are few studies that have validated the model in an educational context. The purpose of this research is to validate the TAM model in an educational context.
THEORETICAL FRAMEWORK
ERP SystemsERP systems are “configurable information systems packages that integrate information and information-based processes within and across functional areas in an organization” (Kumar and Van Hillsgersberg, 2000: 23). They support cross-functional processes across an enterprise and serve as platforms for additional applications related to supply chain management, customer resource management and analytics.
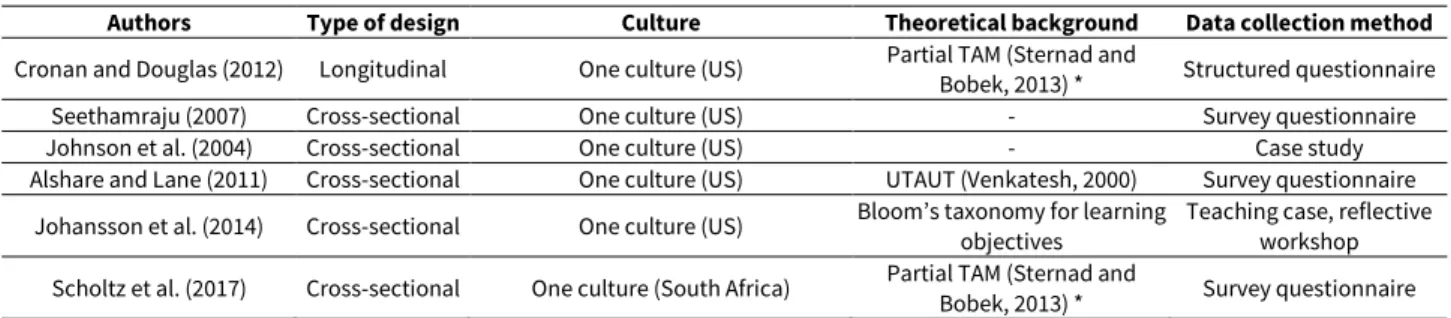
ERP systems are of significant value to educational institutions, especially business schools. The integrated nature of ERP systems offer a mechanism for business schools to provided integrated knowledge of processes across functional areas. Previous research on the use of ERP systems in curricula are summarized in Table 1.
Table 1. Previous ERP studies - Educational contexts
Authors Type of design Culture Theoretical background Data collection method
Cronan and Douglas (2012) Longitudinal One culture (US) Partial TAM (Sternad and Bobek, 2013) * Structured questionnaire
Seethamraju (2007) Cross-sectional One culture (US) - Survey questionnaire
Johnson et al. (2004) Cross-sectional One culture (US) - Case study
Alshare and Lane (2011) Cross-sectional One culture (US) UTAUT (Venkatesh, 2000) Survey questionnaire Johansson et al. (2014) Cross-sectional One culture (US) Bloom’s taxonomy for learning objectives Teaching case, reflective workshop
Scholtz et al. (2017) Cross-sectional One culture (South Africa) Partial TAM (Sternad and Bobek, 2013) * Survey questionnaire *the study did not measure behavioral intention
Technology Aceptance Model (TAM)
The TAM model postulates that perceived usefulness (PU) and perceived ease of use (PEOU) are key antecedents of a person’s behavioral intention to use a technology (Davis, 1989). PU is defined as ‘the degree to which a person believes that using a particular system would enhance his or her job performance' (Davis, 1989: p. 320). In contrast, PEOU refers to ‘the degree to which a person believes that using a particular system would be free of effort’ (Davis, 1989: p. 320). Specifically, the TAM model postulates that there is a greater likelihood of using a technology if an individual perceives the technology to be easy to use and useful in performing job-related tasks. Further, the model indicates that PEOU has an indirect impact on intention to use a technology by influencing perception of usefulness.
Numerous studies have validated the TAM model in a variety of contexts across numerous technologies. Some of the key studies are summarized in Table 2.
Table 2. Previous ERP studies – Organizational contexts
Authors Type of design Culture Theoretical background Data collection method
Palomino and Whitley (2007) Cross-sectional Cross-cultural (Colombia and Switzeland) Hofstede (2001) Interviews, document analysis Sheu et al. (2003) Cross-sectional (US and Taiwanese manufact. firms) Cross-cultural - structured interviews Direct observation, Livermore and Rippa (2011) Cross-sectional Cross-cultural (US and Italy) - Two case studies
Lodhi et al. (2016) Cross-sectional One culture (Pakistani companies) TAM (Sternad and Bobek, 2013) * Structured questionnaire Sternad and Bobek (2013) Cross-sectional One culture (Slovenian companies) TAM (Sternad and Bobek, 2013)* Survey questionnaire Al-Jabri and Roztocki (2015) Cross-sectional One culture (Saudi Arabian companies) Extended TAM (Sternad and Bobek, 2013)* Online Survey questionnaire
Soto-Acosta et al. (2013) Cross-sectional (Malaysian manufact. firm) One culture Extended TAM (Sternad and Bobek, 2013)* Survey questionnaire *the study did not measure behavioral intention
A review of the research summarized in Table 1 and Table 2 indicates that the vast majority of the studies are cross-sectional, that is, the data are collected at one point in time. In addition, most of the studies, especially those in an educational context, are limited to data from one culture. As previously noted, the purpose of this research is to validate the TAM model in an educational context. Going further, we will attempt to validate the model using a longitudinal, a cross-cultural setting. We propose the following hypotheses:
H1: The perceived usefulness of an ERP system is positively related to the intention to use the system by students H2: The perceived ease of use of an ERP system is positively related to the intention to use the system by students H3: The perceived ease of use of an ERP system is positively related to the perceived usefulness of the system by students
As Johanssen et al. (2014) points out, applying procedural knowledge, in this case having hands-on exposure to an ERP system, facilitates the students’ ability to understand, analyze, and evaluate the ERP system. Therefore, it is expected that the students will become more knowledgeable as they use the system. In addition, prior literature has shown that previous experience might affect IT adoption (Salahshour et al, 2018; Venkatesh et al, 2003). Thus, we extended Grandon et al. (2020) study by focusing on
students’ perceptions during the educational process and taking into account previous experience. Accordingly, we offer the following additional hypotheses:
H4: As students use an ERP system in class, their perceptions of ease of use, usefulness, and intention to use the system will be more favorable
H5: Students with previous experience with ERP systems, will have more favorable perceptions of ease of use and usefulness than students with no experience with ERP systems.
METHODOLOGY
The study was conducted at two public universities, one in Chile and one in Colombia, where the difficulties cited by Vluggen and Bollen (2005), and stated in the Introduction section, were overcome. Both universities incorporated elective ERP classes in the curriculum, acquired licenses to use ERP software in the classroom, have well-trained instructors for the integrated teaching of ERP systems, and maintain the required technical infrastructure for the use of the ERP. The students belong to Colleges of Business and Engineering. The objective of the class is for the students to be exposed to executing business processes and to understand how the integration of a company’s processes occurs with the use of the SAP/R3 ERP system. Both universities belong to the SAP University Alliances Program and they used the same class material (“Integrated Business Process with ERP Systems” book (Magal and Word, 2012), where concepts related to financial accounting, procurement, and fulfillment processes, and their integration are covered. Students had the opportunity to use an SAP ERP system in the lab each week and use the Global Bike Inc. (Magal and Word, 2012), case study material.
A measurement instrument was developed based on the scales proposed by Davis (1989), where the perceptions of students from both universities towards the ERP system were evaluated. Perceived ease of use, perceived usefulness, and behavioral intention were measured using a seven-point Likert scale where 1 represents strong agreement with the statement, and 7 represents strong disagreement. The questionnaire was administered to students at two points in time during the semester. Figure 1 shows the interventions performed and the times when the data was collected. At time 1 data was collected after covering the concepts and executing, in the laboratory, the processes of financial accounting and procurement, while at time 2, data was collected after covering the concepts and executing the fulfillment and process integration.
The study utilized a multivariate data analysis, the Partial Least Squares - Structural Equation Modeling (PLS-SEM) technique. SmartPLS 3.2.8 statistical software (Ringle et al, 2015) was used to perform the statistical analysis.
Figure 1. Longitudinal Design
RESULTS
Demographic Information
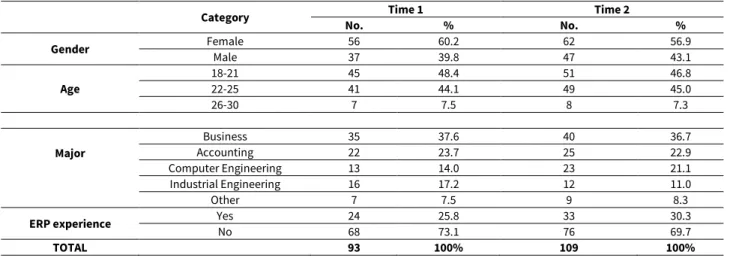
For time 1, 93 students participated in the study (45 Chileans and 48 Colombians). At time 2, 109 students participated (55 Chileans and 54 Colombians). As in any longitudinal study, there is a drop-off rate since some of the students did not attend the class the day surveys were administered. Table 3 provides the demographic information collected at both times, without differentiating the student’s country of origin. Students belong to Business and Accounting majors (approximately 60%) and Computer and Industrial Engineering majors (about 32%). On average, 71.4% of the students had no previous experience in using any ERP system.
Group Difference
Since, in both countries, the course was taught following the same methodology, using the same materials and similar assessments, and considering that the students had very similar demographic characteristics, a comparison of means was performed to determine whether both samples (Chilean and Colombian) had significant differences. As none of the samples exhibited a normal distribution (the Kolmogorov-Smirnov and Shapiro-Wilk tests yielded a bilateral asymptotic significance p-value less than 0.05), non-parametric tests were used (Hair et al., 2014). Both Mann-Whitney and Kolmogorov-Smirnov tests yielded a significance p-value > 0.05, so it could be concluded that there are no significant differences between the two groups of students. This result may go in line with Hofstede´s study of cultural differences among countries (Hofstede, 2001). Both Chile and Colombia score similar in some dimensions, particularly in the uncertainty avoidance dimension (86 and 80 respectively). Uncertainty avoidance is defined as the extent to which the members of a culture feel threatened by ambiguous or unknown situations and have created beliefs and institutions that try to avoid these. The adoption of new, unfamiliar technologies as ERP systems may bring uncertainty to both groups of students. Therefore, for the rest of the statistical analysis, both samples were combined to compare the differences in student perceptions at times 1 and 2 and validate the proposed model.
Validation of the TAM Model
To vatidate hypotheses H1, H2, and H3 concerning the TAM model shown in Figure 2, we utilized the PLS technique. This approach is defined by two models: the measurement model and the structural model.
Figure 2. Research Model Measurement Model
The psychometric characteristics of the instrument used at two points in time were analyzed. Using the partial least squares (PLS) technique, the measurement model was analyzed, and the convergent validity (reliability/internal consistency) and discriminating validity of the model’s constructs were calculated. Convergent validity is the degree to which an indicator is positively correlated with alternative indicators of the same construct (Hair et al, 2014). To determine the convergent validity of the constructs that make up the model, Cronbach’s alfa, a measure of composite reliability, and the average variance extracted (AVE) from each construct (latent variables of behavioral intention, perceived ease of use, and perceived usefulness) were calculated. Table 4 shows the corresponding values for the three constructs for both time 1 and time 2 after running the PLS algorithm.
Table 3. Student demographic information – Time 1 and 2
Category No. Time 1 % No. Time 2 %
Gender Female Male 56 37 60.2 39.8 62 47 56.9 43.1
Age 18-21 22-25 45 41 48.4 44.1 51 49 46.8 45.0 26-30 7 7.5 8 7.3 Major Business 35 37.6 40 36.7 Accounting 22 23.7 25 22.9 Computer Engineering 13 14.0 23 21.1 Industrial Engineering 16 17.2 12 11.0 Other 7 7.5 9 8.3
ERP experience Yes No 24 68 25.8 73.1 33 76 30.3 69.7
The Cronbach’s alphas are all greater than 0.9, indicating a high internal consistency in the latent variables of the model. Similarly, the values associated with the composite reliability of the constructs exceed the values suggested by Hair et al. (2014) (>0.70). The results obtained for the average variance extracted were also higher than those recommended by Fornell and Larcker (1981) (>0.50).
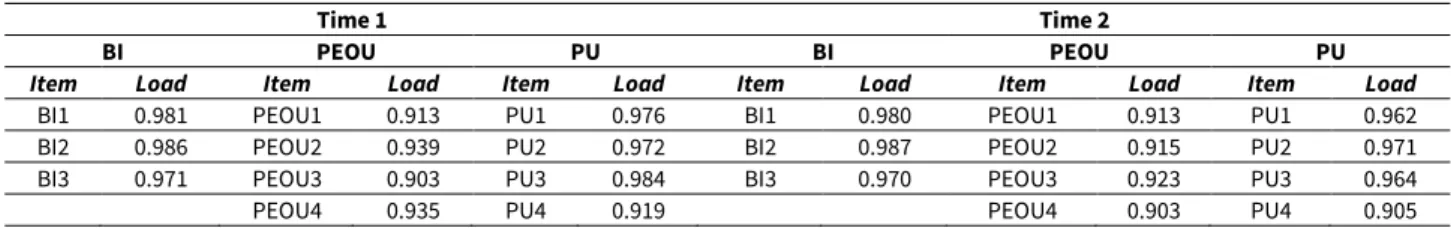
To correctly assess the individual reliability of the indicators concerning their respective construct, it is required that the loads exceed the value 0.70 (Chin, 1998). In this case, the values of all loads exceed the indicated value. Compliance with the individual reliability of the indicators is shown in Table 5.
Table 5. Outer loadings for each construct
Time 1 Time 2
BI PEOU PU BI PEOU PU
Item Load Item Load Item Load Item Load Item Load Item Load
BI1 0.981 PEOU1 0.913 PU1 0.976 BI1 0.980 PEOU1 0.913 PU1 0.962
BI2 0.986 PEOU2 0.939 PU2 0.972 BI2 0.987 PEOU2 0.915 PU2 0.971
BI3 0.971 PEOU3 0.903 PU3 0.984 BI3 0.970 PEOU3 0.923 PU3 0.964
PEOU4 0.935 PU4 0.919 PEOU4 0.903 PU4 0.905
The discriminant validity indicates the degree to which one construct is truly different from another. Following the recommendations of Hair et al. (2014), the discriminant validity was determined from the cross-loadings analysis of the indicators and the Fornell-Larcker criterion. The cross-loading analysis (Table 6) indicates that the three constructs have higher loads in the indicators associated with the construct than in the other constructs. On the other hand, Fornell-Larcker’s criterion states that the square root of each construct’s AVE should be greater than the highest correlation with another construct (Fornell and Larcker, 1981). Table 7 shows the discriminant validity associated with the Fornell-Larcker criterion for both times.
Table 6. Cross-loads of latent variables
Time 1 Time 2 BI PEOU PU BI PEOU PU BI1 0.981 0.750 0.915 0.980 0.759 0.896 BI2 0.986 0.772 0.902 0.987 0.766 0.882 BI3 0.971 0.751 0.855 0.970 0.712 0.808 PEOU1 0.800 0.913 0.797 0.728 0.913 0.741 PEOU2 0.780 0.939 0.758 0.756 0.915 0.766 PEOU3 0.590 0.903 0.559 0.649 0.923 0.628 PEOU4 0.641 0.935 0.655 0.633 0.903 0.580 PU1 0.917 0.755 0.976 0.881 0.710 0.962 PU2 0.898 0.728 0.972 0.836 0.723 0.971 PU3 0.890 0.756 0.984 0.833 0.750 0.964 PU4 0.797 0.701 0.919 0.803 0.672 0.905
Table 7. Discriminatory validity (Fornell-Larcker criterion)
Time 1 Time 2
BI PEOU PU BI PEOU PU
BI 0.979 0.979
PEOU 0.774 0.922 0.762 0.914
PU 0.910 0.763 0.963 0.882 0.751 0.951
Table 4. Convergent validity
Time 1 Time 2
Cronbach’s Alpha Composite reliability AVE Cronbach’s Alpha Composite reliability AVE
BI 0.978 0.986 0.959 0.979 0.986 0.959
PEOU 0.942 0.958 0.851 0.934 0.953 0.834
Structural Model
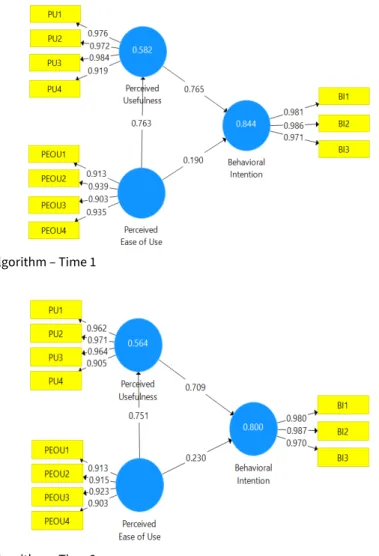
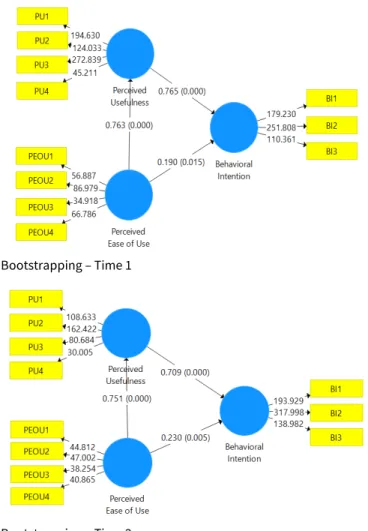
The analysis of the structural model is based on the adjustment of the model to the data to obtain the best estimates of the parameters, while maximizing the explained variance of the endogenous latent variables (Hair et al., 2014). In this case, the coefficient of determination R2 is analyzed at both times in the data collection process. The R2 at time 1 is 0.84 while at time 2 is 0.80 (Figures 3 and 4 respectively). Both values are satisfactory according to typical acceptance criteria (Hair et al., 2014). This indicates that the intention to use ERP systems by university students from Chile and Colombia is explained by 84% and 80%, respectively. Perceived usefulness is explained by 58% in time 1 and 56% in time 2.
Figure 4. Results from PLS algorithm – Time 2
In addition, path coefficients and t-statistics at both times were analyzed using the bootstrapping technique. Table 8 shows these indicators plus the values associated with each latent variable.
Table 8. Bootstrapping results
Time 1 Time 2
Relationships 𝜷𝜷 coef. t-statistics p-value 𝜷𝜷 coef. t-statistics p-value
PEOU BI 0.190 2.434 0.015 0.230 2.839 0.005
PEOU PU 0.763 16.666 0.000 0.751 16.175 0.000
PU BI 0.765 10.638 0.000 0.709 9.685 0.000
Figures 5 and 6 presents the research model with indication of the significance of the path coefficients for each time of the data collection process.
The intention to use an ERP system by students is explained by their perceptions of ease of use (β =0.190; p<0.05 at time 1, and
β =0.230; p<0.05 at time 2) and usefulness (β =0.765; p<0.05 at time 1, and β =0.709; p<0.05 at time 2). In turn, perceptions of ease of use of the system explain perceived usefulness (β =0.763; p<0.05 at time 1, and β =0.751; p<0.05 at time 2). Therefore, hypotheses H1, H2, and H3 are supported.
Students Perceptions of ERP Systems
Based on the average values of raw data, it can be seen in Table 9 that students´perceptions of ease of use, usefulness, and intention to use the ERP system decreases as the students have hands-on experience during the semester. This indicate that their perceptions are more favorable in time 2 than in time 1 (see Appendix A for the items included in the questionnaire and anchors). These results confirm hypothesis H4. The higher difference is in perceptions of usefulness (0.45) followed by behavioral intention (0.29).
Table 9. Averages of students perceptions of usefulness, ease of use, and behavioral intention– Time 1 and 2
Perceptions Average at Time 1 Average at Time 2 Difference
PU 3.06 2.61 0.45
PEOU 3.54 3.32 0.22
BI 3.17 2.88 0.29
We also tested whether previous experience plays a role in students’ perceptions. As can be seen in Table 10, students with previous experience have more favorable perceptions toward the usefulness and ease of use of the ERP system. They also have a stronger agreement with the intention to use the system than those with no experience. These results confirm hypothesis H5. Table 10. Average values considering previous experience - Time 1 and 2
Perceived Ease of use (PEOU)
Experience Time 1 Time 2 Difference
NO 3.67 3.38 0.29
YES 3.19 3.13 0.06
Perceived Usefulness (PU)
Experience Time 1 Time 2 Difference
NO 3.18 2.81 0.38
YES 2.77 2.76 0.01
Figure 5. Results after running Bootstrapping – Time 1
DISCUSSION
Even though students considered in this study come from different countries, their demographics and perceptions towards ERP systems are similar. Cultural differences seem to not play a role in this study. It was found that there are no statistically significant differences between the demographic of the two student groups.
The results indicate that, as in organizational contexts, the TAM model is suitable to explain students’ intention to use ERP systems in educational settings. These findings are similar to the ones obtained by Soto et al. (2013), and Al-Jabri and Roztocki (2015) who found that perceived usefulness and perceived ease of use influence the attitude of ERP users in a company setting which in turn influence the intention to use it and the symbolic adoption respectively.
Furthermore, the results indicate that when systems are perceived to be easy to use and understand, they would be viewed as more useful use (β =0,763; p<0.05 at time 1, and β =0,751; p<0.05 at time 2). This finding is also consistent with previous research in organizational contexts (Soto-Acosta et al., 2013; Sternad and Zabukovsek, 2013) and educational contexts (Alshare & Lane, 2011). Particularly, perceived usefulness influences the intention to use the ERP systems more than perceived ease of use (β =0,765 vs. β =0,190 at time 1; β =0,709 vs. β =0,230 at time 2). Students recognize that understanding ERP concepts is useful for future job opportunities.
Additionally, the results indicate that, as students have more hands-on experience using the ERP system during the semester, their perceptions of usefulness and ease of use are more favorable. After completing the class, they have stronger beliefs that the ERP system will be useful for their work, and that it will allow them to accomplish tasks more quickly, thereby increasing their productivity at work. Similarly, as students become more knowledgeable about the ERP system, they have stronger beliefs that the system is easy to use and understand. The difference between perceptions of ease of use is smaller than that of usefulness since the students already used the ERP system in time 1 (financial accounting and procurement processes). At time 2, they executed fulfillment and process integration, giving them more experience to better understand business processes in an organizational context.
CONCLUSIONS
To date, little has been done to theorize the essential predictors of ERP adoption in educational contexts. Using the TAM model as theoretical underpinning, this study validated that students’ perceptions are important in determining their intention to use ERP systems in the future. The TAM model was empirically tested using data collected from students enrolled in ERP courses in two countries and at two points in time.
The results of the study provide some theoretical contributions. It has validated that the TAM model can be applied to study the intention to use ERP systems by students. Universities should incorporate ERP courses in their curricula for the students to understand business process integration better. As students understand the functioning of an ERP system, they will find it easy to use and useful, which, in turn, will influence their intention to use it.
There are implications for practice as well. Organizations implement an ERP system to realize the benefits of such systems. These benefits only are realized when users understand the value of these systems and use them. This study indicates that graduates of programs with a strong ERP component understand the value of such systems (usefulness) and have a firm intention to use these systems. Therefore, organizations that recruit graduates from such academic programs are likely to realize the benefits of ERP systems faster than those who do not.
The limitation of this study corresponds to the sample size. However, as a longitudinal and cross-cultural study, it is possible to use PLS-SEM, which can be applied to smaller samples (Wong, 2010). Therefore, this limitation is partly relieved.
Future research could consider other factors that may influence the intention to use ERP systems and moderator variables, such as students’ majors, experience, or gender, that might increase the model’s explanation power. Further studies could focus on determining students’ perceptions and knowledge gained before having any hands-on experience (time 0) and comparing their perceptions before and after completing the course.
REFERENCES
Al-Jabri, I. M. and Roztocki, N. (2015) Adoption of ERP systems: Does information transparency matter?, Telematics and Informatics, 32(2), 300-310.https://doi.org/10.1016/j.tele.2014.09.005
Alshare, K. A. and Lane, P. L. (2011). Predicting Student-Perceived Learning Outcomes and Satisfaction in ERP Courses: An Empirical Investigation. Communications of the Association for Information Systems, 28(34), 571-584.
https://doi.org/10.17705/1CAIS.02834
Chin, W. W. (1998). The partial least squares approach for structural equation modeling. In G. A. Marcoulides (Ed.), Methodology for
business and management. Modern methods for business research (pp. 295-336). Lawrence Erlbaum Associates Publishers.
Cronan, T. P. and Douglas, D. E. (2012) A student simulation game: a longitudinal study. Journal of Computer Information Systems, 53(1), 3-13.https://doi.org/10.1080/08874417.2012.11645591
Davis, F (1989). Perceived Usefulness, Perceived Ease of Use, and User Acceptance of Information Technology. MIS Quarterly, 13(3), 319. https://doi.org/10.2307/249008
Fornell, C. and Larcker, D.F. (1981). Evaluating structural equation models with unobservable variables and measurement error.
Journal of Marketing Research, 18, 39-50. https://doi.org/10.2307/3151312
Grandón, E. E., Magal, S. R., Pinzón, B. H. D. and Rojas, K. P. (2020). Validation of an ERP system acceptance model among Latin American students: A longitudinal study in Chile and Colombia. 2020 15th Iberian Conference on Information Systems and
Technologies (CISTI), Sevilla, Spain, pp. 1-6, https://doi.org/10.23919/CISTI49556.2020.9140891
Grandón, E., Ramírez-Correa, R. and Rojas, K. (2018). Use of business process chage theory to examine enterprise resource planning adoption in Chile. Interciencia, 43(10), 716-722.
Hair, J. F., Hult, T. M., Ringle, C. M. and Sarstedt, M. A. (2014). A primer on partial least square structural equation modeling (PLS-SEM). Los Angeles: SAGE.
Hofstede, G. (2001). Culture’s Consequences: Comparing Values, Behaviors, Institutions, and Organizations Across Nations (2nd ed.). Sage, Thousand Oaks, CA.
Johansson, L., Zimmerman, E. and Rehnström, C. (2014). Facilitating students’ learning outcome of business processes using an ERP. Proceedings of the Americas Conference on Information Sistems (AMCIS), Savannah, USA.
Johnson, T., Lorents, A. C., Morgan, J. and Ozmun, J. (2004). A customized ERP/SAP Model for Business Curriculum integration.
Journal of Information Systems Education, 15(3), 245-253.
Kumar, K. and Van Hillsgersberg, J. (2000). ERP experiences and evolution. Communications of the ACM, 43(4), 23-26.
https://doi.org/10.1145/332051.332063
Livermore, C. R. and Rippa, P. (2011) ERP Implementation: A Cross-Cultural Perspective. Journal of Global Information Technology
Management, 14(3), 5-26. https://doi.org/10.1080/1097198X.2011.10856541
Lodhi, R. N., Abdullah, M. and Shahzad, A. (2016). An empirical investigation of the effectiveness of ERP Quality: evidence from corporatesector of Pakistan. Journal of Quality and Technology Management, 12(2), 71-88.
Magal, S. and Word, J. (2012). Integrated business processes with ERP sytems. Wiley and Sons Inc. USA
Mohammad, R., Hossain, L. and Patrick, J. D. (2002). The evolution of ERP systems: A historical perspective. Chapter 1 in Enterprise
Resource Planning: Global Opportunities and Challenges, 1-16.
Palomino, M. A. and Whitley, E. A. (2007). The effects of national culture on ERP implementation: a study of Colombia and Switzerland. Enterprise Information Systems, 1(3), 301-325. https://doi.org/10.1080/17517570701504294
Pinto, M., Ramírez-Correa, P. and Grandón, E. (2017). Antecedentes del éxito de los sistemas de planificación de recursos empresariales en las grandes empresas Chilenas: Un modelo factorial exploratorio. Información Tecnológica, 28(3), 139-146.
https://doi.org/10.4067/S0718-07642017000300015
Ramírez, P. and García, R. (2005). Meta-analysis on the implementation of ERP systems, Journal of Information Systems and
Technology Management,2(3), 245-273. https://doi.org/10.4301/S1807-17752005000300002
Ringle, C. M., Wende, S. and Becker, J. M. (2015). SmartPLS 3. Boenningstedt: SmartPLS GmbH. Available at:
http://www.smartpls.com
Salahshour Rad, M., Nilashi, M. and Mohamed Dahlan, H. (2018). Information technology adoption: a review of the literature and classification. Univ Access Inf Soc, 17, 361–390. https://doi.org/10.1007/s10209-017-0534-z
Scholtz, B. M., Kapeso, M. and de Villiers, M. R. R. (2017). The usefulness and ease of use of a mobile simulation application for learning of ERP systems. South African Computer Journal, 29(2), 87-105. https://doi.org/10.18489/sacj.v29i2.475
Seethamraju, R. (2007) Enterprise Systems (ES) Software in Business School Curriculum – Evaluation of Design and Delivery.
Journal of Information Systems Education, 18(1) 69-84.
Sheu, C., Yen, H. R. and Krumwiede, D. W. (2003). The effect of national differences on multinational ERP implementation: an exploratory study. TQM & Business excellence, 14(6), 641–657. https://doi.org/10.1080/1478336032000053807
Soto-Acosta, P., Ramayah, T. and Popa, S. (2013). Explaining intention to use an enterprise resource planning system: A replication and extension. Tehnicki Vjesnik, 20(3), 397-405.
Sternad, S. and Bobek, S. (2013). TAM-based external factors related to ERP solutions acceptance in organizations. International
Journal of Information Systems and Project Management, 1(4), 25-38. https://doi.org/10.12821/IJISPM010402
Strong, J., Fedorowicz, J., Sager, G., Stewart G. and Watson, E. E. (2006). Teaching with Enterprise Systems, Communications of the
Association for Information Systems, 17(33). https://doi.org/10.17705/1CAIS.01733
Venkatesh, V. (2000). Determinants of peceived easy of use: Integrating control, intrinsic motivation, and emotion into the Tecnology Acceptance Model. Information Systems Research, 11(4), 342-365. https://doi.org/10.1287/isre.11.4.342.11872 Venkatesh, V., Morris, M., Davis, G. and Davis, F. (2003). User Acceptance of Information Technology: Toward a Unified View. MIS
Quarterly, 27(3), 425-478. https://doi.org/10.2307/30036540
Vluggen, M. and Bollen, L. (2005). Teaching enterprise resource planning in a business curriculum. Int. J. Information and
Operations Management Education, 1(1), 44-57. https://doi.org/10.1504/IJIOME.2005.007447
Wong, K. K. (2010). Handling small survey sample size ans skewed dataset with partial least square path modellin. The Magazine
APPENDIX A
InstrumentThe following Likert scale was used: 1. Completely agree
2. Mostly agree 3. Somewhat agree 4. Neither agree or disagree 5. Somewhat disagree 6. Mostly disagree 7. Completely disagree
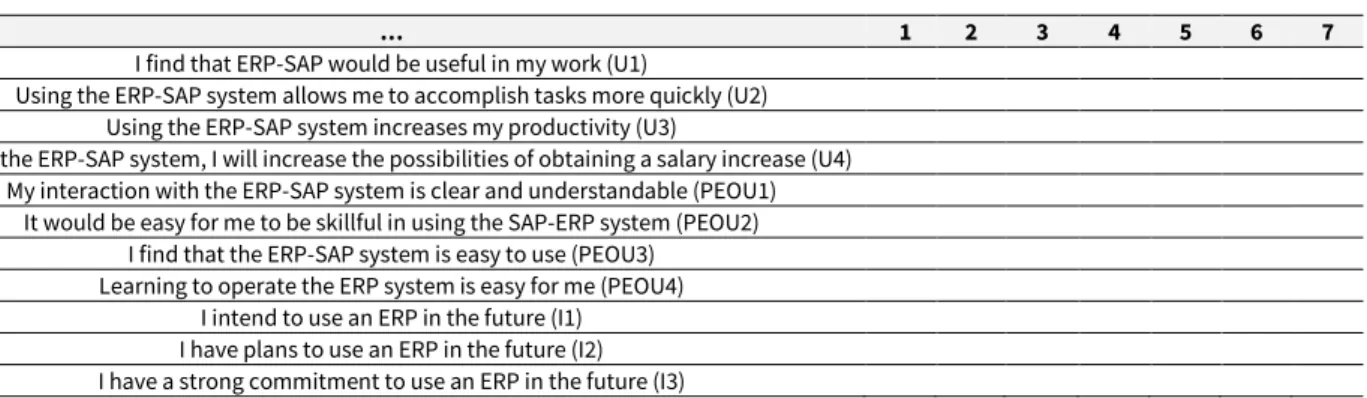
Table 11. The items associated with the constructs
… 1 2 3 4 5 6 7
I find that ERP-SAP would be useful in my work (U1)
Using the ERP-SAP system allows me to accomplish tasks more quickly (U2) Using the ERP-SAP system increases my productivity (U3)
If I use the ERP-SAP system, I will increase the possibilities of obtaining a salary increase (U4) My interaction with the ERP-SAP system is clear and understandable (PEOU1)
It would be easy for me to be skillful in using the SAP-ERP system (PEOU2) I find that the ERP-SAP system is easy to use (PEOU3)
Learning to operate the ERP system is easy for me (PEOU4) I intend to use an ERP in the future (I1)
I have plans to use an ERP in the future (I2) I have a strong commitment to use an ERP in the future (I3)