Stock Return Predictability with Audit Quality Concept
Abdul HalimFaculty of Economics and Business, University of Gajayana Malang, Indonesia
Abstract
Investors of Indonesian Stock Exchange (IDX) have interest to audited financial statements quality. Audit quality describes how well the auditor may detect material misstatements of financial statements, reducing information asymmetry between agents and principals to protect the stakeholder’s interests. This study aim is to test and identifies the effect of price on earnings ratio, dividend yield and book to market ratio of stock return predictability with audit quality as a moderating variable. Study population is audited financial statements of 35 banking firms in 2015 at IDX and 35 public accountants. The population is relatively small so all are used as samples. Primary data is public accountant’s perception to audit quality, obtained by sending a questionnaire to respondents. Secondary data as financial statements and closing share price in 2014-2015 are obtained through access to internet www.idx.co.Id. The data is analyzed by Partial Least Square (PLS). This study results found evidence that price to earnings ratio, dividend yield, and book to market ratio partially affect on stock returns predictability and audit quality enlarge the effect of price to earnings ratio, dividend yield and book to market ratio on stock returns predictability.
Keywords: stock returns, price to earnings ratio, dividend yield, book to market ratio, audit quality.
1. Introduction
Capital market investors expect to get high returns in accordance with the risks. Tandelilin (2010) suggested that return is a reward for investor’s courage to bear risk on investment made. Meanwhile, Wolk et al. (2010) explains that knowing exactly how many return to be earned on an investment in future is a very difficult. Return of investment can only be predicted. Accounting data has useful to predict the financial variables, such as earnings, cash flow, and stock prices in context of "efficient" capital market (new information quickly reflected in securities price). Therefore, it is important to study accounting.
Aras and Yilmaz (2008) investigated in 12 emerging stock markets over the period 1997-2003. Multiple linear regression model is used to predict future returns. The results prove that investors in developing countries can predict stock returns for a one year period, to a certain extent, at high level of probability using Price to Earnings Ratio (PER), Dividend Yield (DY), and Book-to-Market Ratio (BMR ). BMR is the most powerful predictor of stock return, followed by DY, and PER.
Aras and Yilmaz (2008) supports research of Fama and French (1992) that BMR has the greatest power to average US stock returns over the period 1963-1990. Pontiff and Schall (1998) also proved that BMR is a strong predictor of market returns throughout the years 1926-1991. Furthermore, Barry et al. (2002) investigated the robustness of BMR variable in developing countries capital markets over the period 1985-2000. They show a strong positive relationship between BMR and average return. This finding is supported by Maroney and Protopapadakis (2002) that there is strong positive relationship between return and BMR in Australia, Canada, Germany, France, Japan, United Kingdom, and United States.
On other hand, Bae and Kim (1998) and Aydogan and Gursoy (2000) proved that PER is a strong predictor of return. Aydogan and Guney (1997) found the PER and DY is the best predictor of return. Fama and French (1988) proved that DY can predict the average return on New York Stock Exchange within time horizon of one month to 4 years. Lamont (1998) shows that DY can predict stock returns with some success, such as capturing expectations of dividend growth and expected return. Lewellen (2004) uses multiple linear regression model to predict future returns . PER, DY, and BMR become significant predictions to returns. The evidence remains strong despite stock price fluctuates within a few years.
The results of these researchers come into two group. First camp show that BMR is most powerful to predict return, while the second group show that PER and DY are the most powerful to predict return. Jogiyanto (2004) explains that if the previous researchers produce conflicting conclusions, both conflict and conflict significance direction, there may be other variables that moderate them.
Therefore, researchers incorporate Audit Quality (AQ) variable as a moderating variable. The consideration is AQ become one factor to affect the credibility of financial information and a high AQ can produce more accurate information (Davidson and Neu, 1993). In addition, market react positively to company's earnings improvement for a high-quality audit (Gul et al., 2003) and a high-quality audit is more likely to be able to detect and report errors and irregularities (DeAngelo, 1981). Dang et al., (2004) also argued that audit quality describes how well the auditor may detect material misstatements on financial statements, reducing information asymmetry between agents and principals to protect the stakeholder’s interests.
credible financial information, it is important to test and identifies the effect of Price to Earnings Ratio (PER), Dividend Yield (DY), and Book to Market Ratio (BMR) on stock returns predictability with audit quality as a moderating variable.
2. Theory and Hypothesis Development 2.1 Assessment Theory
2.1.1 Return
Return is the result of an investment in a particular period (Jogiyanto, 2010). Return consists of two main components, namely yield and capital gain (loss). Yield is the return to reflect the components of cash flow or income derived from an investment periodically. When investing in stocks, yield is indicated by amount of dividend received.
Meanwhile, Halim (2015) explains that return is the reward earned from investments. Return is divided into two. First is the actual return that calculated from historical data and second is expected return that will be obtained by investors in future. Component of return are: (a) capital gain (loss) as the profit (loss) for investors from excess purchase price on top of sale price which both occur in secondary market, and (b) yield is the income or cash flows received by investors on a periodic basis, for example in form of dividends or interest. Yield is expressed as a percentage of invested capital.
Stock return in this study was measured by formula from Aras and Yilmaz (2008). (Pit- Pit-1) + Dit
Ri,t = Pit-1
Ri,t = realization return of i stock in t period Pit = closing price of i stock in t period Pit-1 = closing price of i stock in period t-1 Dit = dividend per i share in t period 2.1.2 Price to Earnings Ratio
Price to Earnings Ratio (PER) is one approach that frequently used by securities analysts to assess a stock. This approach is based on ratio between the prices per share prevailing on capital market with level of net profit available to shareholders (Tandelilin, 2010). Brigham & Gapenski (2003) suggested that PER indicates the price magnitude that investors are willing to pay for each dollar of earnings reported by company. Meanwhile, Jones (2006) suggested that PER showed optimism and pessimism of investors to company's prospects in future. Confidence and optimism is based on fundamental factors of company in relation to market price performance of company in form of earnings (Luesby, 2005). For example, why are investors willing to pay thirty rupiah to obtain a single rupiah of corporate earnings. This is due to confidence and optimism that future performance of company grow consistently over time and its share price generally increases (Luesby, 2005).
PER in this study is measured by formula of Aras and Yilmaz (2008). Markert price per share
PER = ——————————— Earnings per share 2.1.3 Dividend Yield
Dividend Yield (DY) indicates how much the company pays a dividend to investors than the stock price and represents the percentage of return that goes to shareholders as dividends. Dividend yield of 5% indicates that investors may receive dividends of Rp 0.05 for every penny invested (Ross et al., 2005 and Belke and Polleit, 2006). DY is one factor that often considered by investors in decision making to buy or sell shares (Marpholo, 2008).
DY in this study is measured by formula of Aras and Yilmaz (2008). Dividend per share
DY = —————————— x 100 Market price per share 2.1.4 Book to Market Ratio
Book to Market Ratio (BMR) is defined as the book value of equity divided by market value of equity (Wong et al., 2006). The book value of equity is determined by company's accountants through historical cost information, while the market value of equity is determined by buyers and sellers of stocks using the latest information (Davis, 2001). BMR reflects the difference between what is reported in financial statements under accounting principles generally accepted as the book value of equity and what is reported as the market value (economic value) of equity (Beaver and Ryan, 1993).
Book value per share BMR = —————————— Market value per share 2.1.5 Audit Quality
Audit quality (AQ) describes an auditor competence to found the material misstatement of financial report are independently report their findings to protect the stakeholders interests (DeAngelo, 1981). The same thing was stated by Davidson and Neu (1993) that audit quality is demonstrated by auditor’s ability to found material misstatements and manipulation in financial statements. AQ could not be observed directly and cannot be measured accurately. Therefore, it uses indicators to measure.
AQ in this study is measured by two indicators, namely: (a) the auditor reputation by referring to MacMillan et al. (2004) that reputation will show the public perceptions of past auditor job performance and perform professional standards that consistent with audit process and (b) the auditor of industry specialists refer to Mayhew and Wilkins (2003) that auditors are often assigned to special industries become very adept at identifying and addressing issues specific industry audit, resulting in an audit quality.
2.2 Hypothesis Development
2.2.1. Effect of PER on Return Predictability
Aydogan and Guney (1997) analyze the effect of PER and DY on returns in Istanbul Stock Exchange (ISE). PER and DY show a good indicator to predict future returns. Aydogan and Gursoy (2000) expand the study to cover 19 emerging equity markets. The results reveal that PER and BMR has predictive power on future returns, especially for a longer period of time and can be used as a tool in form of asset allocation strategy in emerging markets in long period. Aras and Yilmaz (2008) examine the stocks predictability in 12 emerging stock markets from 1997 to 2003 period. The results show that PER, DY, and BMR can become fundamental variables to explain returns in stock market. Therefore, the hypothesis is formulated below.
H1: PER affect on returns predictability 2.2.2 Effect of DY to Return Predictability
Mavrides (2000) examines the dynamic relationship between stock returns and DY in American and Japanese equity markets. The result shows that stock returns can be predicted with DY in American and Japanese equity markets. The most striking finding was the DY has most predictive power on returns among other fundamental variables. Wu and Wang (2000) proves that DY and earnings yield produce the same predictive power for future returns. This evidences show found that predictive power of DY on returns is higher for longer time while the predictive power of earnings yield on stock returns his higher for longer time. Aras and Yilmaz (2008) examine the stocks predictability in 12 emerging stock markets, from 1997 to 2003 period. The results show that PER, DY, and BMR can explain returns in stock market. Therefore, the hypothesis is formulated below.
H2: DY affect on returns predictability. 2.2.3. Effect of BMR on Predictability Returns
Dhatt et al (1999) investigated the relation of book-to-market ratio, sales-price, debt-equity ratios, and market value of equity with stock return in Korean capital market. The results showed that book-to-market ratio, sales-price, and debt-equity ratios has positive and significant relation. While the market value of equity does not have significant relation. Among the four variables, book-to-market ratio has a highest correlation to stock return. Akdeniz et al. (2000) examined the company-specific factors to explain stock returns on all non-financial companies during the period 1992 to 1998 at Istanbul Stock Exchange (ISE). The results show that BMR explains a significant correlation to stock return. Aydogan and Gursoy (2000) in a study of 19 emerging equity markets reveals that PER and BMR has predictive power on future returns, especially for a longer period of time and can be used as a tool in form of asset allocation strategy in emerging markets in long periods. Aras and Yilmaz (2008) examine the stocks predictability in 12 emerging stock markets, from 1997 to 2003 period. The results show that PER, DY, and BMR can become fundamental variables to explain returns in stock market. Therefore, the hypothesis is formulated below.
H3: BMR affect on returns predictability.
2.2.4. AQ Moderating the Effect of PER, DY, and BMR on Return Predictability
Schleicher and Walker (1999), Schleicher et al., (2007), and Hussainey and Walker (2009) proved that stock market's ability can predict significantly future changes in annual return when companies provide a higher level of disclosure as a reflection of AQ
Hussainey and Walker (2009) found evidence that stock market's ability to predict changes in future annual return is significantly better in companies that provide a higher level of disclosure. Audited financial statements show high quality information with high value relevance for investors to predict future earnings. Titman and Trueman (1986) also proved that AQ is important consideration for investors in predicting return. Therefore, high-quality audits increase the reliability of financial reporting information and enable investors to make more accurate predictions about the value.
AQ becomes important consideration for investor to predict return. Therefore, audit quality is seen as one factors to affect the credibility of financial information and higher AQ create more accurate information (Davidson and Neu, 1993). Therefore, with more accurate information, investors and potential investors should be expected to be more accurate in predicting future returns. Therefore, the hypotheses are formulated below. H4.1: AQ strengthen the effect of PER on Return Predictability
H4.2: AQ strengthen the effect of DY on Return Predictability H4.3: AQ strengthen the effect of BMR on Return Predictability 3 . Conceptual Framework
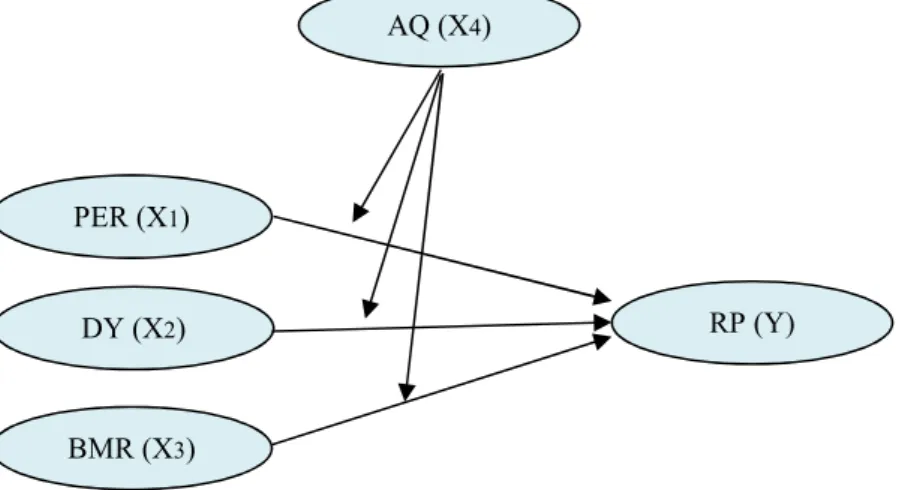
The conceptual framework of this research was developed from research of Fama and French (1992), Pontiff and Schall (1998), Maroney and Protopapadakis (2002), Barry et al. (2002), Aras and Yilmaz (2008) on one hand, and Aydogan and Guney (1997), Lamont (1998), Bae and Kim (1998), Aydogan and Gursoy (2000), Lewellen (2004), on other hand. Both sides found contradictory evidence. Therefore, researchers took into account AQ variable as a moderating variable. The conceptual framework of this study is presented in Figure 1 below.
Figure 1. Conceptual Framework Description:
RP = Return Predictability PER = Price Earnings Ratio DY = Dividend Yield BMR = Book to Market Ratio AQ = Audit Quality
4. Research Methods 4.1 Population and Sample
This study population is 35 audited financial statements at shares closing price of banking companies in Indonesia Stock Exchange and the 35 public accountant in 2014-2015. The population is relatively small (less than 100), so all become samples (Arikunto, 2010).
4.2 Types, Sources and Data Collection Techniques
This study uses primary data of public accountant perception on AQ. The data was collected through a questionnaire sent through the documents delivery services with postage to return back the questionnaires. Respondents are provided five alternative answers with Likert-type scale, namely: strongly agree has score 5, agree has score 4, quite agree has score 3, disagreed has score 2, and strongly disagree has score 1. Thus measurement scale is interval. This study also uses secondary data from the audited financial statements of banking companies in Indonesia Stock Exchange and company's data of closing stock price year 2014-2015. The data was collected through internet access to web IDX: www.idx.co.id.
4.3 Data Analysis Techniques
Data is analyzed by Partial Least Square (PLS) technique [Solimun, 2010]. Before that, the data were analyzed to test the validity, reliability, linearity, and Goodness of Fit Model. The equation is below.
yt = bo + b1x1t-1 + b2x2t-1 + b3x3t-1 + b4x1t-1*x4 + b5x2t-1*x4 + b6x3t-1*x4 + e Where: yt = RP b1.…..b6 = regression coefficient PER (X1) DY (X2) BMR (X3) AQ (X4) RP (Y)
x1 = PER x2 = DY x3 = BMR x4 = AQ
e = confounding variables (other variables) outside of empirical model
5. Results
5.1 Test Results Validity, Reliability, Linearity, and Goodness of Fit Model
Validity test results with Pearson correlation show that p-value is smaller 0.05. These results indicate that items in questionnaires are valid. Meanwhile, reliability test with Cronbach Alpha show that Cronbach alpha values exceeding 0.6. These results indicate that all items in questionnaire are reliable.
Linearity assumption is tested by Curve Fit. The result shows that linear model for fourth hypothesis less than 0.05 for all possible models. These results indicate that the linear is model. Goodness of Fit Model test results with R2 has value of 0.7147 or 71.47 percent. The predictive relevance indicates that information contained in data 71.47 percent can be explained by model. The remaining 28.53 percent is explained by other variables outside the model and error. These results say that PLS model is good. Therefore, the model can be used to test the hypothesis.
5.2 Hypothesis Testing Results
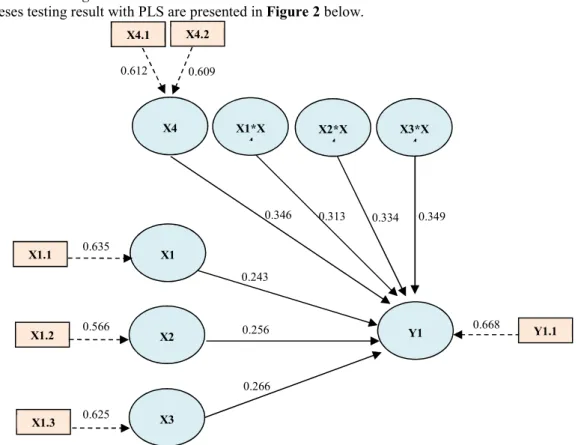
Hypotheses testing result with PLS are presented in Figure 2 below.
Figure 2. Hypotheses Testing Result 5.2.1 Effect of PER to Return Predictability
The hypothesis testing results with PLS are presented in Table 1. P-value 0.023 is smaller than alpha 5%. It indicates that BMR affect on returns predictability. The estimated value of inner weight coefficient is positive. It indicates a positive relationship. Higher the PER will more accurate to predict return. Therefore, hypothesis 1 which states that PER affect on return predictability is accepted.
5.2.2 Effect of DY to Return Predictability
The hypothesis testing results with PLS are presented in Table 1. P-value 0.025 is smaller than alpha 0.05. It indicates that DY affect on returns predictability. The estimated value of inner weight coefficient is positive. It indicates a positive relationship. Higher the DY will more accurate to predict return. Therefore, hypothesis 2 which states that DY affect on return predictability is accepted.
5.2.3 Effect of BMR to Return Predictability
The hypothesis testing results with PLS are presented in Table 1. P-value 0.020 is smaller than alpha 0.05. It indicates that BMR affect on returns predictability. The estimated value of inner weight coefficient is positive. It
0.346 0.256 0.334 0.635 0.349 0.313 0.243 0.266 0.668 0.609 0.612 0.849 0.566 X1.1 X1.2 X4 X4.2 Y1 Y1.1 X3*X 4 X3 X1 X2*X 4 X4.1 X1*X 4 X2 0.625 X1.3
indicates a positive relationship. Higher the BMR will more accurate to predict return. Therefore, hypothesis 3 which states that BMR affect on return predictability is accepted.
5.2.4 AQ Strengthening the Effect of PER on Return Predictability
The hypothesis testing results with PLS are presented in Table 1. P-value 0.025 is smaller than alpha 0.05. It indicates that OQ moderates the effect of PER on returns predictability. The estimated value of inner weight coefficient is positive. It indicates a positive relationship. Higher the AQ will strengthen the effect of PER on return predictability. Therefore, hypothesis 4.1 that AQ strengthen the effect of PER on return predictability is accepted.
5.2.5 AQ Strengthening the Effect of DY on Return Predictability
The hypothesis testing results with PLS are presented in Table 1. P-value 0.022 is smaller than alpha 0.05. It indicates that OQ moderates the effect of DY on returns predictability. The estimated value of inner weight coefficient is positive. It indicates a positive relationship. Higher the AQ will strengthen the effect of DY on return predictability. Therefore, hypothesis 4.2 that AQ strengthen the effect of DY on return predictability is accepted.
5.2.6 AQ Strengthening the Effect of BMR on Return Predictability
The hypothesis testing results with PLS are presented in Table 1. P-value 0.024 is smaller than alpha 0.05. It indicates that OQ moderates the effect of BMR on returns predictability. The estimated value of inner weight coefficient is positive. It indicates a positive relationship. Higher the AQ will strengthen the effect of BMR on return predictability. Therefore, hypothesis 4.3 that AQ strengthen the effect of BMR on return predictability is accepted.
5.3 Discussion
This study proves that AQ can improve/strengthen the effect PER, DY, and BMR on return predictability. This study measure the AQ through auditor reputation and industry specialists auditor.
Reputation show public perceptions about the past performance of auditors regarding the audit quality and standards of professional conduct that is consistent in audit process (MacMillan et al., 2004). Vallens (2008) stated that its reputation is built slowly over the long term through consistent ethical behavior. It is an invaluable asset that must be developed carefully, protected, and monitored at any time. Consequently, auditor's reputation increase clients interest, has a competitive advantage, and has a higher market value
It can be stated that reputation is public trust. If the Public Accounting Firm (KAP) experienced a crisis of public confidence, it will have a negative impact on reputation and will require much effort to grow and rebuild that trust. Reputation is a value given by stakeholders as a collective manifestation and culmination of actions and results of company in past to reflects the firm's ability to produce the output required by stakeholders.
Related with industry specialist auditors, Mayhew and Wilkins (2003) argued that auditors that often assigned to special industries become very adept at identifying and addressing audit issues of specific industry, resulting in a quality audit. Meanwhile, Cahan et al. (2008) documented that industry specialists auditor become an important factor with regard to audit quality, because they have superior knowledge and specialized auditors make costly investments in specialized industry knowledge. It enables them to offer a different product audit, audit quality. The same thing is also expressed by Lowensohn et al. (2007) about a positive relationship between industry specialist auditors with audit quality.
Auditor industry specialists can help KAP to increase audit or non-audit demand. Specialist industry auditor also has potential to improve the efficiency of firm through the economies scale from investments concentrated on specific resources and industrial. In addition, industry specialist auditor will more effective to detect errors and more accurate to assess the audit risk that affect the audit quality (Beasley and Petroni 2001 and Owhoso et al., 2002).
Neal and Riley (2004) suggest that the industry specialist auditors are reflected by firm that distinguished itself from its competitors in market share of a particular industry. KAP with largest market share has greatest knowledge in specific industries and significant market share in a particular industry reflects a significant investment by firm in developing industry-specific audit technology with benefits of audit quality improvement.
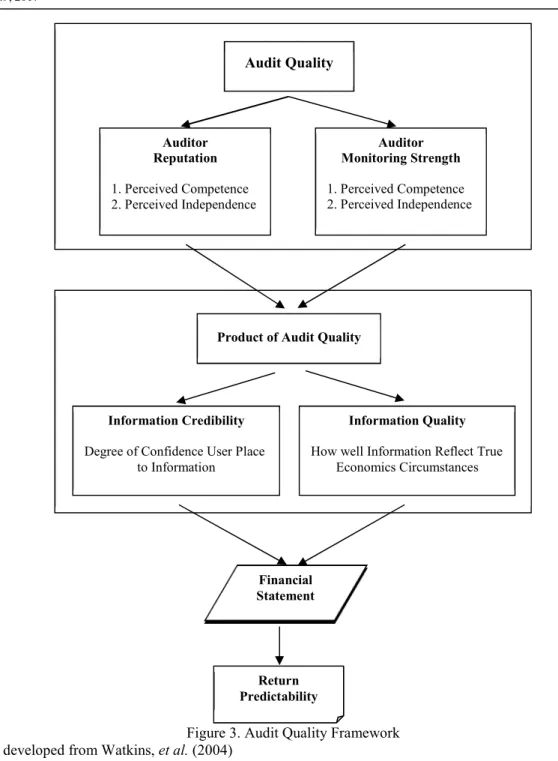
High audit quality with indicator of auditor's reputation and industry specialists auditors will able to increase the credibility of information and to improve the information quality. Auditor's reputation and effectiveness of monitoring force is affected by competence and independence of auditors. Auditor reputation affect on how the information is credible or reliable information is perceived. It is related to market perceptions about the competence and independence of auditors. It represents the auditors ability to enhance the credibility of financial statements (even in improving the information quality).
Figure 3. Audit Quality Framework Source: developed from Watkins, et al. (2004)
6. Conclusion and Implications
It can be concluded PER, DY, and BMR partially affect on stock returns predictability and AQ strengthen the effect of PER, DY and BMR the stock return predictability. Meanwhile, AQ partially able to increase the effect of PER, DY, and BMR on stock returns predictability. The existence of a quality audit will be able to increase the information credibility and able to improve the information quality. Credible information is indicated by level of user confidence to that information. Meanwhile, quality information is indicated by how well the information reflects the truth about the economic conditions informed.
These findings have implication to firm and its auditors, in particularly future AQ in an effort to improve the quality of audit. It should pay attention to indicators of audit quality. Auditor needs to improve the reputation and should increase the number of specialist auditors in certain industries.
References
Akdeniz, L., A. Altay, and K. Aydogan. 2000. Cross Section of Expected Stock Returns in the ISE. http://www.bilkent.edu.tr/~aydogan/ CrossSection.pdf
Aras, G., and M. K. Yilmaz. 2008. Price Earning Ratio, Dividend Yield, and Market to Book Ratio to Predict
Auditor Reputation 1. Perceived Competence 2. Perceived Independence Auditor Monitoring Strength 1. Perceived Competence 2. Perceived Independence Information Credibility
Degree of Confidence User Place to Information
Information Quality
How well Information Reflect True Economics Circumstances
Financial Statement Audit Quality
Product of Audit Quality
Return Predictability
Return on Stock Market: Evidence from the Emerging Markets. Journal of Global Business and Technology, Spring, Vol. 4, Iss 1: 18-31
Arikunto. S. 2010. Prosedur Penelitian Suatu Pendekatan Praktik. Ghalia Indonesia. Jakarta.
Aydogan, K., and G. Gursoy. 2000. P/E and Price-to-Book Ratios as Predictors of Stock Returns in Emerging
Equity Markets. Istambul Stock Exchange (ISE) Review, August-October: 145-161
Aydogan, K., and A. Guney. 1997. Price-Earnings Ratio and Dividend Yield as Predictors of Stock Returns. Istambul Stock Exchange (ISE) Review, January-March: 83-96
Bae, K. H., and J. B. Kim. 1998. The Usefulness of Earnings versus Book Value for Predicting Stock Returns
and Cross Corporate Ownership in Japan. Japan and the World Economy, 10: 467-485.
Barry, C. B., E. Goldreyer, L. Lockwood, and M. Rodriguez. 2002. Robustness of Size and Value Effects in
Emerging Equity Markets, 1985–2000. Emerging Markets Review, 6:1–30.
Beasley, M. and K. Petroni. 2001. Board independence and Audit-firm Type. Auditing: A Journal of Practice
and Theory. (March). Vol 20 iss.1: 97-114.
Beaver, W. H., W. H., and S. G. Ryan. 1993. Accounting Fundamentals of the Book-to-Market Ratio. Financial
Analysts Journal. Vol. 49, Iss. 6: 50-57
Belke, A., and T. Polleit. 2006. Dividend Yields for Forecasting Stock Market Returns. An ARDL Cointegration Analysis Article. The Journal of the Cyprus Economic Society, Vol. 9, Iss. 1: 86-116
Cahan, S. F., J. M. Godfrey, J. Hamilton, and D. C. Jeter. 2008. Auditor Specialization, Auditor Dominance, and Audit Fees: The Role of Investment Opportunities. The Accounting Review. (Nov.). Vol. 83. Iss. 6: 1393-1424.
Dang, L., K. F. Brown, and B. D. McCullough. 2004. Assessing Actual Audit Quality: A Value Relevance Perspective. Working Paper. http://www.ssrn.com
Davidson, R. A., and D. Neu. 1993. A Note on Association between Audit Firm Size and Audit Quality. Contemporary Accounting Research, Vol. 9, No. 2: 479-488.
Davis, J. L., 2001. Is There Still Value in the Book-to-Market Ratio?. http://www.dfaau.com/library/articles Dhatt, M. S., Y. H. Kim, and S. Mukherji. 1999. Relations between Stock Returns and Fundamental Variables:
Evidence from a Segmented Market. Asia - Pacific Financial Markets, Sep., Vol. 6, Iss. 3: 221-245 DeAngelo, L. E., 1981. Auditor Size and Auditor Quality. Journal of Accounting & Economics, December:
183-199.
Fama, E. F., and K. R. French. 1992. The Cross Section of Expected Stock Returns. Journal of Finance, Vol. 47, No. 2 (June): 427-466.
…………1988. Dividend Yields and Expected Stock Returns. Journal of Financial Economics, 33, pp. 3-56.
Gul, F. A., S. Y. J. Sun, and J. S. L. Tsui. 2003. Tracks: Audit Quality, Earning, and the Shanghai Stock Market Reaction. Journal of Accounting, Auditing & Finance, Summer, Vol. 18, 3: 411-437.
Halim, A. 2015. Analisis Investasi di Aset Keuangan. Mitra Wacana Media. Jakarta
Hussainey, K., and M. Walker. 2009. The Effects of Voluntary Disclosure Policy and Dividend Propensity on Prices Leading Earnings. Accounting & Business Research, Vol. 39, No.1: 1173-1190.
Jogiyanto.. 2004. Metodologi Penelitian Bisnis: salah kaprah dan pengalaman-pengalaman. BPFE. Yogyakarta
Jogiyanto. 2010. Teori Portofolio dan Analisis Investasi. Edisi ketujuh. BPFE. Yogyakarta
Jones, C. P. 2006. Investment Analysis and Management. Fifth Edition. John Willey & Sons. Inc. New York Lamont, O. 1998. Earnings and Expected Returns. Journal of Finance, 53: 1563-1587
Lewellen, J. W. 2004. Predicting Returns with Financial Ratios. Journal of Financial Economics, Vol. 74, Iss. 2,: 209–235.
Lowensohn, S., L. E. Johnson, R. J. Elder, and S. P. Davies. 2007. Auditor Specialization, Perceived Audit Quality, and Audit Fees in the Local Government Audit Market. Journal of Accounting & Public Policy. Vol. 26:705–732
Luesby, J. 2005. Interpreting the Price/Earnings Ratio - Why Connect Price to Earnings?. (http://www. economics. about.com.)
MacMillan, K., K. Money, S. Downing, and C. Hillenbrand. 2004. Giving your Organisation SPIRIT: An Overview and Call to Action for Directors on Issues of Corporate Governance, Coporate Reputation and Corporate Responsibility. Journal of General Management. Vol. 30: 15-42.
Maroney, N., and A. Protopapadakis. 2002. The Book-to-Market and Size Effects in a General Asset Pricing
Model: Evidence from Seven National Markets. European Finance Review, 6: 189–221.
Marpholo, T. 2008. Analyze The Abnormal Return Influence to Dividend Yield in Jakarta Stock Exchange. Theses from PFEUGM. Yogyakarta
Mayhew, B. W. and M. S. Wilkins. 2003. Audit Firm Industry Specialization as a Differentiation Strategy: Evidence from Fees Charged to Firms Going Public. Auditing: A Journal of Practice and Theory. (Sept.), Vol. 22. Iss. 2: 33-50
Finance, Vol. 26, Iss. 12: 13-27
Neal, T. L. and R. R. Riley Jr. 2004. Auditor Industry Specialist Research Design. Auditing: A Journal of Practice & Theory. Vol. 23.Iss. 2: 169–179.
Owhoso, V. E., W. F. Messier Jr., and J. G. Lynch Jr. 2002. Error Detection by Industry-Specialized Teams During Sequential Audit Review. Journal of Accounting Research. (June). Vol. 40: 883-900
Pontiff, J., and L. D. Schall. 1998. Book-to-Market Ratios as Predictors of Market Returns. Journal of Financial Economics, Aug. Vol. 49, Iss. 2: 141-161.
Ross, S. A., R. W. Westerfield, and J. Jafe. 2005. Corporate Finance. Seventh Edition. McGraw-Hill International Edition. USA
Schleicher, T, and M. Walker. 1999. Share Price Anticipation of Earnings and Management's Discussion of Operations and Financing. Accounting & Business Research, Vol. 29, Iss. 4: 321-340
Tandelilin, E. 2001. Analisis Investasi dan Manajemen Portofolio. Edisi Pertama. BPFE. Yogyakarta.
Solimun. 2010. Analisis Multivariat Pemodelan Struktural: Metode PARSIAL Least Square-PLS. CV. Citra. Malang.
Tandelilin, E. 2010. Analisis Investasi dan Manajemen Portofolio. BPFE. Yogyakarta
Watkins, A. J., W. Hillison, and S. E. Morecroft. 2004. Audit Quality: A Synthetis Theory and Empirical Evidence. Journal of Accounting Literature. Vol. 23: 153-194.
Wolk, H. I., M. G. Tearney, and J. L. Dodd. 2010. Accounting Theory A Conceptual and Institutional Approach. South-Western College Publishing. Ohio
Wong, K. A., R. S. K. Tan, and W. Liu. 2006. The Cross-Section of Stock Returns on the Shanghai Stock Exchange. Review of Quantitative Finance and Accounting, 26: 23–39
Wu, C., and X. M. Wang. 2000. The Predictive Ability of Dividend and Earnings Yields for Long-Term Stock Returns. The Financial Review, May, Vol. 35, Iss. 2: 97-115