STUDI: A model to simulate the impacts of new metro lines
on urban development in London
by
Aris Christodoulou
A thesis submitted to the University College London
for the degree of Doctor of Philosophy
Centre for Transport Studies
January 2010
Declaration
I, Aris Christodoulou, confirm that the work presented in this dissertation is my own. Where information has been derived from other sources, I confirm that this has been indicated in the dissertation.
Acknowledgements
The following are acknowledged for their assistance during the conduction of this thesis: Roger Mackett for his supervision, guidance, support and encouragement during the past three years, the time he spent is appreciated greatly;
Transport for London for its financial support and for providing data; more specifically, Shashi Verma for the interesting discussions and comments, Lauren Sager Weinstein for organising the provision of resources, and Mike Collop, Simon Cooper and Clifford Chow for providing data;
Peter Jones for the discussions in the early stages of the research;
Kamal Achuthan for his help with ArcGIS and Evgenios Xanthis for his advice on various IT issues.
Finally, all members of the Centre for Transport Studies for providing an excellent research environment.
Abstract
Urban systems are complex and change as a result of the interactions between their main elements. In order to model urban systems effectively, the dynamics of the relationships between these elements need to be considered. This thesis investigates the interactions between transport and urban development, focusing on the impacts of new metro lines. A new model is developed for this purpose: the STUDI (Simulation of Transport and Urban Development Interactions) model.
The main concept underlying the STUDI model is that the impacts of new transport infrastructure on urban development are reflected in the interactions between the main agents involved in the process, which are authorities, developers, businesses and population. The STUDI model contains three main interrelated sub-models: the development, the business and the population sub-models.
The development sub-model is a regression model forecasting the number of new commercial and residential premises, and the business and population sub-models are microsimulation models. The business sub-model simulates business start-ups and closures and business location and relocation decisions. The population sub-model simulates in- and out-migration, demographic and employment change, and residential location decisions. The main results include changes in the spatial distributions of development, businesses and population over time under different transport supply scenarios.
The STUDI model has been developed for London in order to test the wider impacts of new metro lines. First it has been applied to evaluate the impacts of the Jubilee Line Extension (JLE) and then it was used to forecast the impacts of a line to open in the future: the East London Line Extension. Both cases indicate the positive impact of new transport infrastructure on urban development.
Contents
1 Introduction... 12
2 Agents of urban development ... 17
2.1 Authorities... 19 2.2 Developers ... 21 2.3 Organisations - Businesses ... 24 2.4 Population ... 27 2.4.1 Residence ... 28 2.4.2 Employment... 29
2.5 Summary of impacts of new transport investments on urban development ... 31
2.6 Interactions between the agents of urban development ... 32
3 Review of land use – transport models ... 34
3.1 Optimising models (mathematical programming models) ... 35
3.2 Forecasting models ... 36
3.2.1 Aggregate forecasting models... 36
3.2.1.1 Regression Models... 36
3.2.1.2 Spatial Interaction Models ... 37
3.2.1.3 Spatial Input – Output Models... 38
3.2.1.4 Activity Based Models... 40
3.2.2 Disaggregate forecasting models ... 41
3.2.2.1 Discrete Choice Models (Random Utility Models) ... 41
3.2.2.2 Random Bid Models ... 43
3.2.2.3 Cellular Automaton Models... 44
3.2.2.4 Microsimulation Models... 44
3.3 Summary ... 50
4 Data ... 52
4.1 Travel time estimates ... 52
4.1.1 CAPITAL... 52
4.1.2 Railplan ... 53
4.1.3 Combination of CAPITAL and Railplan data ... 54
4.2 Development data ... 58
4.3 Business data... 60
4.4 Population data... 62
4.5 Total-sample population compatibility ... 65
5 STUDI model – Theoretical description... 67
5.1 Development sub-model ... 72
5.2 Business sub-model ... 74
5.2.1 Connection with development and population sub-models ... 75
5.2.2 Forecast of business closures and start-ups ... 75
5.2.3 Business closures ... 78
5.2.4 Business start-ups ... 80
5.2.5 Business relocation ... 82
5.2.5.1 Selection of businesses to look for new location ... 82
5.2.5.2 Location choices of businesses ... 83
5.2.7 Aggregate results ... 88
5.3 Population sub-model ... 88
5.3.1 Connection to development and business sub-models ... 88
5.3.2 Migration... 90
5.3.2.1 Out-migration... 90
5.3.2.2 In-migration ... 91
5.3.2.2.1 Identify households to migrate in London ... 91
5.3.2.2.2 Job allocation... 92 5.3.2.2.3 Residence allocation... 93 5.3.3 Population demographics... 95 5.3.3.1 Ageing... 95 5.3.3.2 Deaths ... 96 5.3.3.3 Births... 96 5.3.3.4 Household dissolution... 97 5.3.3.5 Household formation ... 99 5.3.4 Employment... 101
5.3.4.1 Employment status and employment location change... 101
5.3.4.2 Employment location decisions ... 102
5.3.5 Residential location... 104
5.3.5.1 Location choice by separated people who did not find a match ... 104
5.3.5.2 Search for dwelling by newly formed couples ... 105
5.3.5.3 Residential location decisions... 106
6 Estimation, Calibration and Validation of the STUDI model... 109
6.1 Calibration... 109 6.1.1 Development sub-model ... 110 6.1.1.1 Commercial premises... 110 6.1.1.2 Residential premises ... 115 6.1.2 Business sub-model ... 118 6.1.2.1 Businesses-GDP relation ... 118 6.1.2.2 Business relocation ... 119 6.1.3 Population ... 124 6.1.3.1 Migration... 124 6.1.3.2 Employment location ... 125 6.1.3.3 Residential location... 126
6.1.4 Connection between sub -models ... 130
6.2 Validation... 131 6.2.1 Development sub-model ... 132 6.2.1.1 Residential development... 132 6.2.1.2 Commercial development ... 137 6.2.2 Business sub-model ... 142 6.2.3 Population sub-model ... 148 6.2.4 Stochastic variation... 152 6.2.4.1 Commercial development ... 152 6.2.4.2 Businesses ... 153 6.2.4.3 Population ... 154 6.3 Summary ... 156
7 The Jubilee Line Extension (JLE) application... 158
7.1 Comparative statistics of the different runs of STUDI ... 159
7.2 Development sub-model ... 167 7.2.1 Residential development... 168 7.2.2 Commercial development ... 169 7.3 Business sub-model ... 172 7.4 Population sub-model ... 181 7.4.1 Demographics ... 181 7.4.2 Residential location... 184 7.4.3 Employment... 193 7.5 Summary ... 195
8 The East London Line Extension (ELLX) application ... 197
8.1 Travel-time changes due to East London Line Extension ... 199
8.2 Development sub-model ... 203 8.2.1 Residential development... 203 8.2.2 Commercial development ... 204 8.3 Business sub-model ... 207 8.4 Population sub-model ... 212 8.5 Summary ... 218 9 Discussion ... 219
9.1 Connection of the main sub-models ... 219
9.2 Development sub-model ... 221 9.3 Business sub-model ... 223 9.4 Population sub-model ... 225 9.5 Other issues... 228 10 Conclusions... 229 References... 231 Appendix... 239
List of Figures
Figure 2.1: Map of the JLE (taken from Transport Studies Group, 2004) ... 18
Figure 2.2: Procedures of urban development ... 32
Figure 4.1: Boroughs of London... 53
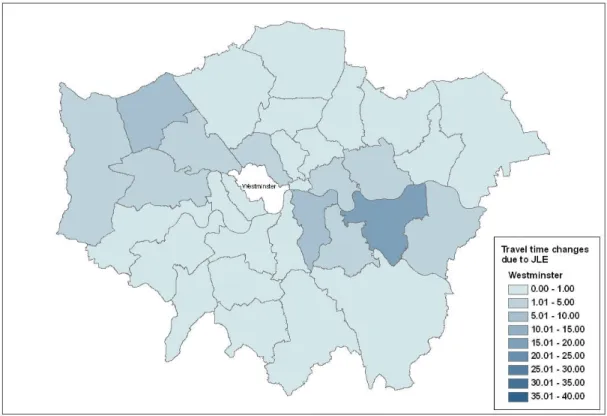
Figure 4.2: Changes in travel times from Westminster due to JLE ... 55
Figure 4.3: Changes in travel times from Lambeth due to JLE ... 55
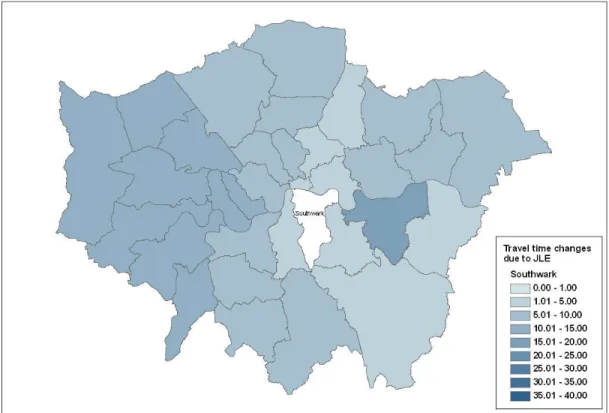
Figure 4.4: Changes in travel times from Southwark due to JLE... 56
Figure 4.5: Changes in travel times from Greenwich due to JLE... 56
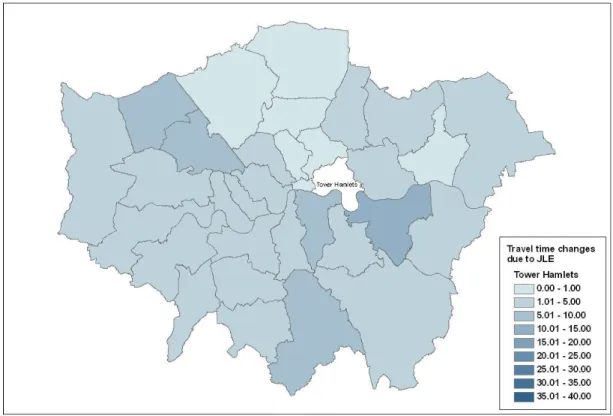
Figure 4.6: Changes in travel times from Tower Hamlets due to JLE ... 57
Figure 4.7: Changes in travel times from Newham due to JLE... 57
Figure 5.1: Agents of urban development – Sub-models of the STUDI model ... 67
Figure 5.2: The main sub-models of the STUDI model ... 70
Figure 5.3: Adding new businesses using zone attractiveness ... 78
Figure 5.4: Business closures and start-ups ... 80
Figure 5.5: Selection of businesses considering relocation ... 83
Figure 5.6: Modelling of business location decisions... 86
Figure 5.7: In-migration... 94
Figure 5.8: Births ... 98
Figure 5.9: Household formation... 100
Figure 5.10: Employment status changes ... 103
Figure 5.11: Employment location decisions ... 105
Figure 5.12: Households considering relocation ... 107
Figure 5.13: Residential location decisions ... 108
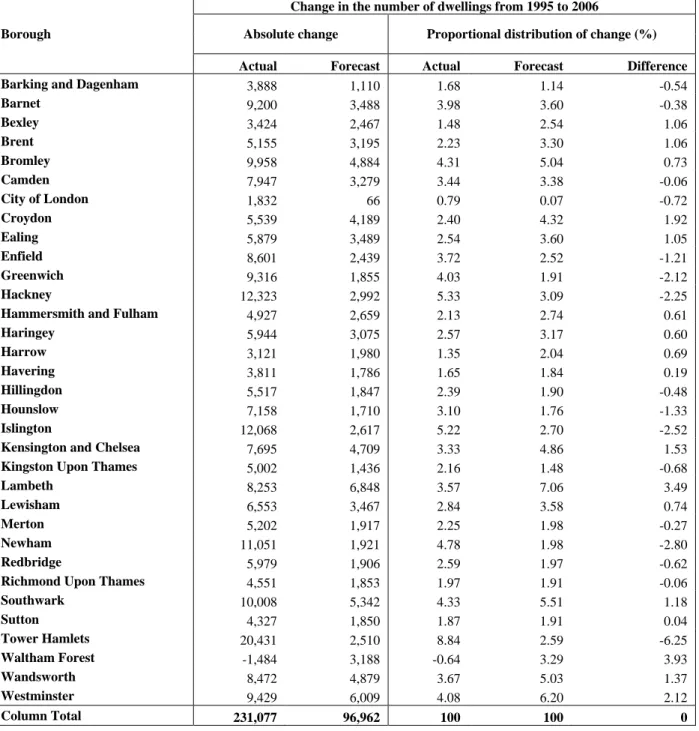
Figure 6.1: Forecast - Actual proportional distributions of change of dwellings ... 137
Figure 6.2: Forecast - Actual proportional distributions of change for commercial premises ... 138
Figure 6.3: Forecast - Actual proportional distributions of change in the number of businesses... 143
Figure 6.4: Total number of commercial premises in each borough (forecast)... 153
Figure 6.5: Change in the number of commercial premises in each borough (forecast) 153 Figure 6.6: Total number of businesses in each borough (forecast) ... 154
Figure 6.7: Changes in the number of businesses in each borough ... 154
Figure 6.8: Total population in each borough (forecast) ... 155
Figure 6.9: Population changes in each borough ... 155
Figure 7.1: Boroughs of London... 159
Figure 7.2: Difference of number of new dwellings forecast with and without the JLE 168 Figure 7.3: Difference of the number of new commercial premises forecast with and without the JLE ... 170
Figure 7.4: Annual change of the number of commercial premises in Tower Hamlets . 171 Figure 7.5: Annual variation of vacant and commercial premises in Lambeth ... 171
Figure 7.6: Industrial sector distribution of businesses in London in years 1995 (actual) and 2006 (forecast) ... 173
Figure 7.7: Difference of the number of new businesses added from 1995 to 2006 as forecast with and without the JLE ... 174
Figure 7.9: Annual change of the number of businesses in Tower Hamlets ... 175
Figure 7.10: Annual change of accessible employees ... 178
Figure 7.11: Annual change of attractiveness of Greenwich ... 180
Figure 7.12: Annual change of number of businesses in Greenwich ... 180
Figure 7.13: Age distribution of population in London in 1995 (LATS data) and 2006 ( forecast)... 182
Figure 7.14: Distribution of population in London according to their household structure in 1995 and in 2006... 183
Figure 7.15: Employment status distribution of London population in 1995 (LATS data) and 2006 (forecast) ... 183
Figure 7.16: Household income distribution of London population in 1995 (LATS data) and 2006 (forecast) ... 184
Figure 7.17: Difference of population changes from 1995 to 2006, forecast with and without the JLE ... 185
Figure 7.18: Annual change of accessible businesses ... 188
Figure 7.19: Annual variation of attractiveness of Lambeth and Southwark ... 189
Figure 7.20: Population in Tower Hamlets - time series ... 190
Figure 7.21: Difference of employment changes from 1995 to 2006 forecast with and without the JLE ... 194
Figure 8.1: East London Line Extension (TfL 2009) ... 198
Figure 8.2: Boroughs of London and ELLX boroughs... 200
Figure 8.3: Changes in travel times from Hackney due to ELLX ... 200
Figure 8.4: Changes in travel times from Tower Hamlets due to ELLX... 201
Figure 8.5: Changes in travel times from Southwark due to ELLX ... 201
Figure 8.6: Changes in travel times from Lewisham due to ELLX... 202
Figure 8.7: Changes in travel times from Croydon due to ELLX ... 202
Figure 8.8: Difference of number of new dwellings forecast with and without the ELLX ... 204
Figure 8.9: Difference of the number of new commercial premises forecast with and without the ELLX ... 205
Figure 8.10: Annual change of the number of commercial premises in Lewisham ... 206
Figure 8.11: Annual change of the number of commercial premises in Hackney... 206
Figure 8.12: Difference of the number of new businesses added from 2006 to 2016 forecast with and without the ELLX... 208
Figure 8.13: Annual change of the number of businesses in Hackney... 209
Figure 8.14: Annual change of the number of businesses in Lewisham ... 209
Figure 8.15: Annual change of accessible employees ... 210
Figure 8.16: Annual change of attractiveness of Hackney ... 211
Figure 8.17: Annual change of attractiveness of Lewisham... 212
Figure 8.18: Difference of population changes from 2006 to 2016, forecast with and without the ELLX ... 213
Figure 8.19: Annual change of accessible businesses ... 214
List of Tables
Table 2.1: Interactions between the agents of urban development ... 33
Table 3.1: Land use - transport modelling methodologies ... 51
Table 4.1: Data sources of the development sub-model ... 59
Table 4.2: Industrial sectors... 60
Table 4.3: Size of businesses ... 60
Table 4.4: Business Growth... 61
Table 4.5: Business database (individual business records) ... 62
Table 4.6: Variables of the population database... 63
Table 4.7: Boroughs in LATS data ... 64
Table 4.8: Population data ... 66
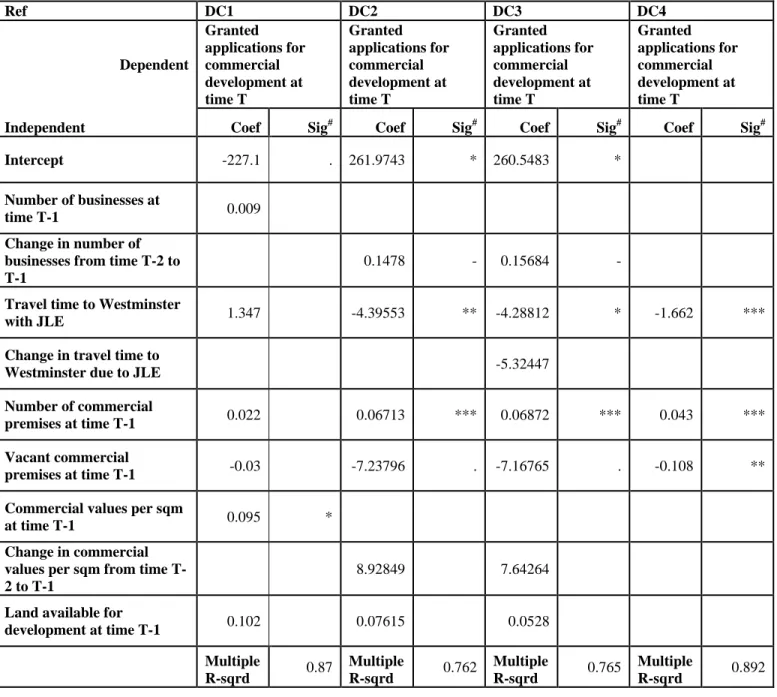
Table 6.1: Explanatory regression analysis of the commercial development location process using travel time to Westminster ... 111
Table 6.2: Explanatory regression analysis of the commercial development location process using travel time to London Bridge ... 112
Table 6.3: Explanatory regression analysis of the residential development location process using travel time to Westminster ... 116
Table 6.4: Explanatory regression analysis of the residential development location process using travel time to London Bridge ... 117
Table 6.5: Forecast of number of businesses according to GDP ... 119
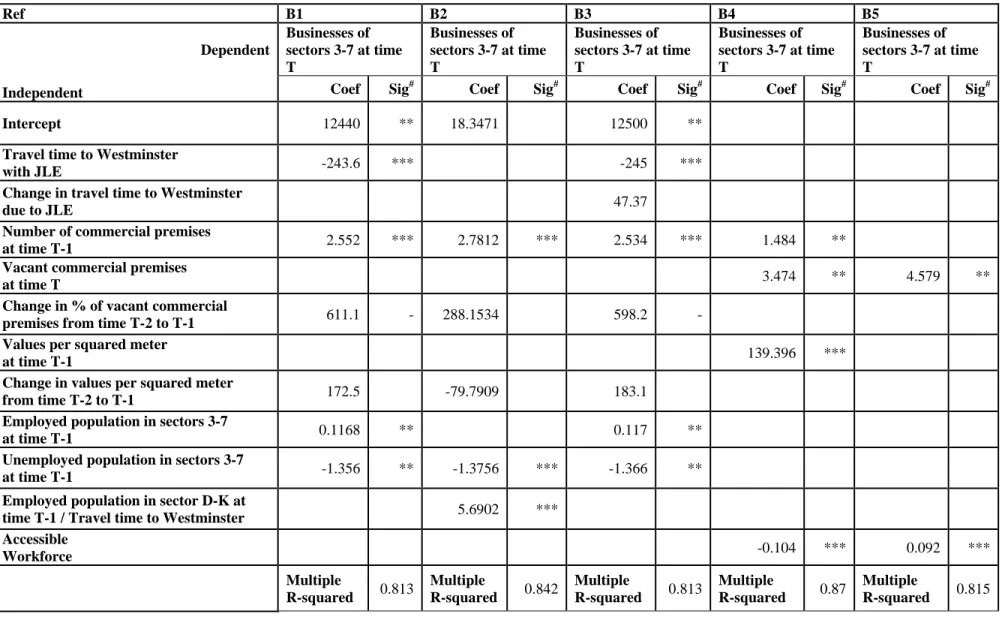
Table 6.6: Explanatory regression analysis of the business location process using travel time to Westminster and accessible workforce... 121
Table 6.7: Explanatory regression analysis of the business location process using travel time to London Bridge ... 122
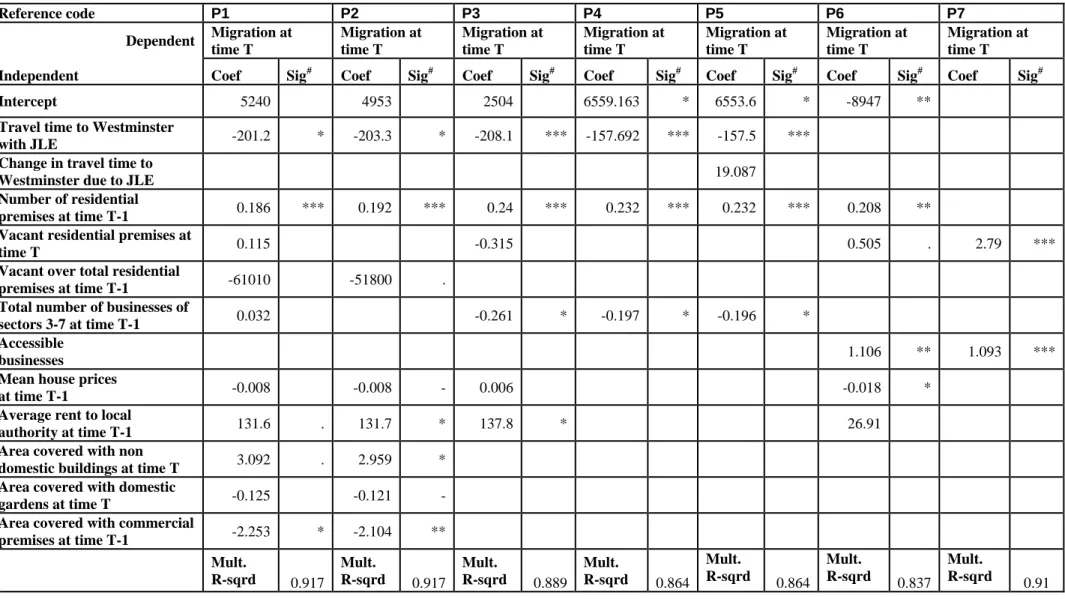
Table 6.8: Explanatory regression analysis of the residential location process using travel time to Westminster and accessible workforce... 127
Table 6.9: Explanatory regression analysis of the residential location process using travel time to London Bridge ... 128
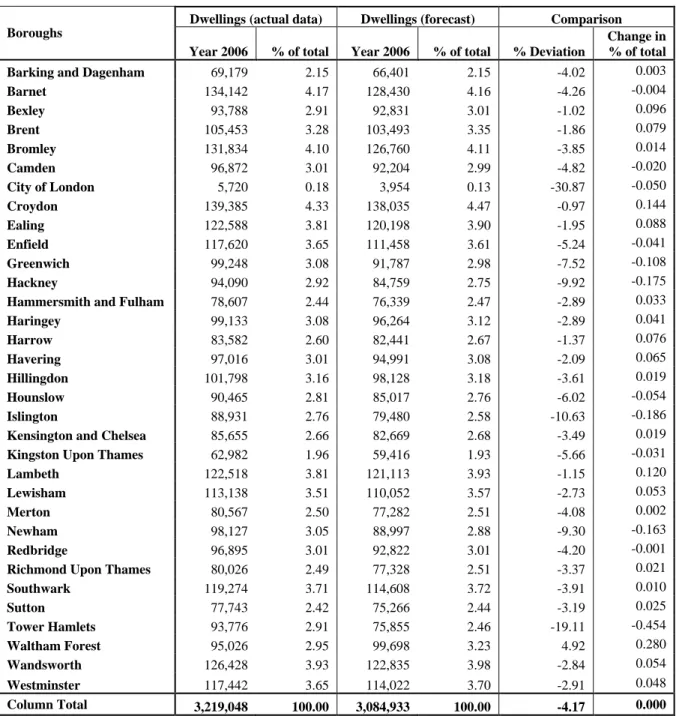
Table 6.10: Validation of the simulation results for 2001 against the actual data... 134
Table 6.11: Validation of the simulation results for 2006 against the actual data... 135
Table 6.12: Changes over time in the number of residential premises... 136
Table 6.13: Validation of the simulation results for 2001 against the actual data... 139
Table 6.14: Validation of the simulation results for 2006 against the actual data... 140
Table 6.15: Changes over time in the number of commercial premises... 141
Table 6.16: Validation of the business simulation results for 2001 against the actual data ... 144
Table 6.17: Validation of the business simulation results for 2006 against the actual data ... 145
Table 6.18: Changes over time in the number of businesses... 146
Table 6.19: New businesses in London from 1995 to 2006 ... 147
Table 6.20: Validation of the population simulation results for 2001 against the actual data... 149
Table 6.21: Validation of the population simulation results for 2006 against the ONS mid-year population estimates ... 150
Table 6.23: Reference codes of London Boroughs... 156
Table 7.1: Comparative statistics for commercial premises (no JLE) ... 162
Table 7.2: Comparative statistics for businesses (no JLE) ... 163
Table 7.3: Comparative statistics for population (no JLE) ... 164
Table 7.4: Comparative statistics for commercial premises (JLE) ... 165
Table 7.5: Comparative statistics for businesses (JLE) ... 166
Table 7.6: Comparative statistics for population (JLE) ... 167
Table 7.7: Residential development in 2006 in aggregate areas (forecast) ... 169
Table 7.8: Commercial development in 2006 in aggregate areas (forecast)... 170
Table 7.9: Total number of businesses in aggregate areas (forecast) ... 174
Table 7.10: Difference of the number of new businesses added from 1995 to 2006 as forecast with and without the JLE ... 176
Table 7.11: Annual ranking of London boroughs according to attractiveness as resulted from the simulation with the JLE... 177
Table 7.12: Annual ranking of London boroughs according to attractiveness as resulted from the simulation with the JLE... 177
Table 7.13: Total population in 2006 in aggregate areas (forecast) ... 185
Table 7.14: Difference of population changes from 1995 to 2006, forecast with and without the JLE ... 186
Table 7.15: Annual ranking of London boroughs according to attractiveness as resulted from the simulation with the JLE... 187
Table 7.16: Annual ranking of London boroughs according to attractiveness as resulted from the simulation without the JLE ... 187
Table 7.17: Annual change of dwellings due to JLE ... 191
Table 7.18: Annual change of population due to JLE ... 192
Table 7.19: Total employment in 2006 in aggregate areas (forecast)... 195
Table 8.1: Total number of residential premises in 2016 in aggregate areas ... 204
Table 8.2: Total number of commercial premises in aggregate areas in 2016 ... 205
Table 8.3: Total number of businesses in aggregate areas (forecast) ... 208
Table 8.4: Population in 2016 in aggregate areas ... 213
Table 8.5: Annual ranking of London boroughs according to attractiveness as resulted from the simulation without the ELLX... 216
Table 8.6: Annual ranking of London boroughs according to attractiveness as resulted from the simulation with the ELLX... 216
Table A.1... 239
1 Introduction
This study explores the interactions between transport and urban development focusing on the dynamics of the impact of new metro lines. For this purpose a new model has been developed: the STUDI (Simulation of Transport and Urban Development Interactions) model deals with the interactions in question in the context of urban systems modelling. Urban systems are complex as are the interactions between transport and urban development and they involve dynamic relationships. New transport infrastructure can be the result of increasing demand for transit, but also the main policy-tool for the development of an area; it is expected to attract new development, and development of an area – which can be boosted by relevant policies – is expected to increase the demand for transport. Population is attracted by accessible housing and employment supply in one area increases as businesses move into that area or as accessibility to business areas increases. Businesses make location choices considering several factors, including accessibility to the workforce, other businesses and markets, and availability of premises. Developers, either by forecasting or by responding to the increased floorspace demand, make choices about new developments.
According to this brief description of location-related procedures of urban development, the four key agents (actors) involved in these procedures can be identified: authorities (i.e. government, local authorities, policy makers, transport authorities etc.), developers (i.e. construction companies, real-estate agents), businesses and population. The main concept of the STUDI model is that the procedures of urban development and the impact of new transport infrastructure on urban development are reflected in the interactions between the main agents of urban development. These interactions occur over time and hence they should be modelled in a dynamic framework.
Most models simulating the interrelation of transport and land-use focus on road networks, including public transport as a variable. Additionally, while travel demand models consider the impacts of land-use on transportation systems, most of them lack the ability to reflect the implications of transportation investments on the patterns of land
development, except in a limited way (Zhao and Chung, 2003). In this study, the impacts of new public transportation on land use are modelled explicitly.
The STUDI model has been designed to be comprehensive in order to represent all the main factors of urban development. It simulates the interactions between developers, businesses and population and models the impacts of various factors – including transport – on their location decisions. Authorities are not included because their decision-making processes are affected by unmeasurable and subjective factors; decisions made by authorities (i.e. policies) are imported exogenously in the STUDI model in order to be tested. Location decisions of developers refer to decisions about where to develop new residential or commercial premises. Business location decisions refer to choices about where to locate their establishment. Population location decisions include residential and employment location choices. Location decisions involve behavioural factors and to be modelled realistically such factors should be considered.
A disaggregate model can address the behavioural characteristics of choices in more detail than an aggregate one. Also it can provide more flexibility and better monitoring of location changes, as the origin and destination of an agent who is relocating can be tracked, and it can represent the relationships between the agents of urban development in detail. The current form of the STUDI model is highly disaggregate at agent level, moderately disaggregate at sectoral level and aggregate at spatial level. Spatial aggregation at borough level was chosen for several reasons. One was that various datasets, specifically those on development were available only at borough level. Furthermore, the computational speed of the model was benefited by this decision as having fewer zones improves the running time of the model. In general, a model that runs relatively fast is needed, as speed is a key element of the operationality of the model. The core aim of the STUDI model is the modelling of urban systems in order to understand, simulate and forecast the wider impacts of new public transport infrastructure in large cities, i.e. the impacts on the agents of urban development, on their interactions and on their location choices. The STUDI model has been developed for London and the Jubilee Line Extension (JLE) on London Underground is used to validate it. It is also
applied to forecast the impacts of the opening of the first phase of the East London Line Extension (ELLX). The STUDI model was developed in order to be operational and these two applications are used to test its operational potentials. During its development, the potentials of more applications and wider use were also considered.
In accordance with the conceptual approach described earlier, the STUDI model consists of three sub-models: the development, the business and the population sub-models. The STUDI model runs over time simulating development, business and population processes for a number of simulation periods. The three sub-models are interconnected and exchange information dynamically. The development sub-model uses regression analysis to estimate the number of new commercial and residential premises to be added in each zone in every simulation period. The business sub-model is a microsimulation model, which simulates the decisions of each business separately. It simulates business start-ups and closures and relocation of existing businesses. It is applied to the total business population (individual business records) of London, which has been synthesized by using the Annual Business Inquiry data. The population sub-model is also a microsimulation model, which operates either at individual or at household level. It simulates demographic changes, migration, and employment and residential location decisions. It is applied to the raw LATS (London Area Transport Survey) data of 2001.
According to the discussion so far, the main features that were considered during the development of the STUDI model were:
Dynamic representation Comprehensiveness Choice modelling Disaggregation Operationality Transport representation
Modelling of large cities
Transferability
In Chapter 2, the four agents of urban development are presented and the impacts of new transport infrastructure on each agent are examined. Methodologies and results of several studies that investigate the impacts of major transport investments on urban development are reviewed and the influence of JLE on each agent is discussed.
In Chapter 3, the most important models and methodologies on the interactions between transport and land use are reviewed in order to identify the ones that best comply with the key desired modelling elements. The preferred modelling methodology is chosen and justified.
In Chapter 4, the data used in the STUDI model are described and procedures followed in order to transform the data in the desirable forms are discussed.
In Chapter 5, a new model, the STUDI model, is presented. The various procedures followed in the development, business and population sub-models are described. This includes the commercial and residential development models, the modelling of business start-ups and closures, the simulation of business location and relocation decisions, the simulation of demographic changes, in- and out-migration, and the modelling of employment and residential location decisions. The links between the three sub-models representing the interactions between the agents of urban development over time are also discussed. In this context, reference to assumptions and areas that can be improved is also made.
In Chapter 6, the estimation, calibration and validation procedures of the STUDI model are presented. At first the equations used in the STUDI model are estimated and key indicators are determined. Then the results of the STUDI model are validated and the impacts of stochastic variation are examined. The forecast development, business and population distributions are compared to the real ones for two years, one in the middle of the whole simulation period and one at the end.
In Chapter 7 the STUDI model is applied to estimate the impacts of the JLE on urban development. Results presented include development, business and population distributions with and without the JLE in order to capture the impact of the new line, and relevant differences as forecast by the STUDI model. Moreover, results related to the distributions of employment positions and employed population with and without the JLE are shown.
In Chapter 8 the STUDI model is applied to estimate the impacts of the ELLX which is expected to open in the near future. Future business start-ups and closures and in- and out-migration are forecast based on economic growth. Results presented include distributions of commercial and residential development, businesses and population with and without the ELLX as forecast by the STUDI model.
In Chapter 9, issues raised during the conduct of the study and others that need to be further researched in the future are discussed.
2 Agents of urban development
In order to model the interactions of the main agents of urban development (i.e. authorities, developers, businesses and population), the relationships between them and the impacts of transport infrastructure on their location decisions need to be understood. In this chapter, the agents of urban development are analytically presented and their relationship with transport infrastructure is discussed. Methodologies and results from several studies, which investigate the impacts of major transport investments on urban development, are reviewed. In this context the case of the Jubilee Line Extension on London Underground is also examined.
The JLE (Figure 2.1) opened in 1999 and starts from Westminster; towards the east it runs along the southern part of the Thames until Canada Water, it then crosses three times the river Thames before it turns to the North until Stratford. The JLE includes the following stations: Westminster, Waterloo, Southwark, London Bridge, Bermondsey, Canada Water, Canary Wharf, North Greenwich, Canning Town, West Ham and Stratford. It runs through an area which used to be among the most deprived in UK (mainly the eastern part of JLE), although neighbouring with highly developed areas of London. The JLE has contributed significantly to the improvement of the areas included in its corridor, especially the London Docklands area (i.e. the area around Canary Wharf station) where the most intense development occurred. The history of the development of the JLE is presented in Willis (1997).
New transport infrastructure affects urban functions in various ways. Moon (1990) argued that the primary positive impacts of rapid transit systems on economic development and land use are environmental and federal policies and regulations, demographic changes, changes in city functions and a rising demand for developable property. Two factors that continue influencing the relationship between transit systems, economic development and land use change are traffic congestion and the related commuting habits of individuals. He also argues that economic development is certainly
occurring around the stations. Such impacts will be described through the interactions of the main actors of urban development.
Two general conclusions that came up from many studies on land use impacts of new urban rail transit investments are the following (Cervero and Landis, 1993):
“Urban transportation investments will generate significant land-use impacts only if a region’s economy is growing” and if
“there are complementary development programs in place, such as zoning policies, which support higher densities or more intense land uses.”
2.1 Authorities
Authorities (e.g. municipalities, government etc.) are responsible for the legal environment in which population, developers and organisations function. They make development policies; for example they can make land available for development, they define land use, they can give incentives to attract development etc. Additionally, they make decisions about new transport infrastructure for various reasons including the attraction of development and the fulfilment of the needs of population. On the other hand, development of an area may have adverse impacts on incumbent residents; rapid development of an area can increase land and property values and as a result the incumbent population may be forced out of the area. For example, the development of Canary Wharf attracted thousands of new jobs, but it had little positive impact on the employment of local population, which suffered historically from high unemployment (Transport Studies Group, 2004).
Authorities interact with organisations. They try to attract big multinational companies in order to strengthen the national economy and the international position of the country and to reduce unemployment. The development of Canary Wharf attracted many multinational companies from the financial sector. Some of them might had gone to the City, but others might had chosen other cities within Europe to allocate their headquarters; this was a great benefit for London in both economic and employment terms.
In most cases, authorities expect to have long-term monetary (e.g. from taxes or fare revenue) or political benefits from new transport investments. The decision procedure for a new project involves the interaction of various governmental sectors with local authorities and developers. Authorities can take measures in order to promote development or in support of a new project (e.g. to support a new transit line they can give transit oriented development incentives), which will affect developers’ decisions. Economic growth of an area may increase the demand for transportation systems and new transport infrastructure is expected to attract development, but not without support. In the
following, the role of authorities in the interactions between urban development and transport is discussed in the context of some major urban rail schemes.
In 1979 the first 13 stations of Atlanta’s rail system called MARTA (Metropolitan Atlanta Rapid Transit Authority) opened. An early study of MARTA, called TIMP (Transit Impact Monitoring Program), was based on before-and-after comparisons of station catchment areas. The results showed that the impacts of MARTA on development were far smaller than expected and occurred at only some of the stations. No significant public policies – except rezoning – had been adopted by Atlanta’s authorities to promote development in station areas (Bollinger and Ihlanfeldt, 1997).
The significance of the role of authorities in the wider success of new transport schemes becomes clearer from the comparison of two transport schemes that received different level of support: the SkyTrain in Vancouver (Babalik, 2002) and the South Yorkshire Supertram (Crocker et al, 2000), which opened in 1986 and 1994 respectively. The outcome of this comparison indicated that construction of a new transit system is not enough to attract development to an area and supportive policies are also needed (Babalik, 2002). The two rail systems together with some other rail systems in Europe and America have been analysed in Babalik (2002) from where the following information are extracted. The Vancouver SkyTrain was evaluated as a very successful rail system. It had a positive impact on urban growth; along its corridor significant development occurred, it affected positively the city centre and declining areas and around of some of its stations significant residential development occurred. On the other hand, the South Yorkshire Supertram did not perform very well; neither in patronage levels, nor in attracting development around the corridor. Although it is difficult to establish conclusions about the elements of success by comparing two different schemes, these two cases are probably two extremes in terms of the support they received.
In Vancouver, the municipalities located across the corridor of SkyTrain acted supportively towards the new rail by taking actions such as redevelopment of industrial areas, adaptation of local plans to the transportation system, rezoning of station areas, joint development schemes, relocation of government buildings at the station areas and
provision of development incentives (Transit-oriented development TOD incentives) e.g. development bonuses, tax reductions, reductions in car parking requirements (Babalik, 2002). Additionally, municipalities in Vancouver restricted major commercial development in areas far from the SkyTrain corridor.
In the case of South Yorkshire Supertram, there was poor coordination between the new rail project and the regeneration of the area project; some lines of Supertram were built to serve an area with high-density council flats (Babalik, 2002). However, these blocks of flats were demolished during the construction of the rail system. Furthermore, one route was designed to help in the regeneration of an ex-industrial area but the location of the line did not provide the best service to the new activity centres that were developed in this area. Other characteristics found to act supportively towards the use of new rail system are the following: security on board, parking supply in the station areas, economically strong CBDs (Central Business Districts), high frequency and the fare system.
In many cases authorities, respond to increasing development, which may increase demand for transport and often they work in cooperation with developers in order to promote a general plan of development as happened in Vancouver. Such cooperation is very important in the overall success of an urban rail scheme. Anyway, authorities affect directly location decisions of other agents, through development and transport policies. Many unmeasurable factors are included in these policies making their modelling very complex.
2.2 Developers
The category of developers includes constructors and real estate agents. Developers construct buildings to accommodate firms and residences for the population. Development location decisions are driven by the demands of businesses, and population and by location attributes; Swanson et al (2006) use land availability, property vacancy rates and smoothed historic business growth rates to estimate an attractiveness measure for developers. Developers may act independently, but some times – especially in big schemes – they form corporations. They are attracted by beneficial legislation (e.g.
building density) and supportive policies from the authorities. In the following, the key characteristics of development in the JLE corridor and the impacts of new transport infrastructure on development using the experience from other transit schemes will be discussed.
The most intensive development of the JLE corridor occurred in Canary Wharf. In fact, development started before the construction of JLE. Olympia and York signed a master building agreement with the LDDC (London Docklands Development Corporation) in October 1987 for a 1.1 million sq. meters development at Canary Wharf. The first tenants moved to Canary Wharf in 1991. However, LDDC recognized that the development of the area would not reach its maximum potential without major public transport infrastructure. The second phase of development did not begin until 1997 (Transport Studies Group, 2004). For the rest of the JLE corridor – besides Canary Wharf – the same report concluded that there is little evidence that the JLE has had significant impact on the rate of mixed use development or commercial development. However, the annual rate of residential dwelling construction in the corridor more than doubled from the three year period 1991-1993 to the seven year period 1994-2000. Additionally, the JLE helped to encourage major residential and commercial development in the JLE corridor including 130,000 sq.m of offices at London Bridge, 2000 residential units and commercial development at Canada Water, the additional 1.1 million sq.m of offices and 3,500 residential units at Canary Wharf, the Dome, 339,000 sq.m of offices and 10,000 residential units at North Greenwich and 465,000 sq m of offices, 150,000sq.m of retail space and 4,500 residential units in Stratford (Transport Studies Group, 2004).
A transport scheme that has extensively been examined is BART (Bay Area Rapid Transit) which opened in 1972 in San Francisco. Cervero and Landis (1997) argued that “BART had a modest though not inconsequential influence on land uses and urban development in the Bay Area. It did not create new growth, but rather acted to redistribute growth that would have taken place even without a rail investment”. BART affected land uses only where supportive conditions existed.
Cervero and Landis (1993) used quasi-experimental comparisons to assess the impacts of urban rail transit on local real estate markets; they compared similar cases which differ in one key dimension, i.e. a station area and its control area were chosen and compared. Comparisons were made on the basis of six measures of office market performance: average office rents, net absorption rates, vacancy rates, annual office space additions, average building size and percentage of new regional office floor space. T-statistics were computed based on the mean of paired differences between station areas and control areas for each of the six variables over the study period (matched pairs testing is regarded as less powerful than other comparative techniques such as multiple regression analysis; however, lack of systematic data covering other factors, which can influence office market performance precluded the use of regression analysis). Office buildings at some of the stations areas did command a slight rent premium over their freeway oriented competitors. For most of the real indicators no significant differences between the rail and non-rail areas occurred. In sum, the argument that transit service necessarily generates large capturable benefits for the owners of station area office buildings could not be supported. The authors concluded that transportation and land use changes occur simultaneously reinforcing each other and that transit investments by themselves are not sufficient to induce new growth. Referring to the time when an impact study should be conducted Cervero and Landis (1993) argued that the study of land use impacts is best undertaken a decade or so after a new rail service begins; earlier the market may not have the time to respond to the new infrastructure.
In another study about the development impacts of BART, Cervero and Landis (1995) used hedonic price models in order to isolate the impact of distance from transportation on home prices, and thus to estimate the capitalization effects of proximity of households to BART. GIS was used for sale transactions to allocate housing units to computerized street maps and then to calculate the distance from each housing-unit to BART stations and highway interchanges. The regression results indicated that selling prices increase the closer a house unit is to the nearest BART station and decrease the closer a housing unit is to a highway access point, all else being equal. In terms of office rents the impacts of BART varied from station to station; there were stations the closer to which office rents increased and stations for which rents were higher as distance from the station increased.
BART affected residential densities, office development and the office rents. The impact of BART on office development is remarkable, particularly in downtown San Francisco, where many new offices were built within a quarter mile of BART. However, not all the BART stations attracted the development of new office buildings at the same density. In summary, there are not arguments supporting the hypothesis that new transport infrastructure by itself can attract new development. In many cases it does but in general transport and development changes affect each other.
2.3 Organisations - Businesses
There are public and private organisations. Public organisations can have significant impacts on local development as in many cases they employ large numbers of people. They have different location criteria from private businesses and some times they operate as both authorities and firms in the urban “mechanism”. The focus of the research will be will be on private businesses and firms.
Businesses interact directly with the other actors. They pay taxes to authorities, they operate within the legal framework set by the authorities, they may benefit from or be harmed by policies implemented by authorities and they purchase their establishments from developers. Population supplies organisations with employees and clients. Businesses interact with each other by competing or cooperating. Transport helps the interaction between firms and provides them with labour and customers; thus better transport infrastructure can improve firms’ efficiency and performance and increase labour supply potentials.
Regarding the JLE case, the transformation of an industrial area – such as Canary Wharf – to an office area gave the opportunity to develop a large space in an aesthetically special area. However, to manage the transformation of a deprived area into an economic and employment centre, adequate transport infrastructure was needed. The development of the area of Docklands attracted many multinational companies mainly from the financial sector creating an alternative or an extension of City. This was beneficial not only for the particular area, but for London in general as big companies chose London –
instead of another European city – for the establishment of their headquarters. Although the first part of reconstruction of Canary Wharf was completed in 1992, general recession in the property market, as well as lack of good transportation did not allow the area to increase its development rate until the end of 1990s, when JLE opened (Transport Studies Group, 2004). In this section the interactions of organisations with the other actors of urban development and the impacts of transport infrastructure on businesses’ location choices are discussed.
Businesses make location decisions, considering features such as accessibility, travel time, travel cost, land and property values, building space availability, labour costs, regional taxes etc. McQuaid et al (2004) note that the most important factors influencing business location decisions are (i) availability of suitable premises, (ii) accessibility to the workforce and (iii) accessibility to markets and other businesses. Location decisions depend also on the type and size of the business, e.g. for some businesses regular face-to-face contact is needed and thus transport cost increases; such businesses tend to concentrate in large agglomerations (Glaeser and Kohlhase, 2004). Other businesses require easy access to a main road network. De Bok and Sanders (2005) studied the location choices of firms in the Netherlands and they concluded that bigger office firms providing business services including lawyers, advertising agencies, accountants, economic consultants prefer locations close to highways and smaller firms seem to prefer locations with a railway station nearby; the same holds for the government and public sector (Glaeser and Kohlhase, 2004; Bollinger and Ihlanfeldt, 1997). Glaeser and Kohlhase (2004) observed a difference between big and small businesses, which consist mainly of retail and catering. Bigger firms showed preference in the urban business district or mixed urban locations and near railway stations. Small firms showed preferences in the urban business district and non-urban locations.
Attracting organisations to a newly developed area can mean the creation of new businesses, opening of new branches or complete business relocation. The most important theories explaining the location of business are the neo-classical, the behavioural and the institutional (Brouwer et al, 2002). The neo-classical theory is quite abstract and takes into account transportation and labour costs. The behavioural location
theory assumes that managers may have multiple goals and seek to maximize their own utility. The institutional location theory considers firm’s negotiations with suppliers, governments, labour unions and other institutions about prices, wages, taxes, subsidies, infrastructure and other factors in the production process. Other theoretical approaches on the location of business include economic base models that deal mainly with industries that export from a region, core-periphery models focusing on the relationship between core and peripheral regions, location theories taking into account regional features, agglomeration economies and other factors, industrial district models focusing on characteristics contributing to a successful regional economy, cumulative causation theory, the competitive advantage theory of Porter (1990) and innovative milieu models (McQuaid et al, 2004). In any case, transport infrastructure is expected to affect the location choice of firms either directly as so it can increase labour supply pool, and improve accessibility to customers, suppliers and other businesses, or indirectly by affecting other factors important for the location decisions of firms such as land values. Generally, the impact of public transport on the development of an area varies from case to case. New transport infrastructure can assist firms to relax location constraints allowing them to select from a wider range of locations and relocation of a firm can bring economic benefits if it helps the firm to improve productivity and operational efficiency (Holl, 2006). Furthermore, transport infrastructure improvement can affect organisations by affecting agglomeration economies. Transport improves interactions of economic agents, by reducing travel time and cost. However, Haughwout (1999) argued that in US transport investment may have opposite effects on agglomeration economies by moving growth from areas having already dense employment to more undeveloped areas.
The influence of transport on firm location decisions is difficult to estimate. De Bok and Bliemer (2005) proposed a microsimulation modelling approach for the simulation of the interactions between transport infrastructure and firm location choices. Such a methodology increases heterogeneity in responses, it allows the use of accessibility measures as explanatory variables for events such as firm relocation, performance and dissolution and lastly it helps understanding of the path dependency between events, e.g. the relationship between new transport infrastructure, firm growth and firm relocation.
In an application of MEPLAN model in Sacramento, Abraham and Hunt (1999) evaluated various scenarios of major transport investments. They predicted that construction of rail in combination with some roadway projects and measures – to make the use of private vehicles unattractive to the population – would have forced businesses in the area of stations to move in order to avoid parking surcharge. On the other hand, the area gained residents, since absence of commercial activities made the area more attractive (and affordable) to residential activities. In the case of a more dramatic scenario including land use policy changes, land subsidies, investment in transit and higher transit frequencies, it was predicted that the land subsidies would have attracted development in large. Different kinds of activities bidding against each other will raise rents and attract developers.
In this section various issues related to business location decisions were discussed and important factors to be considered in the business modelling procedures were identified, such as the importance of the availability of suitable premises and the accessibility to workforce on the attractiveness of a location for businesses.
2.4 Population
The location choices of businesses are expected to affect population location choices. As mentioned above, people can be related to companies either as customers or as employees. Employment choices of people may affect residential choices through transportation supply. People are interacting directly with the rest of the actors. They vote for the election of the authorities and they pay taxes to authorities. On the other hand, authorities support development and they try to increase employment and to improve infrastructure. Developers construct and supply residential premises. People work in organisations. People are interacting with each other: in the property market they compete in order to buy residences and in the employment market they compete in order to get a job. Moreover, people with common characteristics (e.g. income) tend to concentrate in the same neighbourhoods. The impacts of new transport investment on residential infrastructure and house prices are discussed in the first part of this section and the impacts of transport on employment in the second.
2.4.1 Residence
New transport infrastructure can increase house prices in the areas close to the stations due to improved accessibility. However, increased noise and traffic might have adverse effects on the prices of properties, which are very close to the stations. Bowes and Ihlanfeldt (2001) estimated the impacts of rail transit stations on residential property values for the case of MARTA and they concluded that: “Properties within a quarter of a mile from a rail station are found to sell for 19% less than properties beyond three miles from a station. However, properties that are between one and three miles from a station have a significantly higher value compared to those farther away. These results suggest that houses that are very close to stations are affected by negative externalities, but those at an intermediate distance are beyond the externality effects and benefit from the transportation access provided by the stations”.
It is important to see when impacts on house prices start to occur in the areas where a new transit line is being built, since in some cases the benefits of the new transit line begin to be capitalized into house prices before the opening of the new line. McMillen and Mcdonald (2004) estimated the reaction of house prices to Chicago’s Midway Line – which opened in 1993 – and they found that the impacts of the new transit line on house prices began 6 years before the construction was completed (McMillen and Mcdonald 2004; McDonald and McMillen, 2000). The house price gradient with respect to distance from the nearest station rose from 4.2% before 1987 to 19.4% during 1991-1996. In an earlier study about the Chicago’s Midway Line, McDonald and Osuji (1995) estimated the impact of the new line by using a generalized before-after method and they concluded: “Residential land values within one-half mile of the station sites were 17% higher than they otherwise would have been because of the future improvement in transportation service, and proximity to the right-of-way was regarded as a negative external effect”.
The impact on house prices is certainly important because it reflects the demand for houses and hence attraction of population, but the impacts of new transport infrastructure on population can be seen directly by examining changes in population size and
composition. To capture the impacts of MARTA on population and employment Bollinger and Ihlanfeldt (1997) compared station and non-station tracts and they concluded that MARTA had little effect on total population and employment in station areas but it had some effect on industry and population mix in these areas. In San Francisco Cervero and Landis (1995) estimated that residential population grew 20% faster in corridors not served by BART than in those served by BART.
The JLE appears to have affected the residential market in the JLE corridor (Transport Studies Group, 2004). Considerable residential development occurred in the Isle of Dogs by 2000 and the available land for new residential development has decreased significantly since then. Residential sales in Canary Wharf increased by 17.5% during the period 2000-2001, while for the same period residential sales in the prime Central London area as a whole increased by 12.7%. The catchment areas of Waterloo and London Bridge stations changed significantly after the JLE opened. They used to have limited commercial activity and residential development and now they have become important commercial and residential areas (Transport Studies Group, 2004). Moreover, the residential property market around the station of the JLE at Stratford has changed considerably.
Agents specialised in the area of JLE corridor suggested that residential property prices have risen very fast in the corridor, especially to the south of the river. The new residents moved to the area have definitely changed the previous population composition.
2.4.2 Employment
The opening of the JLE appeared to have been beneficial also for employment growth. In the JLE Summary Report (Transport Studies Group, 2004) employment growth was estimated using reference areas. Employment in the JLE corridor grew faster than in any of the reference areas. The total increase was estimated to be 52,000 representing the 53% of all employment growth in the Inner East London Area (IELA). A forecasting exercise indicated that the JLE under-performed in employment terms during the pre-opening period but over-performed during the post-pre-opening period. Most of the growth
happened to the east of London Bridge. The impacts of new transit lines on employment are examined below.
Cervero and Landis (1997) conducted a study about the land use and development impacts of BART. They used matched pairs analysis (i.e. comparison between station and non-station areas, which lie within a distance of 1 to 2.5 miles and connect with the same arterial). A logit model was used to predict the likelihood of land use conversion. The two primary data inputs used, were digital data of dominant land uses for hectare grid cells in 1990 and estimates of dominant land uses near BART stations in 1965 made from aerial photographs. The binomial logit model predicted the probability of each hectare grid-cell changing land-use from 1965 to 1990 as a function of distance to the nearest BART station. The rate of building construction during the post BART era was estimated using regression models. The models predicted growth rates in residential and non-residential floorspace as functions of parking supply, proximity to freeways, land use mixture, vacant land and how close a station is to the end of a line. Measuring employment growth for the period 1970-1990 in three counties, they estimated that employment grew 84.5% in the districts not served by BART compared to 38.9% growth in the districts served by BART. The largest difference between non-BART and BART areas occurred in the county of Alameda. They argued that the results mirror the trend of job decentralization that happened throughout the US. They also concluded that businesses near BART had high shares of executive, professional and technical workers and businesses benefiting from face-to-face contact and access to specialized labour that had been attracted to BART stations. Finally, the authors argued that to the degree that maintaining a dominant, primary commercial and employment centre has increased economic productivity in the region, BART has probably produced real, though immeasurable, economic benefits. The authors divided time in three periods: the pre-BART the early-pre-BART and the recent-pre-BART periods. Commercial and office development grew faster during the pre- and recent- BART periods.
Metro (Washington Metropolitan Area Transit) opened in 1976. A study comparing employment changes between station and non-station areas, showed significant differences in favour of station areas. It was estimated that station zones had 2.5 times
more jobs and 2.5 times greater employment growth compared with non-station zones (Green and James, 1993). On the other hand, the opening of MARTA in Atlanta did not cause significant changes in total employment, but the composition of employment changed in favour of the public sector around the stations with higher levels of commercial activity (Bollinger and Ihnlanfeldt, 1997).
In summary, new transport infrastructure increases house prices and affects employment and population composition. The results about the impacts on size of population and employment vary from case to case: there are certainly strong regional effects and other factors such as authorities’ decisions – as discussed in Section 2.1 – can cause an important variation in the impacts of new transport investments on population. Regarding the JLE case it seems that there were positive impacts on both size of population and employment.
2.5 Summary of impacts of new transport investments on urban
development
Above, the impacts of new transport infrastructure on each category of agents and thus on urban development have been presented for various cases. Keeping in mind that every transport scheme is unique, the experience from other transport schemes reviewed above can help to underline some elements of success of a new project, as well as key characteristics of the impacts of transport investments on the actors of urban development. Key findings from the literature are:
Transportation and land use changes occur simultaneously reinforcing each other. Transit investments by themselves are not sufficient to induce new growth.
Integrated planning and supportive policies can provide significant assistance to the success of a project and to the promotion of urban development.
Transport infrastructure may affect business location decisions directly (e.g. by improving accessibility) or indirectly (e.g. by affecting other factors such as land
values). It can influence location decisions in various ways depending on size and type of business.
The impacts of new transport infrastructure on employment vary from case to case. However, it appears that new transportation is affecting employment composition.
New transportation can have positive impacts on residential dwelling prices.
Most studies show that new transport infrastructure affects population composition.
2.6 Interactions between the agents of urban development
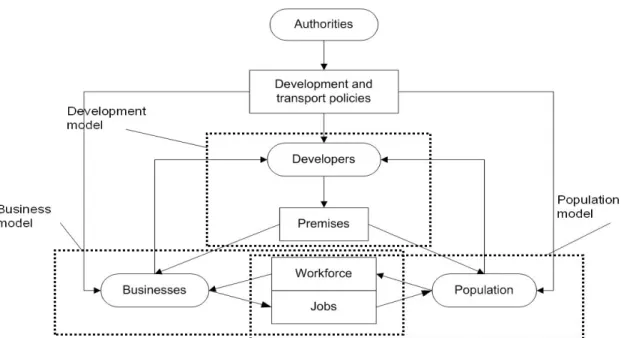
Various ways through which the main agents of urban development are interacting have been discussed in this section. These interactions can be expressed through flows of money, trips and information as shown in Table 2.1. However, not all of them can be modelled. For example authorities’ decision-making processes are very complex and include immeasurable factors. In Figure 2.2, the procedures as they will be modelled are outlined abstractly. Developers Businesses Population Development policies Authorities Transport policies Developed land
Figure 2.2: Procedures of urban development
Authorities affect the other agents’ location decisions through development and transport policies. Developers make location decisions about developing premises taking into account the availability of developable land (affected by development policies) and demand for premises by businesses and population. Business and population location decisions are affected by the supply of premises.
to
Authorities Developers Organisations Population
Authorities
Different public or governmental sectors interact in order to decide and to realize a new project (money flow, information flow).
Authorities assign projects to developers (money flow). They are responsible for legislation and they can give development incentives to developers (information flow).
Authorities can give incentives to attract organisations and are responsible for legislation (information flow).
Authorities correspond to people's needs for better transport infrastructure, employment and residence and are responsible for legislation (information flow).
Developers
Developers try to achieve better deals, beneficial legislation and supportive policies for their projects. They pay taxes (money flow).
Developers construct infrastructure. They form corporations or compete in order to take the project (money flow, information flow).
Developers construct the buildings to accommodate firms.
Developers construct residences, working places and transport infrastructure to cover people's needs.
Organisations
Big companies are attracted by incentives given by authorities (e.g. tax incentives). They pay taxes (money flow).
Organisations are attracted by major development. They buy their establishments from developers (money flow).
Organisations compete and concentrate in agglomerations in order to improve efficiency and exchange ability (money flow, information flow).
Organisations employ people (money flow), and have clients in the population.
Population People vote to elect authorities. They pay taxes (money flow).
People purchase their residences from developers (money flow).
People are employed by organisations and can be customers of firms (money flow). They travel to
organisations as employees and as customers (trips flow).
Residents compete in the house market and employees in the job market. Employment location and residential location decisions interact (money flow, information flow).
3 Review of land use – transport models
There is an interrelation between transport and land use and dynamic cyclical interactions between the two. Various models simulating these interactions have been developed over the years based on different concepts, approaches, methodologies and theories.
Lee (1973) in his Requiem for Large-Scale Models pointed out “the fundamental flaws in attempts to construct and use large models”. Some of the issues he pointed out remain valid, but others, mostly related to technology limitations that existed in the period when Lee wrote his critique, have disappeared according to a series of papers that were published in order to continue the discussion opened by Lee (Batty, 1994; Klosterman 1994; Wegener, 1994). These papers provide also a good and brief review of existing models. Regarding the desirable modelling features, Lee (1994) identified three key features necessary to make large-scale urban models scientific: transparency, replicability and pragmatic evolution and Wegener (1994) noticed the importance of comprehensivess and operationality of urban models.
Representative models of the main modelling approaches that have been used for the development of land use – transport models are reviewed in this chapter. The different modelling approaches will be evaluated according to their compliance with the following desirable elements of the model to simulate the interactions between transport and urban development for the case of JLE as identified in the Introduction:
Dynamic: The interactions between transport and land use should be modeled over time.
Behaviour and choice modelling: The choices of individuals and companies should be modelled and the behavioural attributes of these choices should be evaluated.
Disaggregate: Location decisions of the agents of urban development should be modelled at individual level.
Comprehensiveness. The essential processes of urban development must be integrated.
Application oriented: An operational tool for real-world planning is needed.
Transport representation: A model to represent the impacts of transport policies is needed.
The characteristics of transferability and ‘ability to model large cities’, which were also mentioned in the Introduction, although valued equivalently, are not included in the characteristics to be used in the evaluation of the modelling approaches because they depend on each model separately rather than on the modelling approach itself. The models are categorised according to Mackett (1985, 2006). The two main subcategories are the optimising and the forecasting models.
3.1 Optimising models (mathematical programming models)
These models produce an optimal allocation of a quantity, which is incorporated into an objective function, subject to a set of constraints. The latter make sure that the allocations are not negative, the supply side constraints are not violated and all the quantity being optimised is allocated.
Some examples of optimal allocation of quantities are the minimisation of cost of travel, maximisation of population income (or organisation’s profitability), maximisation of company’s, household’s, individual’s rent paying ability, minimisation of cost of development and minimisation of environmental impacts.
In the Herbert-Stevens model (Herbert and Stevens, 1960) the objective maximised is the aggregate rent-paying ability subject to the constraints that all households are allocated and the amount of land used does not exceed the amount of land available for residential use.
TOPAZ (Technique for Optimal Placement of Activities in Zones) was developed in Australia by Brotchie et al (1980). The model minimises the total cost of premises and travel, subject to the constraints that all activities are located and all zones are filled. POLIS (Projective Optimization Land Use System) was developed initially at 1969 for the city of Cologne and is described in Prastacos (1985). The objective function to be optimised is derived from random utility theory and describes the choices of individuals that maximise their utility.
Optimising models are generally not used directly for the valuation of the impacts of transport and land use policies on urban development (Hunt et al, 2005). They are more suitable to explore alternative land uses than to capture behavioural responses to transportation and land use policies (Waddell and Ulfarsson, 2004). Hence they are not considered suitable for the purpose of this project.
3.2 Forecasting models
Forecasting models are divided in two categories according to the level of aggregation of the agents modelled. Aggregate models consider groups of agents, e.g. groups of households categorised according to household characteristics. Disaggregate models consider agents separately, e.g. in the case of population individuals or households.
3.2.1 Aggregate forecasting models
3.2.1.1 Regression Models
Regression models consist of a relationship between the dependent variable and several independent variables. The general form is:
y = α + Σkβkxk
The coefficients are estimated using appropriate statistical methods. The impact of transport on land use can be modelled by making population or housing the dependent variable and by including transport (or transport cost) in the independent variables. Thus, the coefficient of transport variable will be an estimator of the impact of transport on the
dependent variable. The time factor can be included in the model by lagging the variables over time. Such a model is EMPIRIC (Hill et al, 1965). Regression models are aggregate and they do not model transport and land use explicitly.
3.2.1.2 Spatial Interaction Models
In spatial interaction (gravity) models the study area is divided in several locations (zones) and the trips between each pair of zones are modelled. The spatial interactions are assumed to be proportional to the activity level of each location and inversely proportional to the transport impedance between zones. For this reason these models are also called gravity models.
The first model of this kind was the model developed by I.S. Lowry (Lowry, 1964). It combined the economic base multiplier model and the gravity model. The Lowry model divides employment in basic and non-basic employment. The place of basic employment determines the place of residence; residents demand services, which determine the place of non-basic employment; workers in non-basic employment are also allocated in the area according to another gravity model and their demands create additional non-basic employment.
ITLUP (Integrated Land Use Transportation Package) was developed by Putman initially in the early 1970’s (Putman, 1983). It has been calibrated for several metropolitan regions in US and it is still used by many of them. It contains DRAM (Disaggregate Residential Allocation Model) and EMPAL (Employment Allocation Model). DRAM forecasts the number of households by household categories defined by income. EMPAL forecasts employment size by employment sectors.
LILT (Leeds Integrated Land use Transport) was developed by Mackett (1983a). It links the Lowry type model with a four-stage aggregate transport model and with a car ownership model to describe the relation between transport supply and the spatial distribution of households, employment, shopping and land utilization (Wegener et al, 1991). Taking into account the existing land use pattern, travel cost and constraints on land use, it allocates population, new housing and jobs. It was developed for Leeds and has been applied to Dortmund and Tokyo (Mackett 1990a, 1991a, 1991b). It has also
been applied to forecast the impacts of the then still proposed Crossrail link (Mackett, 1994).
Some limitations of these models include the non-representation of behavioural factors influencing location choices, the fact that real estate markets and prices are not considered and the lack of detailed spatial representation (Zhao and Chung, 2006). Furthermore, they are not dynamic. As two of the key elements of the model to be applied in London are to model the behaviour of the agents of urban development and to consider the dynamics of their interactions, spatial interaction models are considered in general to be unsuitable.
3.2.1.3 Spatial Input – Output Models
Spatial input-output models are based on the framework of economic input-output models. They convert economic flows by economic sectors to travel demand. Different economic sectors and the spatial patterns of their interactions within regions, as well as the movement of goods and people between zones are described. Real estate and labour markets are considered.
MEPLAN was developed by Echenique (1984). It is based on microeconomic theory and on welfare economics providing detailed economic evaluations of the predictions (Wegener et al, 1991). In the following the procedures of the model according to Echenique et al (1990) are described. The land use model consists of factors such as the location of economic activities in terms of households and employment, and the location of properties in terms of housing units or floorspace. The output of one factor is related to the inputs of other factors. Each factor has a spatial definition. For transportable factors, such as labour, the inputs can be purchased from any relevant zones. For not transportable factors, such as land and properties, the demand must be satisfied within the same place. The model iterates, generating demands of inputs to produce outputs, until the system reaches an equilibrium. Additionally, it estimates the location from which the factor obtains its inputs, considering va