A Positive Feedback Between Sediment Deposition
and Tidal Prism May Affect the Morphodynamic
Evolution of Tidal Deltas
Xiaohe Zhang1 , Sergio Fagherazzi1 , Nicoletta Leonardi2 , and Jiufa Li3 1
Department of Earth and Environment, Boston University, Boston, MA, USA,2Department of Geography and Planning, University of Liverpool, Liverpool, UK,3State Key Laboratory of Estuarine and Coastal Research, East China Normal
University, Shanghai, China
Abstract
Tidal deltas are fragile systems whose morphology can be easily impacted by variations in water and sedimentfluxes caused by natural and human processes. Here we explore the relation between tidal prism and sediment dynamics in tidal deltas using the recent evolution of the Yangtze River estuary, China, as an example. Using the numerical model Delft3D, we examine how changes in delta morphology can trigger variations in tidal signal, suspended and bed load transport, and how these could ultimately cause additional morphological changes. Our results show that a positive feedback between sediment deposition and tidal prism dominates the morphodynamic evolution of the delta. Accretion of the shoals in the delta front increases the dissipation of tides and decreases the tidal prism leading to weaker tidalflows. This reduction in tidal currents lowers the sedimentflushing capacity of the system, promoting deposition on the shoals and tidal dissipation. This positive feedback potentially traps more sediment in the delta topset and possibly offsets the decrease in sediment load triggered by the construction of upstream dams, often present in tidal deltas.1. Introduction
River deltas host productive ecosystems, critical infrastructures, and a considerable fraction of the human population. Many of these deltas are threatened by sea level rise and by the reduction in sediment supply caused by dams (Syvitski et al., 2009). It is therefore imperative to understand the hydrodynamics and sedi-ment transport of these large-scale systems. The interplay betweenfluvial and marine processes determines the hydrodynamics and morphology of tide-dominated deltas (Dalrymple & Choi, 2007; Fagherazzi et al., 2015; Leonardi et al., 2013, 2015). In a seminal paper, Hoitink et al. (2017) postulates that tidal deltas are inherently more stable thanfluvial- and wave-dominated ones, because the tidal motion acts to stabilize delta morphology as long as sediment import during low flows is of the same order of magnitude as sediment export during high flows. However, positive feedbacks between morphology and sediment transport can emerge, driving tidal deltas toward new configurations in a very short timeframe. These feedbacks can be caused by nonlinear interactions between hydrodynamics and bathymetry along tide-dominated estuaries.
Among others, Dalrymple and Choi (2007) illustrated the general distributions of estuarine deposits, sediment transport, and wave and tidal energy for simplified tide-dominated configurations. In their concep-tual model, the delta is river dominated in the upstream reaches, while it becomes tide dominated near the distributary mouths because of the increase in tidal prism. While river discharge depends on rainfall on the river watershed, tidal prism is a function of delta morphology. A change in delta geometry driven by sedi-ment erosion or deposition can therefore affect the tidal prism, which in turn can alter sedisedi-ment transport. Nonlinear feedbacks can thus take place between delta morphology, tidal prism, and sediment transport that can ultimately determine the morphodynamic trajectory of the system.
For the Fly River Delta, Papua New Guinea, it was suggested that an increase in tidal prism driven by sea level rise would promote both delta islands retreat and bottom erosion (Canestrelli et al., 2010). Canestrelli et al. (2010) showed that sedimentation in the Fly River delta could reduce water depths, increase friction, and modify the propagation of the tidal wave in the delta, thus affecting the tidal prism. A dynamic link between tidal prism and delta morphology is also present in the Kikori delta, Papua New Guinea, with delta distribu-taries partitioning the tidal prism across the entire delta through avulsion and channel abandonment
RESEARCH ARTICLE
10.1029/2018JF004639
Key Points:
• Reduced tidal prism diminishes tidal discharges and peak velocities, preventing sedimentflushing and favoring sediment trapping
• Positive feedback has mitigated the drastic reduction in sediment load triggered in the last decade by the construction of the TGD
• Positive feedback between deposition and tidal prism highlights the importance of the shoals for the stability of the entire delta
Correspondence to:
S. Fagherazzi, [email protected]
Citation:
Zhang, X., Fagherazzi, S., Leonardi, N., & Li, J. (2018). A positive feedback between sediment deposition and tidal prism may affect the morphodynamic evolution of tidal deltas.Journal of Geophysical Research: Earth Surface,123. https://doi.org/10.1029/2018JF004639 Received 6 FEB 2018
Accepted 3 OCT 2018
Accepted article online 11 OCT 2018
©2018. American Geophysical Union. All Rights Reserved.
(Fagherazzi, 2008). The relationship between tidal prism and delta morphology also controls the deposition of sediments within the delta. Yu et al. (2012) stressed the importance of estuarine geometry, and particularly its width convergence rate, in shaping the sand shoals of the Qiantangjiang Estuary in China.
Here we use the Yangtze River estuary (YRE) in China as an example to test whether there is a relation between tidal prism, sediment transport, and delta morphology. Specifically, we will determine the main driving factors that control the morphodynamic evolution of the delta and illustrate the interactions of these factors based on an analysis of tides, sediment transport, and delta morphology. For this purpose, we will apply a depth-averaged numerical model based on two bathymetric surveys. We will focus on the hydrody-namic characteristics of tidal shear stress, residualflows, tidal asymmetry, cohesive and noncohesive sedi-ment remobilizations,and initial erosion and deposition patterns to illustrate the emergence of a positive feedback mechanism that could control the long-term evolution of the system.
In order to forecast erosion and deposition patterns at the decadal timescale, several process-based numer-ical models have been used in the recent past (Hu et al., 2009; Kuang et al., 2013; Luan et al., 2017). However, few of these models have explored the emergence of nonlinear feedbacks that can drive the entire system toward new morphological configurations. This is particularly true for the YRE, where the long-term reduction of sediment load caused by the Three Gorges Dam (TGD) could destabilize the system, leading to unpredict-able outcomes. Understanding the nonlinear interactions and feedbacks between different processes could become critical for future restoration and mitigation projects.
2. Case Study
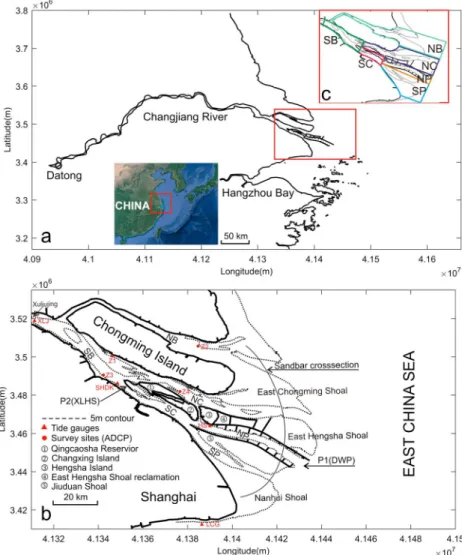
The Yangtze River is the third longest river in the world after the Amazon and the Nile: it is approximately 6,300 km long, and its watershed covers nearly 20% of mainland China. The river originates in the Tibet Plateau, flows eastward across 11 provinces, and debouches into the East China Sea through a three-bifurcation and four-outlet estuary. The channel width stretches from 5.7 km near Xuliujing (XLJ) to 90 km at the mouth located 180 km downstream (Figure 1b). Theflow along the river is divided by Chongming Island into the South Branch (SB) and the North Branch (NB) and is then further divided into the South Channel (SC) and the North Channel (NC) by Changxing Island. Finally, theflow in the SC splits into the South Passage (SP) and the North Passage (NP), forming four outlets (Figure 1b). From south to north, the Nanhui Shoal, Jiuduan Shoal, East Hengsha Shoal, and East Chongming Shoal are separating the river mouths. Tides are semidiurnal with an average range of 2.67 m. The tidal range increases from the delta front toward the estuary, reaching a maximum value near the mouth shoals (Dajishan Tide Station) before decreasing landward (Guo et al., 2015; Li et al., 2012). The significant wave height is about 0.9 m, but peak values can reach 6.2 m during tropical cyclones (Hori et al., 2002). Sea level rise exposes the Shanghai coast to increasing risks offlood associated with storm surges, with annual maximum subsidence rates reaching 24 mm/year (Wang et al., 2012). The tidal limit of the YRE is near Datong Hydrological Station (Figure 1a), located 640 km upstream from the mouths (Yang et al., 2003). Increasingly intensive human activities have occurred within the YRE since 1997, with the rapid development of the Yangtze delta economic zone. For instance, to guarantee a stable channel for navigation, the Deep Waterway Project (DWP) was constructed between 1997 and 2010, with training walls and yearly dredging activities aimed at mitigating siltation (Figure 1b). Within the NP, the DWP features two dikes along the channel and 19 T-shaped groins concentrating theflow. Other interventions include the Qingcaosha Reservoir carried out at the bifurcation of the lower SB from 2006 to 2009; the Xinliuhe Shoal Protection Project also includes dikes built to stabilize the dynamic shoals at this bifurcation. Land reclamation projects in East Hengsha Shoal, Nanhui Shoal, and the NB area were car-ried out to reduce the intertidal area (Dai et al., 2016).
According to the Changjiang (Yangtze) Sediment Bulletin, the mean annual river discharge at Datong Station is 8.94 × 10¹¹m3, with a peakflood in 1998 (12.44 × 10¹¹m3), while extremely lowflow conditions occurred in 2006 (6.89 × 10¹¹m3). The annual sediment discharge experienced a drastic decline after the construction of the TGD in 2003, being less than 100 Mt in 2006 and 2011, compared to an average of 423 Mt before 2003. Based on multiplefield surveys of suspended sediment concentration (SSC) conducted in the last 30 years, the SSC increases proceeding landward, reaches a maximum at the mouth shoal area, and decreases after-ward. With the sharp reduction in sediment fluxes after 2003, the SSC has drastically decreased both
upstream (from 0.5 to 0.2 kg/m3) and in the offshore area (from 0.75 to 0.25 kg/m3) but has remained rela-tively high in the mouth channels (Zhang et al., 2015).
Possibly, because of variations in sediment load, the YRE experienced little erosion in the SB and offshore area, and shoal progradation at the mouths has been much slower (Zhao et al., 2018). Yang et al. (2011) concluded that erosion in the Yangtze delta primarily occurred between the 5 and 8 m isobaths in the delta topset and that an annual sediment load of 270 Mt is the threshold limit controlling the transition from deposition to overall erosion.
3. Model Description
3.1. Model Domain and Boundary Conditions
Herein, the hydrodynamics and sediment transport of the YRE under realistic tidal forcing were simulated using the numerical model Delft3D. The model domain extends from Datong Station upstream to the 100 m isobaths offshore into the East China Sea and covers the Hangzhou Bay from 29.5 to 33 N (Figure 1a). Bathymetry data with a scale of 1:10,000 of 1997 and 2010 are used in this study. The data were collected from the Changjiang Estuary Waterway Administration Bureau with dual-frequency echo sounders (see Dai et al., 2013).
Figure 1.Model domain (a), planar view of the study area within the YRE (b), and repartition of the domain among different deltaic distributaries (c) (SB, NB, SC, NC, SP, and NP represent South Branch, North Branch, South Channel, North Channel, South Passage, and North Passage, respectively). P1 (DWP) and P2 (XLHS) represent Deep Waterway Project and Xinliuhe Shoal Protection Project, respectively.
The model domain in Figure 1a has 402 × 684 grid points with an average cell resolution of 500 m. The data analysis primarily focused on the delta area from Xuliujing to the 30 m isobaths as shown in Figure 1b. For bed roughness, the manning coefficient was set equal to 0.01, and the model was calibrated using water level and velocity data (Kuang et al., 2013; Lu et al., 2015). The two dikes and 19 groins of the DWP were repre-sented through the Current Deflection Wall functionality within Delft3D. The top of the Current Deflection Wall was set to be 0.34 m above mean sea level to allow overflow during high tides. Dry points were used to describe reclaimed areas and reservoirs.
Daily river discharge measurements and sediment concentrations from the Datong station were prescribed at the landward riverine boundary. At the seaward boundary, we prescribed a combination of 13 tidal con-stituents, extracted from the global tide model TPXO 7.2 with 1/4 degree of resolution (Egbert et al., 1994; Egbert & Erofeeva, 2002). The seaward boundary covers 3.5 degree in latitude, and different tide parameters were prescribed every degree to enhance model accuracy. The model was calibrated for the period from 15 September 2002 to 15 October 2002, considering hourly current velocity measurements from acoustic Doppler current profiler surveys conducted at locations Z1, Z2, Z3, and Z4 (Figure 1b, red points) and water levels from gauge data. For the sake of simplicity, given the extension of the domain, we did not account for density drivenflow and stratification. A similar purely barotropic approach was also adopted by Canestrelli et al. (2010), Sassi et al. (2012), Guo et al. (2014), and Zhang et al. (2017) to study tidal delta hydrodynamics. Note that the system is well mixed upstream of Changxing Island (Yun, 2004) and that salt water intrusion mainly impacts the NB (Xue et al., 2009), while most of the sediment transport occurs within the SB (Dai et al., 2016). However, baroclinic effects can affect bottom shear stresses in the shoal area, which is also the turbidity maximum zone of the estuary.
3.2. Sediment Transport
In the model, the distribution of bottom sediments was defined using 710 sediment samples collected across the entire YRE by the State Key Laboratory of Estuarine and Coastal Research, East China Normal University in 2015 (Figure 2). Generally,finer sediments are present in the eastern and southern parts of the YRE. The aver-age mean grain sizes (D50) for the different deltaic domains (see Figure 1c) are 76μm for the SB, 59μm for the NB, 71μm for the SC, 63μm for the NC, 41μm SP, 36μm for the NP, and 28μm for the offshore area. Because of the complexity and high spatial variability of the bed composition, the implementation in the model of the real grain size distribution would be difficult and computationally expensive. For this reason, only two bed fractions, representative of the range of sediments present in the YRE, were prescribed in the model. Specifically, we used a noncohesive sand fraction (sand) with D50 = 125μm and a cohesive sediment fraction (mud) with D50 = 20μm and a settling velocity of 0.2 mm/s. Two different critical shear stresses for erosion,τcr=0.05 Pa
andτcr=0.5 Pa, were used to account for the variety of states (consolidation, water content, etc.) in which muddy
sediments could be present in the estuary. The relative fraction of mud to sand at each location within the delta was qualitatively derived from the real distribution of grain size (Figures 2a and 2b). This was achieved by deter-mining in each point the ratio between sand (125μm) and mud (20μm) that matched the measured mean grain size (Figure 2a). The resulting maps of sand and mud fractions are similar to those reported in Luan et al. (2017). The exchange of sediments between the bed and the water column was modeled following the Partheniades and Krone formulation (Partheniades, 1965) in the case of cohesive sediments and the van Rijn (1993) formu-lation in the case of noncohesive sediments. The transport formuformu-lation of noncohesive sediments includes both bed load and suspended load, while for cohesive sediments, only suspended load is present.
3.3. Model Calibration
We compared model results of water level and velocity to field data from four tide gauges in the YRE (Hengsha, Luchao Gang, XLJ, and Shidongkou) and acoustic Doppler current profiler data collected for the period from 15 September 2002 to 15 October 2002 (Z1, Z2, Z3, and Z4 in Figure 1b). The water level data from the tide gauges were recorded hourly for 30 consecutive days, while the hourly velocity data were measured during spring tide (from 10:00 on 22 September to 13:00 on 23 September), neap tide (from 14:00 on 29 September to 17:30 on 30 September), and between spring and neap tides (from 00:00 on 27 September to 04:00 on 28 September).
Following Allen et al. (2007), two parameters are used to evaluate the synthetic performance of the model (Figure 3): the model efficiency,ME,
ME¼1∑ðDMÞ
2
∑DD2 (1)
and the root mean squared error,RMSE,
RMSE¼ ffiffiffiffiffiffiffiffiffiffiffiffiffiffiffiffiffiffiffiffiffiffi ∑ðDMÞ2 n s (2) whereMindicates the model result (water level or tidal velocity),Dindicates the observation data,Dis the mean of the observation data, andnis the total number of observations. The value ofMErepresents the model performance, which is classified as follows: ME > 0.65 excellent; 0.5 < ME < 0.65 very good; 0.2<ME<0.5 good;ME<0.2 poor (Allen et al., 2007). TheMEfor water levels at the four tide gauges ranges
Figure 2.(a) Mean Grain size distribution of the Yangtze River estuary interpolated from bottom sediment samples. The dash box indicates the location of the upper Yangtze River estuary; (b) bimodal sediment distribution (mud and sand) used in our simulations and inspired by the real distribution reported in (a).
Figure 3.Calibration of water level (a) at four tide gauges and water velocity (b) at fourfield sites (Figure 1b) from 15 September 2002 to 15 October 2002. HS = Hengsha, LCG = Luchao Gang, XLJ = Xuliujing, SHDK = Shidongkou.
from 0.83 to 0.92 with theRMSEbetween 16 and 27 cm. For the depth-averaged water velocity, theMEranges from 0.71 to 0.88 with aRMSEbetween 0.15 and 0.22 m/s.
4. Results
4.1. Morphological Changes Between 1997 and 2010
Engineering interventions such as the DWP, Xinliuhe Shoal Protection Project, Qingcaosha Reservoir, and land reclamations changed the local morphology of the system, as can be seen by comparing bathymetry data from 1997 and 2010 (Figure 4). From 1997 to 2010, strong erosion occurred within the DWP channel while deposition took place within the groins area (Figure 4c). The offshore area between the 5 and 15 m iso-baths displays moderate erosion possibly induced by the sediment load reduction after the construction of the TGD (Zhang et al., 2015). In Figure 4d, we report the hypsometric curves for 1997 and 2010. The estuarine area with depths between 20 and 5 m has experienced a strong reduction, while the area with depths between 5 and 0 m has increased (Figure 4d). The YRE is therefore overall silting for depths below 5 m. 4.2. Trapping and Remobilization of Cohesive and Noncohesive Sediments
In order to verify the reduction in sediment transport capacity in the upper YRE in 2010 with respect to 1997, we run a series of idealized sediment transport scenarios with the 1997 and 2010 bathymetries. For this set of simulations, a uniform distribution of SSC equal to 0.1 kg/m3was released in the water column of the upper YRE at high tide (water level measured at XLJ). For cohesive sediment transport, the key parameters are the settling velocityωsand the critical shear stressτcrfor erosion in the Partheniades-Krone formulation. Based on empirical formulations (Ge et al., 2015; Luan et al., 2017), we set uniformτcrvalues ranging from 0.05 to
Figure 4.Bathymetry of the Yangtze River estuary (YRE) in 1997 (a) and 2010 (b); bathymetry difference between 1997 and 2010 (c), red means accretion and blue erosion; hypsometric curve of the YRE in 1997 and 2010 (d).
0.5 N and a settling velocity of 0.2 mm/s. After releasing the cohesive sediment in the water column, the model was run with a fixed bed for 1 month. The total amount of sediment (both suspended and deposited) within the upper YRE was recorded. The total amount of sediment trapped in the upper YRE was higher in 2010, irrespectively of the critical shear stress of erosion (Figure 5a).
A second set of simulations explored the potential remobilization of bottom sediments with the 1997 and 2010 bathymetries. We set two main bed sediment fractions: a sand fraction with D50 = 125μm and a cohe-sive sediment fraction (mud) with a settling velocity of 0.2 mm/s and critical shear stress for erosion of 0.05 Pa. The two fractions were based on the distribution of sediments derived from bed samples (Figure 2). The initial thickness of the transport layer was set to 0.3 m with two bookkeeping-under layers of 1 m. We used an initial mass ratio of sand and mud of 3.56 within the upper YRE, in accordance tofield data (Figure 2). To quantify remobilization, we then measure how much sediment leaves the estuary as a function of time. Our results show that the cohesive sediment fraction is more easily resuspended and that there is less resuspension for both mud and sand in 2010 (Figure 5b). Moreover, the mud was more sensitive to the bathymetric varia-tions that occurred between 1997 and 2010.
The transport of sand is divided into suspended and bed load following the definition of reference height introduced by Van Rijn (1993). We define total suspended load as the sum of both mud and sand suspended transport, while the total bed load only accounts for sand transport. To interpret the effect of bathymetry on initial deposition and erosion patterns, the divergence of suspended load and bed loadfluxes was calculated byDiv¼∂Qx
∂x þ ∂Qy
∂y, whereDivis the sedimentflux divergence andQxandQyindicate sedimentflux in thex
andydirections during two tidal cycles (Xu et al., 2016).
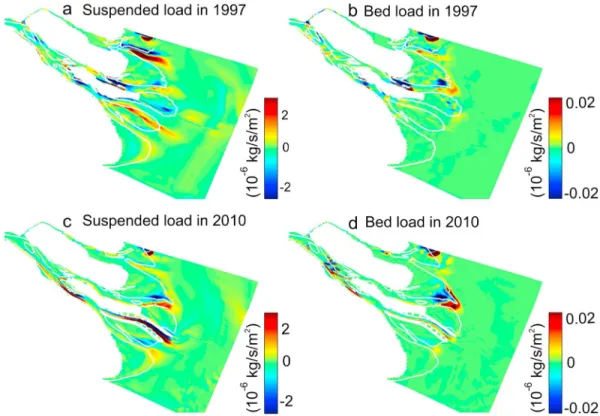
Suspended load is significantly higher (up to two orders of magnitude) than bed load. Patterns of sedi-mentflux divergence after two spring tides show that gradients in suspended load are responsible for sediment reworking in the distributary channels, where elongated zones of sediment convergence (deposition) and divergence (erosion) are present (Figures 6a and 6c). These gradients in suspended sedi-ment could be partly responsible for the lateral shifting of the distributary channels, as observed in the bathymetric data (Figure 4c). Suspended sedimentfluxes also weakly converge in the shoals area, likely triggering widespread deposition, possibly explaining shoal accretion measured between 1997 and 2010 (Figure 4c). Gradients in bed loadfluxes are much more localized at the shoals edges, particularly in the East Chongming Shoal (Figures 6b and 6d). Strong convergence of bed load at the seaward part of the shoal combined to divergence at the landward part indicates that the shoal is prograding shoreward. This analysis of initial erosion and deposition patterns indicates that bed load promotes shoal prograda-tion while suspended sediments are continuously deposited on the shoals surface. Both mechanisms are in agreement with the measured increase in shoals size and elevation (Figure 4c). Furthermore, the convergence of suspended sediment and bed load fluxes is more localized on the shoals in 2010 (Figures 6c and 6d). This is because the ebb velocities in the distributary channels are lower and the
Figure 5.(a) Sum of suspended and deposited cohesive sediment within the upper Yangtze River estuary (YRE) in 1997 and 2010 (see Figure 2 for definition of location); (b) remobilization of bottom sediments in 1997 and 2010, both cohesive sediment (mud) and sand are considered.
sediment is hardly transported in deep water. In 1997, when the tidal prism was higher, the sediments were spread across a larger part of the shelf (Figures 6a and 6b).
4.3. Feedback Between Shoal Morphology and Deposition
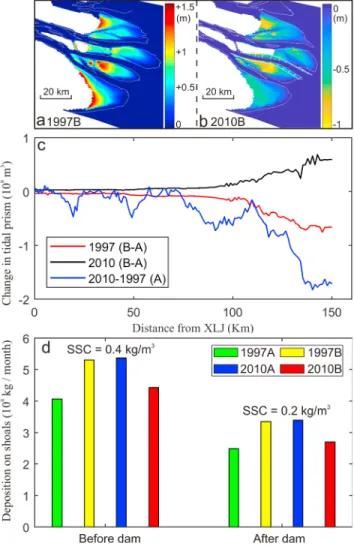
The estuary experienced large-scale accretion and erosion between 1997 and 2010 (Figure 4c). To determine whether there is a feedback between shoal surface area and deposition patterns, we use two modified bath-ymetries in which only the elevation of the shoals is changed. In this way, we isolate the effect of shoal accre-tion on sedimentfluxes without considering other morphological variations in the distributaries, upper estuary, and offshore bathymetry. The original 1997 bathymetry (1997A) was modified by linearly increasing the elevation of the shoals starting at the 5-m isobath and adding the same volume of sediments deposited on the shoals between 1997 and 2010. The new bathymetry is named 1997B, and the difference between the two is shown in Figure 7a. Similarly, the same volume of sediments was removed from the shoals of the 2010 bathymetry (2010A) by linearly decreasing the elevation to produce the bathymetry 2010B (Figure 7b). The shoals area of 1997A is the same as in 1997B; similarly, the shoals area of 2010A is the same as in 2010B. For the two 1997 bathymetries, we run the model with an input sediment concentration of 0.4 kg/m3at the Datong station, while for the two 2010 bathymetries, we use as boundary condition a sediment concen-tration of 0.2 kg/m3. These two values are in accordance with the reduction in sediment concentration trig-gered by the construction of the TGD: the recorded riverine SSC has decreased from 0.386 kg/m3 in 1986– 1997 to 0.197 kg/m3in 2002–2010 (Luan et al., 2017). The settling velocity of riverine cohesive sediment is set to be 0.2 mm/s and the critical shear stress at 0.05 N/m2. All simulations were run with afixed bed until the monthly deposition on the shoals approaches a stable value. The steady state, monthly sediment deposi-tion rate on the shoals was then computed (Figure 7d).
Figure 7c shows how the tidal prism changes with the four different bathymetries. An increase in shoal eleva-tion in 1997 leads to a decrease in tidal prism. This decrease accounts for 43% of the total tidal prism reduc-tion that occurred between 1997 and 2010. Therefore, bathymetric changes in other parts of the system are also responsible for prism reduction as, for example, the reclamation of shoals in the NB. A reduction in the
Figure 6.Sedimentflux divergence for suspended load in 1997 (a) and in 2010 (c). Sedimentflux divergence for bed load in 1997 (b) and in 2010 (d). The divergence is calculated for two tidal cycles, and positive values indicate convergence of sedimentfluxes.
elevation of the shoals in 2010 results in an increment in tidal prism, accounting for 35.2% of the difference between 1997 and 2010. These two results indicate that irrespectively of the general bathymetry of the estuary, higher shoals lead to a reduction in tidal prism.
The monthly deposition rates on the shoals become stable after about 18 months, when all the initial sediment entering at the Datong station reaches the lower estuary. The 1997 bathymetry with higher shoals (1997B) traps 34.3% more sediments on the shoals than the real bathyme-try (1997A). At the same time, the 2010 bathymebathyme-try with lower shoals (2010B) capture 20.4% less sediment than the real bathymetry (2010A). We therefore conclude that higher shoals favor deposition of sediment on the shoals themselves, while lower shoals hinder deposition. Thus, a positive feedback exists by which deposition would create higher shoals, dampen tidal oscillations, reduce the tidal prism, and promote further deposition. On the contrary, erosion of the shoals would increase tidal prism and decrease the sediment trapping capacity of the shoals. Less sediment is deposited on the shoals with the lower SSC simulated in 2010 (Figure 7d). It is interesting to note that despite a sediment load decrease of 50%, the deposition rate on the shoals with the 2010 bathyme-try (2010A) was reduced by only 17% compared to the 1997 bathymebathyme-try (1997A). This result proves that the sediment trapping capacity in 2010 increased because of the higher shoals, partly mitigating the decrease in sediment input due to the construction of the TGD.
4.4. General Hydrodynamic Parameters
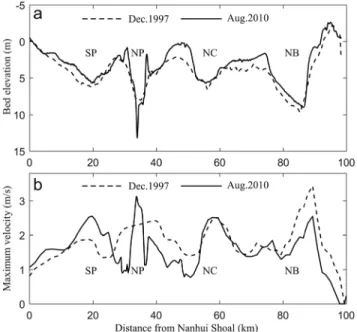
Figure 8 describes the seaward distribution of the main hydraulic variables in 1997 and 2010. Tidal range (Figure 8b) and tidal prism (Figure 8c) increase seaward as the estuary width increases (Figure 8a). The area near the bifurcation between NP and SP (near the Shidongkou station in Figure 1b) is the tipping point; after this location, the width increases dra-matically and so does the tidal prism. The tidal rangefirst increases, then reaches a peak around the mouth shoals and then decreases seaward. For both years, the maximum velocityfluctuates drastically along the estu-ary with slightly larger values appearing within the shoals area at the mouths (Figure 8d). Differences between 1997 and 2010 (Figure 8) allow understanding the effects of bathymetric variations on hydrodynamics. For locations upstream of the shoals, the tidal range drops sharply between 1997 and 2010, indicating an increase in tidal energy dissipation. Consequently, both the tidal prism (Figure 8c) and maximum velocities (Figure 8d) become lower in 2010.
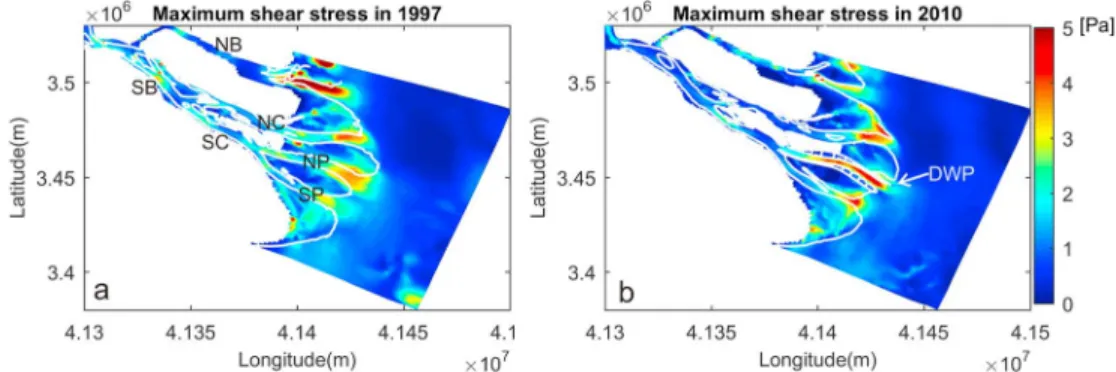
Figure 9 shows the maximum bed shear stress distribution within the YRE during a spring tidal cycle for the two bathymetries of 1997 and 2010. Bottom shear stress values are such that they peak around the shoals area near the mouths and rapidly decrease both upstream and downstream. Figure 10 compares bed elevation and maximum velocity values during a spring tidal cycle along a transect perpendicular to the distributary channels and dissecting the shoals (labeled shoals cross section in Figure 1b). Shoals have accreted while the four distributaries have kept relatively stable depths except for the NP channel. Maximum velocity peaks at the NP waterway where the depth was dredged to 12.5 m. The shoals, especially the East Hengsha and Jiuduan Shoals adjacent to the DWP, show extensive deposition, with a decrease in maximum tidal velocity. Deeper channels concentrate the flow and produce higher velocities, while shallower shoals increase friction, dissipate tidal energy, and decrease the tidal prism, thus reducing the maximum velocity.
Figure 7.(a) Difference between the 1997B and 1997A bathymetries. The 1997A is the original bathymetry in 1997; 1997B is the bathymetry obtained by linearly increasing the elevation of the shoals. (b) Difference between the 2010B and 2010A bathymetries. The 2010A is the original bathymetry in 2010; 2010B is the bathymetry obtained by linearly decreasing the elevation of the shoals; the white line is the 5-m isobath. (c) Changes of the tidal prism along cross sections of the estuary from Xuliujing to offshore. The red line of 1997 (B-A) indicates the difference in tidal prism between 1997A and 1997B. The black line indicates the difference of tidal prism between 2010A and 2010B. The blue line indicates the difference of tidal prism between 1997A and 2010A; negative values indicate a decrease in tidal prism. (d) Amount of sediment deposited on the shoals in a month for the four scenarios, with an upstream suspended sediment concentration (SSC) input of 0.4 kg/m3for 1997A, B and 0.2 kg/m3for 2010A, B.
To illustrate changes in bed shear stress in different scenarios, we use the erosion factor (EF) as proposed by Fagherazzi and Wiberg (2009):
EF¼∑ n i¼1ðτiτcÞAi ∑i 1Ai (3)
whereτiis the maximum bottom shear stress during a tidal cycle at a given
location,τcris the average critical bottom shear stress of bottom
sedi-ments, andAiis the area of the computational grid cell where the shear
stress is calculated. The EF is defined throughout the entire computation domain; a smaller EF corresponds to a more stable morphological confi g-uration with respect to erosion. The averageτcrfor erosion can be
approxi-mated as 1.3 N/m2 according to the sediment concentration retrieved from the Geostationary Ocean Color Imager (GOCI) satellite data and FVCOM hydraulic modeling of the YRE (Ge et al., 2015).
Figure 11 shows the percentage area subject to different shear stress values within the entire system from XLJ to the offshore computational boundary and corresponding EF values. Although the peak frequency of maximum shear stress becomes larger (around 0.7 N/m2) in 2010, the per-centage of area with maximum shear stress values larger than 1.3 N/m2 decreases, leading to an overall smaller EF. Similar results are found in NP, SP, and NC channels dissecting the mouth bars: the distribution of bot-tom shear stress shifts toward lower values. Smaller EF values indicate that the YRE bottomsets are more stable and less subject to erosion.
4.5. Residual Flow
Eulerian residual currents are used to depict the residual transport of sedi-ments and are calculated as the average velocity throughout two consecu-tive spring tidal cycles. The distribution of residual velocities for 1997 and 2010 is shown in Figures 12a and 12b. The residual velocities in the upper estuary are of the same order of magnitude as those calculated with a baroclinic 3D model by Xue et al. (2009) and the shallow water model of Zhang et al. (2017).
Generally, in 1997 as well as in 2010, the residual velocity follows the ebb direction except at the shoals near the mouths. Between 1997 and 2010, the residual velocity at East Hengsha Shoal switched from ebb tofl ood-directed. Strong ebb currents occur in the area outside the NB, while strongflood currents occur within the NB channels. This can be caused by land reclamation, coupled with a reduced river discharge that forced
Figure 8.Estuarine width (a), cross-sectional averaged water level (b), tidal prism (c), and maximum velocity (d) along the estuary from Xuliujing (XLJ) to offshore in 1997 (dotted lines) and in 2010 (solid lines). The width and prism are obtained by summing the values along a cross section. SHDK = Shidongkou, HS = Hengsha, MSL = mean sea level, DWP = Deep Waterway Project.
Figure 9.Maximum bed shear stress during a spring tide cycle in 1997 (a) and 2010 (b). SB = South Branch, NB = North Branch, SC = South Channel, NC = North Channel, SP = South Passage, NP = North Passage, DWP = Deep Waterway Project.
the NB to be aflood-dominated tidal channel. The river discharge of the SP promotes an ebb-directed residual velocity (Wang et al., 2015).
Figure 12c shows the differences in residual velocity from 1997 to 2010. The lower reaches of the SP, NP, the entire NC, and the area along the 5-m isobaths display an increase in ebb current magnitudes. For the 2010 configuration, residual currents from the NC, SP and NP channels tend to deviate southwest after exiting the distributaries. The main differ-ence with respect to the 1997 residual currents is that the southwest portion of the estuary is more ebb dominated and that currents from the NP deviate south rather than north.
4.6. Tidal Asymmetry
Tidal asymmetry can impact the sediment transport and morphological evolution of tidally dominated estuaries (Guo et al., 2015; van der Wegen, 2013). The largefluvialflow controls residual currents in the SP, NP, and NC resulting in an ebb-dominated system (Figure 12; see also Chu et al., 2015). However, tidal distortion can amplify or decrease ebb dominance and the transport of sediments to the ocean. Tidal distortion in the YRE is controlled by channel depths because of the relatively small increase in channel width between low and high water. Because of the higher water depth, the tidal wave crest travels faster than the trough, increasing the current duringflood (Friedrichs, 2010; Hunt et al., 2015). A detailed analysis of tidal harmonics in the YRE delta indicates that the con-tribution of the M4 constituent to tidal asymmetry is the largest and that interactions of the residual current M0 with all tidal constituents also affect the residual sediment transport (Chu et al., 2015). Here, for sake of simplicity, we only focus on the M2 and M4 constituents, exploring whether their contribution to tidal asymmetry changed between 1997 and 2010. A detailed analysis of tidal distortion is behind the scope of this study and will be addressed in future research.
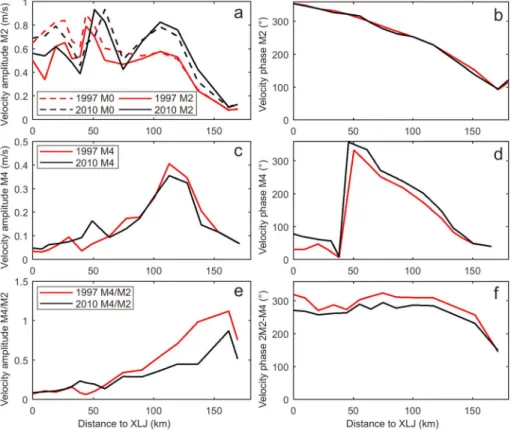
Following Friedrichs and Aubrey (1988) we use the M4/M2 amplitude ratio and the relative phase difference between M2 and M4 to characterize tidal asymmetry. An increase in the M4/M2 ratio indicates an increase in tidal distortion, and a water surface phase of 2M2-M4 between 0° and 180° and velocity phase of 2M2-M4 between 270° and 90° indicate theflood direction of the M4 contribution to the residual sediment transport; Van de Kreeke & Robaczewska, 1993). The M2 and M4 amplitude and phase of both water level and velocity in 1997 and 2010 are extracted by harmonic analysis of modeled water levels and currents during a 3-month period (Figures 13 and 14). The tidal amplitude and phase are evaluated along the SB-SC-NP (Figure 1). Generally, the residual current M0 increases upstream, where the estuary is narrow andfluvial discharge is relatively more important than tidal discharge (Figure 14a). The water surface phase (2M2-M4; Figure 13f) and velocity phase (2M2-M4; Figure 14f) in 1997 and 2010 indicate that the M4/M2 contribution isflood direc-ted, thus decreasing the residual sediment transport (Van de Kreeke & Robaczewska, 1993). Only in the distal part of the shoals, the M4/M2 com-ponent becomes ebb directed, favoring the flushing of sediments (Figures 13f and 14f). The amplitude of the M2 tidal harmonic increases landward before reaching the shoals and decreases afterward, while the M4 harmonic increases as the tide propagates landward. Similar to the distribution of maximum shear stress showed in Figure 9, both the M2 and M4 velocity amplitudes peak at the shoals area (Figure 14). Amplitudes and phases of both M2 and M4 are similar to those reported in the modeling study of Lu et al. (2015).
Along the upper estuary, the residual current M0 is lower in 2010. However, it increases at the mouth in 2010 due to the presence of the DWP (Figure 14a). Tidal amplitudes of both M2 and M4 components decrease in 2010 (Figures 13a and 13c), leading to tidal range damping
Figure 10.Bed elevation (a) and maximum velocity (b) along the Yangtze River estuary shoals cross section (see Figure 1b) in 1997 and 2010. NB = North Branch, NC = North Channel, SP = South Passage, NP = North Passage.
Figure 11.Percentage of Yangtze River estuary area characterized by a given maximum shear stress during a spring tide cycle. EF = erosion factor.
upstream of the shoals (see Figure 5b). There is no obvious change for the water level M4/M2 amplitude ratio (Figure 13e) and for the velocity M4/M2 amplitude ratio except for a small area influenced by dredging activities (Figure 14e). We conclude that the M4/M2 component of tidal asymmetry did not significantly change between 1997 and 2010 and thus cannot directly explain part of the observed patterns of erosion and deposition between the 2 years.
5. Discussion
The hydrodynamics of estuarine systems is very sensitive to bathymetric variations. Changes in estuarine bathymetry reflect the natural evolution of the system as well as the effect of human interventions. Here we imple-ment a numerical model based on two bathymetries surveyed in 1997 and in 2010. Although similar studies have been carried out in parts of the YRE (Jiang et al., 2012; Song & Wang, 2013; Zhu et al., 2016), this study is one of the few that focuses on the entire system and explores possible feedbacks between hydrodynamics and morphology. In tidal deltas, hydrodynamic variables including tidal prism and tidal range increase seaward as the estuary width increases. A recent study based on long-term data recorded by 11 tidal gauges in the YRE indicates a decrease in mean high tidal level and an increase in mean low tidal level, yielding a reduction of 15 to 30 cm in tidal range since 1996, mostly in the upper reaches of the YRE (Tang & Fu, 2016). Our model results show a decrease in tidal range from 1997 to 2010, which agrees well with the tidal gauge data (Figure 8b). However, the reduction of tidal range in our simulations is larger than observed (2–3 times larger), possibly due to the simplified bottom friction scheme used for different bottomsets and to the sensitivity of the model hydrody-namics to hard engineering structures and to variations in water depths. In the YRE, the tidal prism and residual velocity along the estuary are lower with the 2010 bathymetry with respect to the 1997 bathymetry. Canestrelli et al. (2010) demonstrated that the tidal prism in the Fly River Delta decreases as deltaic islands prograde, thus yielding smallerflow velocities and bottom shear stresses. This is because larger islands increase friction and tidal dissipation, thus reducing the tidal prism. A similar mechanism is also present in the YRE. The continuous accretion of mouth shoals under natural processes, together with the progradation of shoals triggered by the DWP, increases bottom friction, thus reducing the tidal amplitude in the entire estuary (Figures 8 and 13). A smaller tidal amplitude decreases the tidal prism (Figure 8), leading to lower tidal peak velocities that are unable toflush sediments offshore (Figure 5). As a result, the bottom of the distributary channels did not change or slightly aggraded between 1997 and 2010, while the water depth diminished on the shoals (see Figure 10). A general reduction in water depth increases water velocity, so the system could eventually counteract deposition and find a new equilibrium configuration with higher bottomsets.
Our results show that the sediment trapping capacity in the upper YRE increased for both cohesive and noncohesive sediments. Specifically, more cohesive sediment in suspension deposits in the upper YRE with the 2010 bathymetry (Figure 5a) and fewer bottom sediments (both cohesive and noncohesive) are remobilized with the 2010 bathymetry (Figure 5b). This is due to a decrease in tidal prism, peak velocity, and related bottom shear stresses (Figure 9). The conceptual geometric model of Gao (2007) suggested that the Yangtze delta growth may reach its limit with a 60% reduction in sediment load. Our data show that the YRE mouth shoals are still
Figure 12.Residual velocity vectors in the Yangtze River estuary in 1997 (a) and 2010 (b), difference in residual velocity vectors between 1997 and 2010 (c).
accreting and slightly prograding seaward even after the construction of the TGD in 2003. This is because a positive hydrodynamic and morphodynamic feedback exists that enhances the trapping of sediments in the estuary and, in particular, in the mouth shoals zone.
In fact, from our simplified analysis, we estimate that the delta configuration in 2010 is storing at least 27% morefine sediments in the upper YRE (Figure 5a). This increase in sediment trapping can partly offset the 60% decrease in river sediment load caused by the construction of the TGD (Dai et al., 2016). Moreover, even if a smaller volume of sediments reaches the estuary, a larger fraction of sediments can be trapped in tidal bars and shoals (Figure 7d).
Long-term bathymetric variations can also lead to tidal distortion, affecting residual sediment transport. Our preliminary analysis, limited to the residualflow M0 and the M2 and M4 harmonics, indicates that tidal asym-metry did not change between 1997 and 2010. This is because a reduction of the M2 water level amplitude was followed by a reduction of the M4 water level amplitude (Figure 13). However, more work is necessary to fully understand how the bathymetric evolution of the system has affected the propagation of the tide along the estuary.
Obviously more research andfield data are needed to prove the feedback between morphology and sedi-ment deposition. Here we have only used one cohesive sedisedi-ment fraction (mud) to determine the trapping efficiency, while the range of sediments discharged by the river is very large. Moreover, we did not model the input of sand from upstream, which would require modeling the lower reaches of the river to correctly cap-ture bed loadfluxes. In addition, ignoring baroclinic effects might lead to overestimation of depth-averaged velocity and shear stress especially in the estuarine turbidity maximum zone near the shoals (Song & Wang, 2013). A partially mixed or stratifiedflow would reduce the maximum bottom shear stresses in the channels dissecting the shoals (Figure 9) and the overall distribution of shear stresses (Figure 11). It is unknown whether the bathymetric changes between 1997 and 2010 have increased or decreased the occurrence of stratification in the estuary. More research is needed in order to understand and quantify the feedbacks between stratification and morphology. Waves are also an important geomorphic agent near the shoals,
Figure 13.Water level (WL) amplitude (a, c, e) and phase (b, d, f) along the estuary: (a, b) M2 harmonic component, (c, d) M4 harmonic component, (e) amplitude ratio M4/M2, and (f) phase difference 2M2-M4. XLJ = Xuliujing.
given the shallow depths. Feedbacks between waves and morphology are likely to be present and need to be explored in future research. Finally, sediments are delivered in pulses duringflood events, the dynamics of which are not included in our model. This notwithstanding, the increase in sediment trapping efficiency triggered by the feedback between tidal prism and sediment deposition and erosion seems a plausible explanation for the overall aggradation of the shoals area (Figure 4c) despite the reduction in sediment load caused by the TGD (Dai et al., 2016). The increase in trapping efficiency could also explain the erosion occurring offshore, between the 5- and 15-m isobaths (Zhang et al., 2015). More sediment trapped in the estuary results in less sediment reaching this area, which might have become sediment starved.
The tidal range peaks in the shoal area (Figure 8b), and we therefore believe that this zone has a strong con-trol on tidal propagation. Shoals accretion increases bottom friction and reduces the tidal range at this loca-tion (Figure 8b). This reducloca-tion is then felt in the entire upstream estuary, causing a decrease in tidal prism (Figure 8c). A reduction in tidal prism diminishes tidal discharges, tidal peak velocities, and related shear stresses in the distributary channels (Figure 8d). As a result, less sediment is resuspended in each tidal cycle (Figure 5). Areas where the maximum bottom shear stress is below the cri-tical shear stress for erosion also increase in size, trapping more sediment (Figure 11). Moreover, reduced tidal velocities can reduce Stokes transport leading to a smaller Stokes-induced returnflow, thus also reducing bed-load transport, although this can be offset by unequal compensation pre-sent in distributary channel networks (Buschman et al., 2010).
The distributaries are therefore unable to flush sediments outside the delta, which in turn increases sediment retention in the system (Figures 5, 6, and 7). This retention might decrease theflux of sediment in deeper areas just offshore of the shoals, the only place where substantial erosion has been measured after the construction of the TGD. Moreover,
Figure 14.Velocity amplitude (a, c, e) and phase (b, d, f) along the estuary: (a, b) M0 and M2; (c, d) M4; (e) amplitude ratio M4/M2, and (f) phase difference 2 M2-M4. XLJ = Xuliujing.
Figure 15.Positive feedback between hydrodynamic and morphodynamic variables.
shoals accretion concentrates theflow in the channels, thus reducing the tidalflow on the shoals (Fagherazzi & Furbish, 2001), modifying residual currents (Figure 12), and promoting further deposition on the shoals. This positive feedback (Figure 15) leads to more sediment trapping in the delta, potentially offsetting the decrease in sediment load triggered by the construction of the TGD (Figure 7d).
Conversely, shoal accretion and silting of the distributary channels (Figure 10) lead to a reduction in water depth and an increase in bottom shear stresses (Figure 9). Higher shoals would transfer moreflow in the dis-tributary channels, increasing velocity there, possibly leading to more sedimentflushing. This could poten-tially counteract the positive feedback between shoal accretion and tidal prism. Our bathymetric data indicate that distributaries are silting and not eroding (Figure 10); we thus conclude that the reduction in tidal prism (positive feedback) dominates over theflow concentration in the distributaries.
Because of the reduction in tidal prism, the bottom of the estuary is becoming more stable, with fewer areas subject to erosion (Figure 6). The feedback presented herein has transferred the effect of the reduction in sediment transport caused by the TGD in deeper areas, between the 5- and 15-m isobaths (Figure 4c). This intrinsic resilience of the system could be reverted if the shoals enter in an erosive phase. Lowering of the shoals surface would lead to a higher tidal range, larger tidal prism, higher velocities, less sediment trapping, and more sediment removal (Figures 7c and 7d). The system could thus quickly degrade exporting large volumes of sediments from the shallow estuary to deep waters. We therefore conclude that the shoals area is the most sensitive part of the system, and it should be carefully monitored to prevent large-scale morpho-logical variations of the delta.
Recent research results indicate that tidal deltas are relatively stable (Hoitink et al., 2017); however, this might be true only in the long term, while at the decadal timescale, positive feedbacks could shift the entire system toward a new configuration. The feedback between morphology and tidal prism presented in this manu-script, if confirmed with morefield data, is an example of how changes in one physical parameter can rever-berate across the entire system, causing the amplification of the process that produces the change. A reduction in tidal prism due to island progradation was already observed by Canestrelli et al. (2010) in the Fly River delta, and therefore, our results seem of general validity and exportable to different deltaic systems. Here we further show that a reduction of tidal prism favors more deposition on the shoals, thus producing a positive feedback between morphology and sediment transport.
More importantly, we believe that the identification and quantification of positive and negative feedbacks between hydrodynamics and sediment transport is critical in order to understand deltas in general. Yet very little work has been done in this regard and without a systematic approach. Clearly, more research is needed in the Yangtze delta to determine the extent and importance of the positive feedback presented herein, but we believe that our results indicating that such a feedback might exist are already an important step toward a novel approach regarding deltaic morphodynamics.
6. Conclusion
In this manuscript we explored a possible feedback between tidal prism and bathymetry in a tidal delta using data from the YRE. The numerical model Delft3D was utilized to study the influence of bathymetric variations on tidal hydrodynamics and suspended and bedload transport. Our simulations show that tidal range, tidal prism, and tidal peak velocities along the YRE are lower with the 2010 bathymetry for respect to the 1997 bathymetry. Convergence of sedimentfluxes near the distributary mouths leads to accretion and prograda-tion of shoals, increasing tidal dissipaprograda-tion in the shallow area in front of the delta. This in turn reduces the tidal range, producing a net decrease in tidal prism for the entire delta. A reduced tidal prism diminishes tidal dis-charge and peak velocities, preventing sedimentflushing and favoring sediment trapping. We believe that this positive feedback has mitigated the drastic reduction in sediment load triggered in the last decade by the construction of the TGD. As a result, most of the detected erosion in the YRE is occurring between the 5- and 15-m isobaths, offshore of the distributary mouth shoals. The positive feedback between deposition and tidal prism highlights the importance of the shoals for the stability of the entire delta. Erosion of these shoals would in fact increase tidal prism and tidal peak velocities and lead to more erosion. This cascade effect could destabilize the entire delta in the near future.
References
Allen, J. I., Somerfield, P. J., & Gilbert, F. J. (2007). Quantifying uncertainty in high-resolution coupled hydrodynamic-ecosystem models. Journal of Marine Systems,64(1–4), 3–14. https://doi.org/10.1016/j.jmarsys.2006.02.010
Buschman, F. A., Hoitink, A. J. F., Van Der Vegt, M., & Hoekstra, P. (2010). Subtidalflow division at a shallow tidal junction.Water Resources Research,46, W12515. https://doi.org/10.1029/2010WR009266
Canestrelli, A., Fagherazzi, S., Defina, A., & Lanzoni, S. (2010). Tidal hydrodynamics and erosional power in the Fly River delta, Papua New Guinea.Journal of Geophysical Research,115, F04033. https://doi.org/10.1029/2009JF001355
Chu, A., Wang, Z., & de Vriend, H. J. (2015). Analysis on residual coarse sediment transport in estuaries.Estuarine, Coastal and Shelf Science, 163, 194–205. https://doi.org/10.1016/j.ecss.2015.06.003
Dai, Z., Fagherazzi, S., Mei, X., Chen, J., & Meng, Y. (2016). Linking the infilling of the North Branch in the Changjiang (Yangtze) estuary to anthropogenic activities from 1958 to 2013.Marine Geology,379, 1–12. https://doi.org/10.1016/j.margeo.2016.05.006
Dai, Z., Liu, J. T., Fu, G., & Xie, H. (2013). A thirteen-year record of bathymetric changes in the North Passage, Changjiang (Yangtze) estuary. Geomorphology,187, 101–107. https://doi.org/10.1016/j.geomorph.2013.01.004
Dalrymple, R. W., & Choi, K. (2007). Morphologic and facies trends through thefluvial–marine transition in tide-dominated depositional systems: A schematic framework for environmental and sequence-stratigraphic interpretation.Earth-Science Reviews,81(3–4), 135–174. https://doi.org/10.1016/j.earscirev.2006.10.002
Egbert, G. D., Bennett, A. F., & Foreman, M. G. (1994). TOPEX/POSEIDON tides estimated using a global inverse model.Journal of Geophysical Research,99(C12), 24,821–24,852. https://doi.org/10.1029/94JC01894
Egbert, G. D., & Erofeeva, S. Y. (2002). Efficient inverse modeling of barotropic ocean tides.Journal of Atmospheric and Oceanic Technology, 19(2), 183–204. https://doi.org/10.1175/1520-0426(2002)019<0183:EIMOBO>2.0.CO;2
Fagherazzi, S. (2008). Self-organization of tidal deltas.Proceedings of the National Academy of Sciences. https://doi.org/10.1073/ pnas.0806668105
Fagherazzi, S., Edmonds, D. A., Nardin, W., Leonardi, N., Canestrelli, A., Falcini, F., et al. (2015). Dynamics of river mouth deposits.Reviews of Geophysics,53, 642–672. https://doi.org/10.1002/2014rg000451
Fagherazzi, S., & Furbish, D. J. (2001). On the shape and widening of salt marsh creeks.Journal of Geophysical Research,106(C1), 991–1003. https://doi.org/10.1029/1999JC000115
Fagherazzi, S., & Wiberg, P. L. (2009). Importance of wind conditions, fetch, and water levels on wave-generated shear stresses in shallow intertidal basins.Journal of Geophysical Research,114, F03022. https://doi.org/10.1029/2008JF001139
Friedrichs, C. T. (2010). Barotropic tides in channelized estuaries. InContemporary issues in estuarine physics(pp. 27–61). Cambridge, UK: Cambridge University Press.
Friedrichs, C. T., & Aubrey, D. G. (1988). Non-linear tidal distortion in shallow well-mixed estuaries: A synthesis.Estuarine, Coastal and Shelf Science,27(5), 521–545. https://doi.org/10.1016/0272-7714(88)90082-0
Gao, S. (2007). Modeling the growth limit of the Changjiang Delta.Geomorphology,85(3–4), 225–236. https://doi.org/10.1016/j. geomorph.2006.03.021
Ge, J., Shen, F., Guo, W., Chen, C., & Ding, P. (2015). Estimation of critical shear stress for erosion in the Changjiang estuary: A synergy research of observation, GOCI sensing and modeling.Journal of Geophysical Research: Oceans,120, 8439–8465. https://doi.org/10.1002/ 2015JC010992
Guo, L., Van der Wegen, M., Jay, D. A., Matte, P., Wang, Z. B., Roelvink, D., et al. (2015). River-tide dynamics: Exploration of nonstationary and nonlinear tidal behavior in the Yangtze River estuary.Journal of Geophysical Research: Oceans,120, 3499–3521. https://doi.org/10.1002/ 2014JC010491
Guo, L., Van der Wegen, M., Roelvink, J. A., & He, Q. (2014). The role of riverflow and tidal asymmetry on 1-D estuarine morphodynamics. Journal of Geophysical Research: Earth Surface,119, 2315–2334. https://doi.org/10.1002/2014JF003110
Hoitink, A. J. F., Wang, Z. B., Vermeulen, B., Huismans, Y., & Kästner, K. (2017). Tidal controls on river delta morphology.Nature Geoscience, 10(9), 637–645. https://doi.org/10.1038/ngeo3000
Hori, K., Saito, Y., Zhao, Q., & Wang, P. (2002). Architecture and evolution of the tide-dominated Changjiang (Yangtze) River delta, China. Sedimentary Geology,146(3–4), 249–264. https://doi.org/10.1016/S0037-0738(01)00122-1
Hu, K., Ding, P., Wang, Z., & Yang, S. (2009). A 2D/3D hydrodynamic and sediment transport model for the Yangtze estuary, China.Journal of Marine Systems,77(1–2), 114–136. https://doi.org/10.1016/j.jmarsys.2008.11.014
Hunt, S., Bryan, K. R., & Mullarney, J. C. (2015). The influence of wind and waves on the existence of stable intertidal morphology in meso-tidal estuaries.Geomorphology,228, 158–174. https://doi.org/10.1016/j.geomorph.2014.09.001
Jiang, C., Li, J., & de Swart, H. E. (2012). Effects of navigational works on morphological changes in the bar area of the Yangtze estuary. Geomorphology,139-140, 205–219. https://doi.org/10.1016/j.geomorph.2011.10.020
Kuang, C., Liu, X., Gu, J., Guo, Y., Huang, S., Liu, S., et al. (2013). Numerical prediction of medium-term tidalflat evolution in the Yangtze estuary: Impacts of the Three Gorges project.Continental Shelf Research,52, 12–26. https://doi.org/10.1016/j.csr.2012.10.006 Leonardi, N., Canestrelli, A., Sun, T., & Fagherazzi, S. (2013). Effect of tides on mouth bar morphology and hydrodynamics.Journal of
Geophysical Research: Oceans,118, 4169–4183. https://doi.org/10.1002/jgrc.20302
Leonardi, N., Kolker, A. S., & Fagherazzi, S. (2015). Interplay between river discharge and tides in a delta distributary.Advances in Water Resources,80, 69–78. https://doi.org/10.1016/j.advwatres.2015.03.005
Li, P., Yang, S. L., Milliman, J. D., Xu, K. H., Qin, W. H., Wu, C. S., et al. (2012). Spatial, temporal, and human-induced variations in suspended sediment concentration in the surface waters of the Yangtze estuary and adjacent coastal areas.Estuaries and Coasts,35(5), 1316–1327. https://doi.org/10.1007/s12237-012-9523-x
Lu, S., Tong, C., Lee, D. Y., Zheng, J., Shen, J., Zhang, W., et al. (2015). Propagation of tidal waves up in Yangtze estuary during the dry season. Journal of Geophysical Research: Oceans,120, 6445–6473. https://doi.org/10.1002/2014jc010414
Luan, H. L., Ding, P. X., Wang, Z. B., & Ge, J. Z. (2017). Process-based morphodynamic modeling of the Yangtze estuary at a decadal timescale: Controls on estuarine evolution and future trends.Geomorphology,290, 347–364. https://doi.org/10.1016/j.
geomorph.2017.04.016
Partheniades, E. (1965). Erosion and deposition of cohesive soils.Journal of the Hydraulics Division,91(1), 105–139.
Sassi, M. G., Hoitink, A. J. F., Brye, D. B., & Deleersnijder, E. (2012). Downstream hydraulic geometry of a tidally influenced river delta.Journal of Geophysical Research,117, F04022. https://doi.org/10.1029/2012JF002448
Song, D., & Wang, X. H. (2013). Suspended sediment transport in the Deepwater Navigation Channel, Yangtze River estuary, China, in the dry season 2009: 2. Numerical simulations.Journal of Geophysical Research: Oceans,118, 5568–5590. https://doi.org/10.1002/jgrc.20411
Acknowledgments
This research was supported by the China Scholarship Council (201606140044), the National Natural Science Foundation of China (NSFC-51479074), and the National Science Foundation award DEB1237733 (VCR LTER). The authors acknowledge the support of Zhijun Dai in providing tidal gauge data. We would also thank the Editor Giovanni Coco, AE Ton Hoitink, two reviewers Maarten van der Vegt and Brad Murray, and two anon-ymous reviewers for their constructive comments; we thank in particular the AE Ton Hoitink for editing the paper in great detail. Data are available in https://doi.org/10.5281/ zenodo.1433940.
Syvitski, J. P., Kettner, A. J., Overeem, I., Hutton, E. W., Hannon, M. T., Brakenridge, G. R., et al. (2009). Sinking deltas due to human activities. Nature Geoscience,2(10), 681–686. https://doi.org/10.1038/ngeo629
Tang, Y., & Fu, G. (2016). Impact of Yangtze estuary deepwater channel regulation project on tidal characteristics.Port & Waterway Engineering,11(522), 151–156. https://doi.org/10.16233/j.cnki.issn1002-4972.2016.11.027. (Chinese paper with English adstract) Van de Kreeke, J., & Robaczewska, K. (1993). Tide-induced residual transport of coarse sediment; Application to the Ems estuary.Netherlands
Journal of Sea Research,31(3), 209–220. https://doi.org/10.1016/0077-7579(93)90022-K
van der Wegen, M. (2013). Numerical modeling of the impact of sea level rise on tidal basin morphodynamics.Journal of Geophysical Research: Earth Surface,118, 447–460. https://doi.org/10.1002/jgrf.20034
Van Rijn, L. C. (1993).Principles of sediment transport in rivers, estuaries and coastal seas(Vol. 1006). Amsterdam: Aqua Publications. Wang, J., Gao, W., Xu, S., & Yu, L. (2012). Evaluation of the combined risk of sea level rise, land subsidence, and storm surges on the coastal
areas of Shanghai, China.Climatic Change,115(3–4), 537–558. https://doi.org/10.1007/s10584-012-0468-7
Wang, Z. B., Van Maren, D. S., Ding, P. X., Yang, S. L., Van Prooijen, B. C., De Vet, P. L. M., et al. (2015). Human impacts on morphodynamic thresholds in estuarine systems.Continental Shelf Research,111, 174–183. https://doi.org/10.1016/j.csr.2015.08.009
Xu, F., Tao, J., Zhou, Z., Coco, G., & Zhang, C. (2016). Mechanisms underlying the regional morphological differences between the northern and southern radial sand ridges along the Jiangsu Coast, China.Marine Geology,371, 1–17. https://doi.org/10.1016/j.margeo.2015.10.019 Xue, P., Chen, C., Ding, P., Beardsley, R. C., Lin, H., Ge, J., et al. (2009). Saltwater intrusion into the Changjiang River: A model-guided
mechanism study.Journal of Geophysical Research,114, C02006. https://doi.org/10.1029/2008JC004831
Yang, S. L., Belkin, I. M., Belkina, A. I., Zhao, Q. Y., Zhu, J., & Ding, P. X. (2003). Delta response to decline in sediment supply from the Yangtze River: Evidence of the recent four decades and expectations for the next half-century.Estuarine, Coastal and Shelf Science,57(4), 689–699. https://doi.org/10.1016/s0272-7714(02)00409-2
Yang, S. L., Milliman, J. D., Li, P., & Xu, K. (2011). 50,000 dams later: Erosion of the Yangtze River and its delta.Global and Planetary Change, 75(1–2), 14–20. https://doi.org/10.1016/j.gloplacha.2010.09.006
Yu, Q., Wang, Y., Gao, S., & Flemming, B. (2012). Modeling the formation of a sand bar within a large funnel-shaped, tide-dominated estuary: Qiantangjiang estuary, China.Marine Geology,299-302, 63–76. https://doi.org/10.1016/j.margeo.2011.12.008
Yun, C. (2004).Recent evolution of the Yangtze estuary. Bejing: China Ocean Press.
Zhang, W., Feng, H., Hoitink, A. J. F., Zhu, Y., Gong, F., & Zheng, J. (2017). Tidal impacts on the subtidalflow division at the main bifurcation in the Yangtze River Delta.Estuarine, Coastal and Shelf Science,196, 301–314. https://doi.org/10.1016/j.ecss.2017.07.008
Zhang, X., Li, J., Zhu, W., Cheng, H., & Chen, W. (2015). The self-regulation process and its mechanism of channels’bed changes in the Changjiang (Yangtze) estuary in China.Acta Oceanologica Sinica,34(7), 123–130. https://doi.org/10.1007/s13131-015-0699-3 Zhao, J., Guo, L., He, Q., Wang, Z. B., van Maren, D. S., & Wang, X. (2018). An analysis on half century morphological changes in the Changjiang
estuary: Spatial variability under natural processes and human intervention.Journal of Marine Systems,181, 25–36. https://doi.org/ 10.1016/j.jmarsys.2018.01.007
Zhu, L., He, Q., Shen, J., & Wang, Y. (2016). The influence of human activities on morphodynamics and alteration of sediment source and sink in the Changjiang estuary.Geomorphology,273, 52–62. https://doi.org/10.1016/j.geomorph.2016.07.025