78
Exponentiated Transmuted Exponential
Distribution
Kareema Abed Al-Kadim Ashraf Alawi Mahdi
Mathematics Department, College of Education for Pure Sciences, University of Babylon
[email protected] [email protected]
Abstract
In this research, we introduced the exponentiated transmuted exponential (ETE) distribution. This distribution is more flexible than some distributions so we investigate some of its properties. As well as studying the maximum likelihood estimation of this distribution.
Keywords: Exponentiated transmuted exponential distribution, moment generating function, maximum likelihood estimates.
ةصلاخلا
اذهل صاوخلا ضعب انشقان كلذل تاعيزوتلا ضعب نم ةنورم رثكأ وه عيزوتلا اذه .لوحملا يسلال يسلاا عيزوتلا مدقن ثحبلا اذه يف .عيزوتلا اذهل مظعلاا ناكملاا ردقم ةسارد نع ًلاضف .عيزوتلا ةيحاتفملا تاممكلا لوحملا يسلال يسلاا عيزوتلا ، موزعمل ةدلوملا ةلادلا ، . مظعلاا ناكملاا ردقم1. Introduction
The exponential (E) distribution is one of the important families of distributions in lifetime tests .The exponentiated(generalized) family(EF) of distributions were established since the first half of the nineteenth century when Gompertz (1825) and Verhulst (1838, 1845, 1847) used the cumulative distribution function (cdf) (Nadarajah et al., 2015).
, where ρ, α and λ are positive real numbers.
Exponentiated distributions can be obtained by three methods (Moniem et al(2012b)): if we have cdf G(u) of any random variable, then the function is called an generalized distribution, Using the formula and by the transformation
,where X is non-negative random variables(Nadarajah, 2005).
Gupta and Kundu (2001) used generalized exponential distribution as an alternative to gamma or Weibull distribution. Sarhan, Baset and Alasbahi (2012 c) introduced the Exponentiated generalized linear exponential distribution and discussed the some statistical properties for the distribution. Flaih et al.(2012a) considered the standard exponentiated inverted weibull distribution (EIW) that exponentiated the standard inverted weibull distribution (IW) and discussed the moments, median and some statistical properties. The Transmuted Exponentiated Gamma Distribution is introduced by Mohamed (2014). Afify et al. (2015a) presented the transmuted Weibull Lomax distribution: Properties and Application by using the transmutation map. Afify et al.(2015b) proposed the Exponentiated transmuted generalized Rayleigh distribution . Exponentiated transmuted Weibull distribution introduced by Ebraheim(2014). Tiensuwan and Pal Presented exponentiated transmuted modified Weibull distribution. The transmuted
79 F(x)
x
exponentiated generalized-G family of distributions is proposed by Yousof et al., (2015).Elbatal et al., (2013b) introduced the transmuted Quasi Lindley distribution. We introduce the exponentiated transmuted exponential (ETE) distribution ,in this paper. The rest of the search is organized as follows. In Section 2 we introduce exponentiated transmuted exponential distribution (ETED). The Limitfor ETED are given in Section 3. In Section 4 we Presented the Statistical the Order Statistics are introduced In Section 5. In Section 6 we presented R´enyi entropy. we demonstrate The parameters estimators ETED in Section 7.We present application in Section 8. Finally, The Conclusions are introduced in section 9.
2. Exponentiated Transmuted Exponential Distribution
Definition 2.1. A random variable X is said to have the transmuted distribution if its cdf is defined as:
(1)
where is the cdf of the base distribution. When = 0, we have the distribution of the base random variable.
Definition 2.2. A random variable X is said to have the exponentiated distribution if its cdf is defined as:
(2) The cdf of exponentiated transmuted exponential distribution with parameters
and λ is defined by:
(3) and its pdf is
(4)
where is a shape parameter, and are a scale parameters.
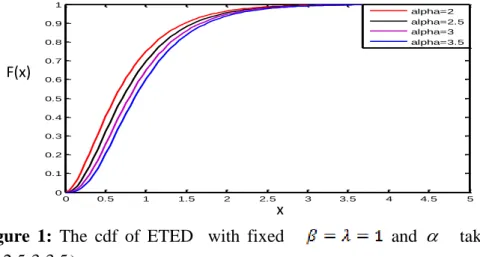
Figure 1: The cdf of ETED with fixed and take the values ( 2, 2.5, 3, 3.5 ). 0 0.5 1 1.5 2 2.5 3 3.5 4 4.5 5 0 0.1 0.2 0.3 0.4 0.5 0.6 0.7 0.8 0.9 1 alpha=2 alpha=2.5 alpha=3 alpha=3.5
80 x pdf
Figure 2: The pdf of ETED with fixed and take the values (2,2.5,3,3.5).
3. Limit of the density function and cumulative function:
The limit of pdf
(5) and
(6) The limit of cdf of ETED:
(7)
and (8)
4. Statistical Properties
We study statistical properties of the ETE distribution in this section.
4.1 Reliability function
The reliability function of ETE distribution is given by
(9) 0 0.5 1 1.5 2 2.5 3 3.5 4 4.5 5 0 0.1 0.2 0.3 0.4 0.5 0.6 0.7 0.8 0.9 1 alpha=2 alpha=2.5 alpha=3 alpha=3.5
81 R(x) x h(x) x
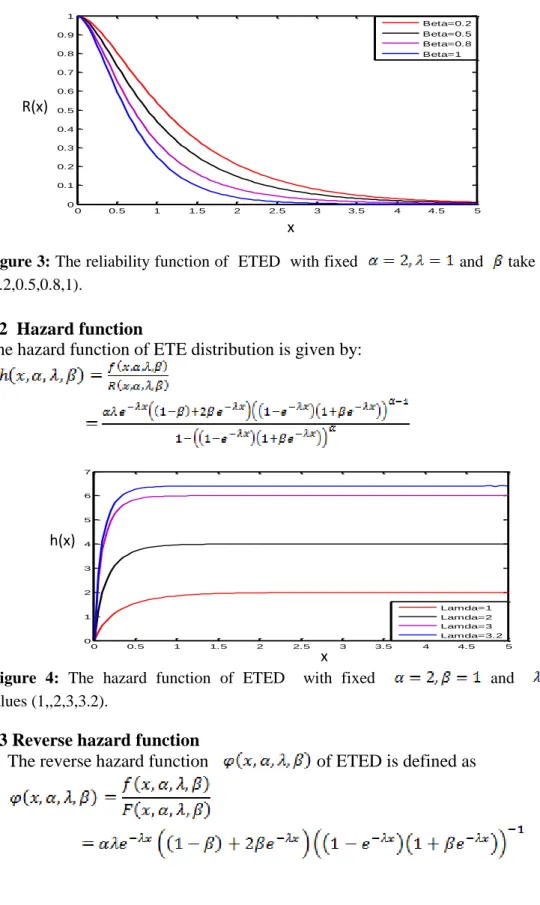
Figure 3: The reliability function of ETED with fixed and take the values
(0.2,0.5,0.8,1).
4.2 Hazard function
The hazard function of ETE distribution is given by:
(10)
Figure 4: The hazard function of ETED with fixed and take the values (1,,2,3,3.2).
4.3 Reverse hazardfunction
The reverse hazard function of ETED is defined as
(11) 0 0.5 1 1.5 2 2.5 3 3.5 4 4.5 5 0 0.1 0.2 0.3 0.4 0.5 0.6 0.7 0.8 0.9 1 Beta=0.2 Beta=0.5 Beta=0.8 Beta=1 0 0.5 1 1.5 2 2.5 3 3.5 4 4.5 5 0 1 2 3 4 5 6 7 Lamda=1 Lamda=2 Lamda=3 Lamda=3.2
82 (x) x H(x) x
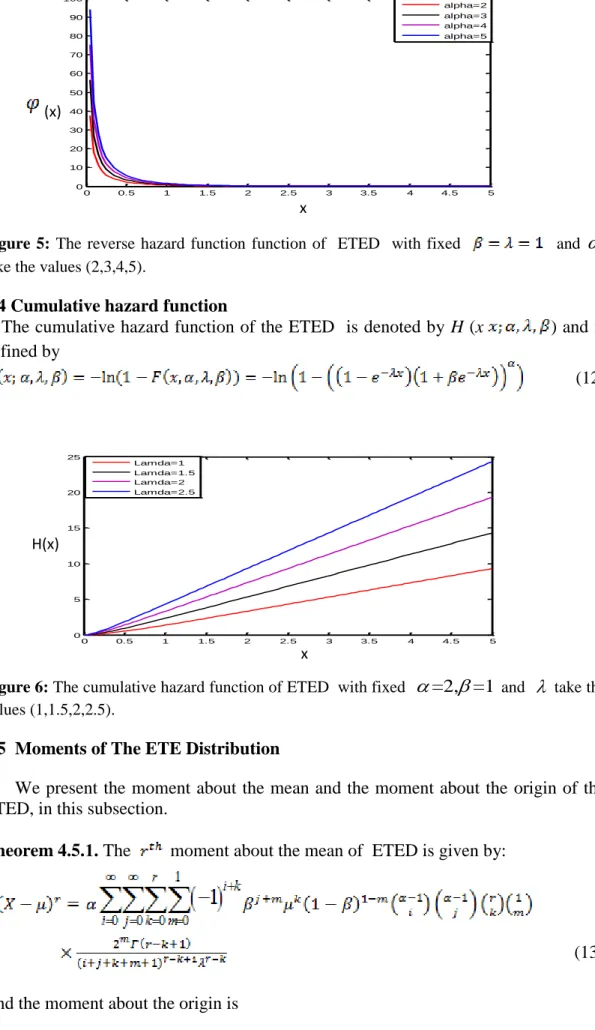
Figure 5: The reverse hazard function function of ETED with fixed and
take the values (2,3,4,5).
4.4 Cumulative hazard function
The cumulative hazard function of the ETED is denoted by H (x ) and is defined by
(12)
Figure 6: The cumulative hazard function of ETED with fixed =2, =1 and take the
values (1,1.5,2,2.5).
4.5 Moments of The ETE Distribution
We present the moment about the mean and the moment about the origin of the ETED, in this subsection.
Theorem 4.5.1. The moment about the meanof ETED is given by:
(13) and the moment about the origin is
0 0.5 1 1.5 2 2.5 3 3.5 4 4.5 5 0 10 20 30 40 50 60 70 80 90 100 alpha=2 alpha=3 alpha=4 alpha=5 0 0.5 1 1.5 2 2.5 3 3.5 4 4.5 5 0 5 10 15 20 25 Lamda=1 Lamda=1.5 Lamda=2 Lamda=2.5
83
r=1,2,3,…. (14)
Proof: Using equation (4),the moment is given by
(15) using the series expansion of , and (16)
(17)
and (18)
(19)
Applying (16) , (17) ,( 18)and (19) in (15) ,we get Hence Then If . Hence the moment about the origin is If r =1 (20) If r =2
84 (21) If r = 3 (22) If r =4 (23)
The Variance is given by
(24)
The Coefficient of Variation is given by
(25) The Coefficient of skewness is given by
85
The Coefficient of kurtosis is given by
(27)
4.6 Moment Generating Function of ETED
In this subsection, we present the moment generating function of ETED.
Theorem 4.6.2 . the moment generating function of ETE distribution is given by:
(28)
Proof: We start with the well-known definition of the moment generating function given by:
Hence
5. Order Statistics
Let be a random sample of size n from EEPD distribution with cdf and pdf given by (3) and (4) respectively ,where
.Let denote the order statistics obtained from this sample.The probability density function of is given by
86
(29) Since 0 < , for x > 0, we can use the binomial expansion of
given as follows:
(30)
applying (30) in(29) ,we get
(31)
6. R´enyi entropy
Entropy refers to the amount of uncertainty associated with a random variable. It is an important concept in many fields of science, especially theory of communication, physics and probability. The R´enyi entropy is defined by
(32)
Proposition 6.1. If X is random variable has a ETED, then, the R´enyi entropy is defined by: (33) Proof: (34) Hence
87
7. Maximum Likelihood Estimator
We determine the maximum likelihood estimates (MLE) of the parameters, in this section. Let be an i.i.d random of size n from a distribution that has the a pdf ,The joint density of the sample is, by independence, equal to the product of the marginal densities .
Then the Maximum Likelihood function (L) is The joint probability density function of the random sample and can be written as,
(35) The log-likelihood function for the vector of parameters can be written as,
(36) Then by take the partial derivative of with respect to and λ, respectively, we get:
(37)
(38)
(39) The solving of the equations 0, ,and , yields the maximum likelihood (ML) estimates of and λ as following
(40)
And the maximum likelihood estimate of and λ , can be obtained by numerical methods. Also when all parameters are unknown, the MLE of them can be obtained by the numerical methods.
88
8. Application
In this section, we present two applications to real data to illustrate the importance of the ETE distributionThe real data set represent the survival times of 121 patients with breast cancer obtained from a large hospital in a period from 1929 to 1938 (Lee, 1992). This data set has recently been studied by Muhammad et al. (2015). The data are: 0.3, 0.3, 4.0, 5.0, 5.6, 6.2, 6.3, 6.6, 6.8, 7.4, 7.5, 8.4, 8.4, 10.3,11.0, 11.8, 12.2, 12.3, 13.5, 14.4, 14.4, 14.8, 15.5, 15.7, 16.2, 16.3, 16.5, 16.8, 17.2, 17.3, 17.5,17.9, 19.8, 20.4, 20.9, 21.0, 21.0, 21.1, 23.0, 23.4, 23.6, 24.0, 24.0, 27.9, 28.2, 29.1, 30.0, 31.0,31.0, 32.0, 35.0, 35.0, 37.0, 37.0, 37.0, 38.0, 38.0, 38.0, 39.0, 39.0, 40.0, 40.0, 40.0, 41.0, 41.0,41.0, 42.0, 43.0, 43.0, 43.0, 44.0, 45.0, 45.0, 46.0, 46.0, 47.0, 48.0, 49.0, 51.0, 51.0, 51.0, 52.0,54.0, 55.0, 56.0, 57.0, 58.0, 59.0, 60.0, 60.0, 60.0, 61.0, 62.0, 65.0, 65.0, 67.0, 67.0, 68.0, 69.0,78.0, 80.0,83.0, 88.0, 89.0, 90.0, 93.0, 96.0, 103.0, 105.0, 109.0, 109.0, 111.0, 115.0, 117.0, 125.0,126.0, 127.0, 129.0, 129.0, 139.0, 154.0.
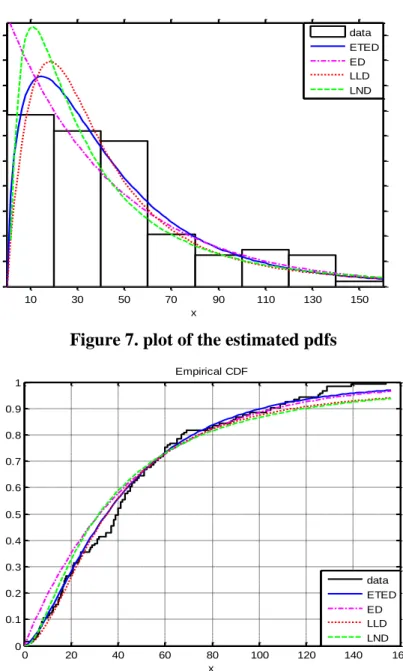
In the following, we compare ETE distribution with other three lifetime models lognormal distribution(LND), log-logistic distribution(LLD) and Exponential distribution(ED).
Table 2 provides the MLEs of the model parameters. The model selection is carried out using the AIC (Akaike information criterion), the BIC (Bayesian information criterion) and the CAIC (consistent Akaike information criteria):
AIC (41)
where denotes the log-likelihood function evaluated at the maximum likelihood estimates, q is the number of parameters, and n is the sample size.
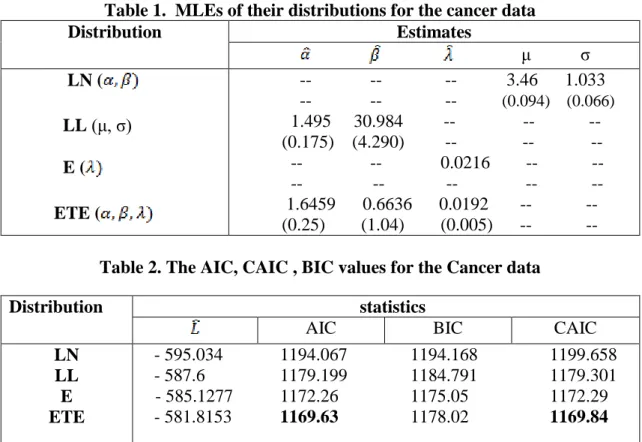
Table 1. MLEs of their distributions for the cancer data
Distribution Estimates μ σ LN ( LL (μ, σ) E ( ETE ( -- -- -- 3.46 1.033 -- -- -- (0.094) (0.066) 1.495 30.984 -- -- -- (0.175) (4.290) -- -- -- -- -- 0.0216 -- -- -- -- -- -- -- 1.6459 0.6636 0.0192 -- -- (0.25) (1.04) (0.005) -- --
Table 2. The AIC, CAIC , BIC values for the Cancer data
Distribution statistics
AIC BIC CAIC
LN LL E ETE - 595.034 1194.067 1194.168 1199.658 - 587.6 1179.199 1184.791 1179.301 - 585.1277 1172.26 1175.05 1172.29 - 581.8153 1169.63 1178.02 1169.84
89
We noted from Table 2 that ETED model shows lowest values of AIC ,BIC and CAIC among the fitted models: ETED, LND,LLD and ED , suggesting that the ETED shows the best fit, and therefore could be chosen as the best model.
Figure 7. plot of the estimated pdfs
Figure 8. plot of the estimated cdfs
9. Conclusions
In this research we presented the Exponentiated transmuted Exponential distribution. We investigate some of its properties. It is observed that the MLE of the unknown parameters can be obtained numerically.
0 20 40 60 80 100 120 140 160 0 0.1 0.2 0.3 0.4 0.5 0.6 0.7 0.8 0.9 1 x F( x ) Empirical CDF data ETED ED LLD LND 10 30 50 70 90 110 130 150 0 0.002 0.004 0.006 0.008 0.01 0.012 0.014 0.016 0.018 0.02 x p d fs data ETED ED LLD LND
90
References
Afify, A., Nofal, Z., Yousof, H., El Gebaly,Y. and Butt, N.(2015a). The transmuted Weibull Lomax distribution. Pak.j.stat.oper.res. Vo. XI. No.1,pp135-152.
Afify, A.Z.,Nofal, Z.M. and Ebraheim, A.E.D., (2015b). Exponentiated transmuted generalized Rayleigh Distribution. Pak.j.stat.oper.res. Vol. XI. No.1, pp115-134.
Cordeiro, G., Ortega, E. and Cunha, D. (2013a). The Exponentiated Generalized Class of distributions. Journal of Data Science 11, 1-27.
Ebraheim, A.E.N. (2014). Exponentiated transmuted Weibull distribution. International Scholarly and Scientific Research & Innovation, 8(6) ,903-911. Elbatal, I. and Elgarhy, M. (2013b). Transmuted Quasi Lindley distribution.
International Journal of Pure and Applied Sciences and Technology,18(2), 59-70.
Flaih, A., Elsalloukh, H., Mendi, E. and Milanova, M. (2012a). The Exponentiated Inverted Weibull Distribution. Applied Mathematics & Information Sciences 6, No.2, 167-171 .
Gupta, R. and Kundu, K. (2001). Exponentiated Exponential Family: An Alternative to Gamma and Weibull distributions. BiometricalJournal ,43 , 117–130 .
Hussian, M. (2014). Transmuted Exponentiated Gamma Distribution: A Generaliztion of the exponentiated gamma probability distribution. Applied Mathematical Sciences, Vol. 8, no. 27, 1297 – 1310.
Kundu, D. and Gupta, R.D. (2000). generalized exponential distribution. J. Statist. Comput. Simul., Vol. 00, pp. 1 – 22.
Abdul-Moniem. I.B. and Abdel-Hameed, H.F. (2012b). On Exponentiated Lomax
distribution. International Journal of Mathematical Archive,3(5), 2144-2150. Nadarajah, S. and Tahir, M.(2015). Parameter induction in continuous univariate
distributions.Anais da Academia Brasileira de Ciências, 87(2),539-568.
Nadarajah, S. (2005).exponentiated Beta distributions. Computers and Mathematics with Applications, 4g ,1029-1035.
Pal1, M. and Tiensuwan, M.(2015). Exponentiated transmuted Modified Weibull distribution.European Journal Of Pure And Applied Mathematics. Vol. 8, No. 1, 1-14.
Sarhan, A., Ahmad, A. and Alasbahi, I. (2012c). Exponentiated generalized linear exponential distribution. Applied Mathematical Modelling. pp1-12.
Yousof, M.H., Afify, A.Z., Alizadeh, M., Butt, N.S., Hamedani, G.G. and Ali, M.M. (2015). The transmuted exponentiated generalized-G Family of