California Community Colleges Chancellor’s Office
Jack Scott, Chancellor
Prepared by the Academic Affairs Division and the Office of Communications
California Community Colleges Chancellor’s Office
Distance Education Report
California Community Colleges
Chancellor’s Office
Distance Education
Distance Education
Introduction
The California Community Colleges serve more than 2.76 million students and is the largest system of higher education in the nation. To address the educational needs of this diverse student body, the community colleges offer courses through distance education (DE).
Distance education focuses on the design of
pedagogy, technology and instructional systems for students who are not physically present in the same location with the instructor. Title 5, section 55200, defines distance education as “instruction in which the instructor and student are separated by distance and interact through the assistance of communication technology.”
Distance education creates an educational exper-ience of equal qualitative value as a face-to-face course for the learner to best suit his or her needs in an increasingly demanding culture challenged by the traditional face-to-face classroom delivery mode. The California Community College 2010 “W” Student Survey data indicates that convenience is the number one reason why students take a course.
The first distance education report by the Chancellor’s Office was issued in January 2002. It recognized the extent to which DEwas offered in the community colleges and covered 1995-2000. Every two years, this report is updated to include data from the prior two fiscal years. The September 1, 2009 report submitted to the board of governors covered the development of DE through 2007-08. These reports are prepared in response to the BOG Procedure and Standing Order 409(b).
Table of Contents
Introduction Page 3
Background Page 5
Methodology Page 9
Key Findings Page 11
Student Authentication Page 37 Academic Integrity Page 39 Programs & Partnerships Page 43 Cost Analysis Methods Page 53 Legislative Analyst’s Report Page 59 Recommendations Page 63 Acknowledgments Page 65 Appendixes Page 67
This report, Distance Education, adds DE enrollment and completion rates for fiscal years 2008/09 and 2009/10. It also provides demographic data pertaining to the age, ethnicity, gender and disabilities of students enrolled in DE courses. In addition, it looks at issues
impacting DE course development and support, student authentication and academic integrity, programs and partnerships, cost factors and policy issues raised by a report on DE in public higher education in California by the Legislative Analyst’s Office (published in October 2010).
Distance Education
Background
From 1979 to 1994, the California Community Colleges provided students DE opportunities that were limited to courses transferable to baccalau- reate institutions. In 1994, due to the growing demand for distance education courses, new temporary regulations creating a pilot period of seven years were adopted.
In 1995/96 DE course sessions represented only 0.63 percent of all course sessions; today they have grown to represent 9.06 percent of all course sessions. They were established to allow the com-munity colleges to explore and develop education-al initiatives. Using advanced communication and computing technologies, they addressed student access issues related to geographical, cultural, or facility barriers. To help provide advice in this expanded instructional delivery method, the board of governors also established a distance education technical advisory committee to evaluate the status of DE in the system.
In January 2002 the report, A Seven Year Study of Distance Education in the California Community Colleges: 1994-2001, was presented to the board and summarized the system’s activities during this pilot period and focused on issues that were needed to support DE throughout the community colleges. The report also included information about student access, enrollment, course
completion, and student and faculty satisfaction with this instructional delivery mode.
Courses, Sections, and Sessions
Since all enrollment data are derived from the COMIS, this report contains enrollment data reported by Data Element Dictionary (DED) codes. For purposes of this report a distinction needs to be made between a course, course section, and course session. The DED definitions are as follows:
course is a unique offering by a college, which has a unique course outline that has been approved by a local college’s curriculum committee (e.g., Bio. 1: Principles of Biology).
course section is an individual course offering at the local college (e.g., Bio. 1–04, which would denote the fourth section of Bio. 1 being offered in a particular term).
course session represents a unique instructional occurrence within a course section. There are two types of course sessions identified in the DED.
Type ―A is the standard type of course session. Type ―C is a course session that is used to assign students from the primary course section to smaller class sizes (e.g., to schedule two or more laboratory course sessions for students in the same Bio. 1 lecture section, the college may offer two sections, Bio 1-04A and Bio 1-04B to allow for smaller laboratory class sizes for students from the same biology lecture course). In this report, a course session is roughly equivalent to a course section because a course session captures all student enrollments and presents a more precise count of course offerings.
In March 2002, the board of governors approved title 5 regulations to expand DE to credit non-transferable and noncredit courses. The board also directed continuance of the review and collection of DE data that began in 1994. These data, updated every two years, report on student access and success in all DE courses by the age, ethnicity, gender and type of disability of the students enrolled.
The 2002 regulatory changes also allow DE courses to be considered as equivalent to a regular course rather than solely as independent study for the purposes of computing full-time
equivalent student (FTES) apportionment.
Regulations regarding the standards and criteria for DE courses were revised in collaboration with the renamed Educational Technology Advisory Committee and Chancellor’s Office staff, and were approved by the board of governors in July 2007. In 2007, the regulations specifically addressed instructor contact and separate course approval. Regulations regarding DE
attendance accounting standards for labs and noncredit were also revised and approved by the board in June 2008.
Graph 1 compares the growth of DE sessions during the five-year period covered in this report. All COMIS data in this report is derived from DE course sessions. In this report, a course session is roughly equivalent to a course section because a course session captures all student
enrollments and presents a more precise count of course offerings throughout the system. Graph 1
DE continues to grow to include more academic programs being developed, more course sessions being taught, more students selecting this instructional delivery method, and more online student services being made available to all students.
In addition, new issues related to student retention and success, student authentication, and academic integrity continue to grow. The passage of the Federal Higher Education Opportunity Act of 2008 places new responsibilities on regional accrediting commissions to assure that colleges are providing quality distance education instructional services for students.
Distance Education
Methodology
Data referenced in this report came from a variety of sources:
COMIS
The Chancellor’s Office Management Information System (COMIS) was implemented in 1990 and seeks to collect data that can provide answers to fundamental questions related to the areas of students, faculty, staff, and courses. Colleges submit data to the Chancellor’s Office within 30 days at the end of each term.
TWO DISTANCE EDUCATION SURVEYS: Students and Programs
In January 2011 the Chancellor’s Office sent The California Community Colleges Chancellor's Office Distance Education “W” Survey for Fall 2010 to 50,000 students who dropped a DE course in the Fall 2010 term with a “W.” The survey asked for the reasons they took the course and why they dropped it. This survey is hereinafter referred to as The Chancellor’s Office 2010 “W” Student Survey.
In the spring of 2011 the Chancellor’s Office sent The California Community Colleges
Chancellor's Office 2010-11 Survey of Colleges' Distance Education Programs and Services to all 112 campus DE coordinators to gather information about a variety of DE programs and services including degrees and certificates, student authentication, and DE course development and support. This survey is hereinafter referred to as The Chancellor’s Office 2011 DE Program Survey.
Distance Education
Key Findings
This report highlights the California Community Colleges’ growth of both DE courses and student enrollment, the process of course development, accreditation policy modifications related to distance education, successful completion and retention rates, student
authentication, academic integrity, programs and partnerships, cost analysis methods of distance education, a report from the Legislative Analyst’s Office, recommendations, and appendixes.
Distance education has grown at a significant rate over the last five-years. It has nearly doubled in the number and percentage of course sessions. Likewise, the number of students taking DE courses has also nearly doubled. There are two types of distance education:
Synchronous Communication is direct communication, where all parties involved in the communication are present at the same time (an event). Examples include a telephone conversation, a company board meeting, a chat room event, and instant messaging. Asynchronous Communication does not require that all parties involved in the communication need to be present and available at the same time. Examples of this include email (the receiver does not have to be logged on when the sender sends the email message), discussion boards, which allow conversations to evolve and communities to develop over a period of time, and text messaging over cell phones.
Online instruction (asynchronous Internet) delivery is by the far the most widely used method of conducting DE because it offers students the greatest flexibility in taking courses. Almost half of the colleges offer degrees and certificates that can be obtained exclusively through distance education; some colleges offer over forty degrees and certificates. As colleges expand their DE offerings and align courses, the number of degrees and certificates entirely using distance education has grown.
The growth of DE programs has generated increased activity with the regional accrediting agency, the Accrediting Commission of Community and Junior Colleges (ACCJC), Western Association of Schools and Colleges (WASC), for “Substantive Change Proposals” related to
distance education. To help carry out this function and due to changes in the recently passed Higher Education Opportunity Act of 2008, ACCJC is modifying its policies.
Colleges continue to collaborate with each other to develop and support DE courses while working to improve methods of retaining students. Online services such as registration,
tutoring, library access, virtual faculty office hours, etc. reveal how the DE student services have improved as the information age continues to be a major influence in how colleges interact with students.
Student Access to Instruction: The Increase in DE Course Sessions from 2005 -2010
Noncredit is such a small part of distance education that this report will address primarily credit DE. In 2005/2006 there were seven noncredit course sessions offered via DE and in 2009/10, there were 74 sessions.
For DE credit sessions, in 2005/2006, campuses offered 21,407 DE credit sessions, representing 4.69 percent of total traditional education credit sessions. In 2009/2010, DE sessions increased by 93 percent to represent 9.06 percent of all educational sessions offered. Table 1 compares the number of DE and traditional course credit sessions offered and the percentage of the total course sessions.
Distance education sessions continued to grow in 2009/10 although at a slower rate when traditional course sessions were shrinking. This reduction of traditional sessions and the slowing of the growth of DE session can be attributed to the state’s budget crisis.
Table 1
Distance Education and Traditional Education Course Sessions
Fiscal Years Distance Education Traditional Education Percentage
2005-06 21,407 456,644 4.69%
2006-07 26,121 465,680 5.61%
2007-08 32,380 486,866 6.65%
2008-09 39,178 482,756 8.12%
2009-10 39,964 440,933 9.06%
Delivery Methods: The Impact of Internet Instruction from 2005 - 2010
There are 10 types of DE courses by delivery method in the COMIS Data Element Dictionary (DED). Appendix A defines them and shows the number of DE course sessions by delivery
method. This section discusses the growth of online instruction (asynchronous and synchronous Internet) as compared to other delivery methods.
There has been a significant shift in delivery methods based on the advent and expansion of Internet based communication technologies. In 1995-961 televised instruction accounted for 79
1
percent of all DE delivery methods but by 2009-10 it represented only 8 percent. Since 2002-032 all Internet-based instructional delivery methods have outpaced televised instruction as the predominant delivery mode for DE in the community colleges. In Appendix A, televised
instruction decreased by more than 28 percent over the five-year period, accounting for 2,958 course sessions in 2005/06 and 2,129 course sessions in 2009/10.
While television-based courses were declining, Internet-based courses were expanding. The total number of DE course sessions delivered over the Internet grew by nearly 112 percent over the five-year period from 17,191 in 2005/06 to 36,372 in 2009/10. In 2009-10 the significant majority of the Internet based courses were asynchronous Internet, which accounted for over 92 percent of all Internet type instruction. Asynchronous and synchronous Internet accounted for 33,529 and 2,131 DE course sessions respectively. Besides television, other technologies used to deliver instruction included correspondence and video conferencing. Graph 2 shows the relationship of online instruction to television and these other methods of DE instruction.
Graph 2
2
Enrollment by headcount from 2005-10
Table 2 shows the growth in unduplicated3 student headcount over the five-year report period. Student headcount in DE courses grew from 328,372 in 2005/06 to 649,518 in 2009/10, an increase of 11.07 percent.
Table 2
Total Student Headcount in All Distance Education and Traditional Education Course Sessions 2005-10
(unduplicated headcount) Fiscal Year Distance
Education Traditional Education Total Percent of Total Headcount
2005-06 328,372 2,630,207 2,958,579 12.48%
2006-07 392,355 2,694,149 3,086,504 14.56%
2007-08 483,884 2,810,572 3,294,456 17.22%
2008-09 611,689 2,923,137 3,534,826 20.93%
2009-10 649,518 2,758,831 3,408,349 23.54%
Enrollment Rates: Unduplicated Student Headcount Noticeable Trends from 2005-10
Table 3 and Graph 3 display an analysis of trends in the number of students enrolled in DE course sessions in comparison to students enrolled in traditional sessions. In the five -year period, there was an overall average enrollment growth rate of 1.10 percent in traditional education sessions compared to 15.48 percent in distance education sessions. In 2009-10, due to systemwide budget reductions resulting from the state fiscal crisis, there was a 5.96 percent decrease in enrollment in traditional sessions and a slowing in the growth of DE enrollment to 5.82 percent.
3
For the purposes of this report, total student headcount represents the total number of students that enrolled in at least one distance education course and unduplicated headcount means that a student is only counted one time when enrolling in one or more distance education courses.
Table 3
Total Student Headcount Trends in Distance Education and Traditional Education Course Sessions 2005-10
(Unduplicated headcount) Fiscal Year DE Traditional Headcount Annual Variance (+ or -) Percentage Change Headcount Annual Variance (+ or -) Percent age Change 2005-06 328,372 2,630,207 2006-07 392,355 63,983 16.31% 2,694,149 63,942 2.37% 2007-08 483,384 91,029 18.83% 2,810,572 116,423 4.14% 2008-09 611,689 128,305 20.98% 2,923,137 112,565 3.85% 2009-10 649,518 37,829 5.82% 2,758,831 -164,306 -5.96% Average Percent Change 15.48% 1.10%
Graph 3 shows the percent change from the 2005-06 base year headcount of 328,372 for DE sessions and 2,630,207 for traditional sessions.
Graph 34
4
Degrees and Certificates
This section discusses the growing number of degrees and certificates available through distance education. The colleges have developed robust educational programs offered completely through distance education. As referenced earlier in this report, in March 2011 The Chancellor’s Office 2011 DE Program Survey was sent to the system’s DE coordinators. One of the questions addressed degrees and certificates:
Q15 - “In 2009-10 did your college offer an AA or AS degree or a Certificate of Achievement program where the student could complete the program 100% through distance education5?”
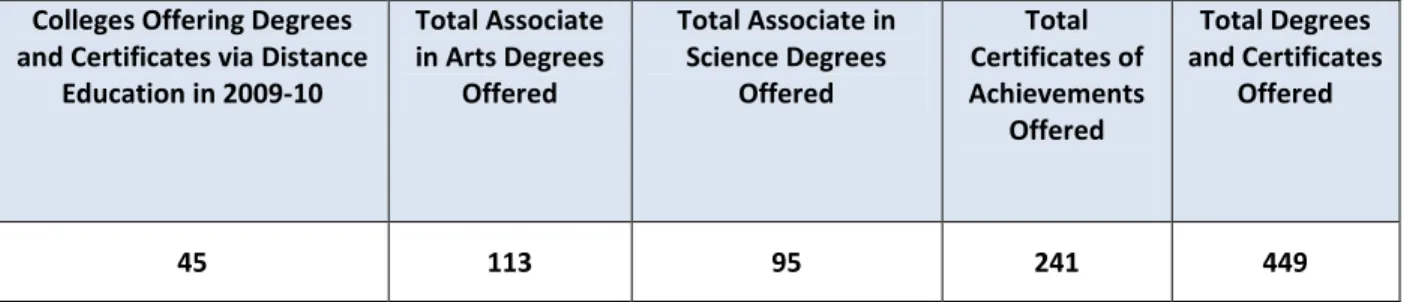
The answer is shown in Graph 4, where 40% of the colleges are offering degrees and certificates completely through distance education. There are a total of 449 associate in arts and associate in science degrees and/or certificates of achievements being offered by 45 colleges using distance education.
Graph 4
5
This does not mean exclusively online instruction the definition of 100% distance education used for this question can represent a mix of distance education delivery modalities that make up that 100%. Example: A degree or certificate program delivered 60% via online and 40% via TV broadcast with audio bridge would be 100% distance education. Please note that this represents the possibility of completing the degree via distance education.
Table 4 shows the number of degrees and certificates being offered by 45 colleges in the system.
Table 4
Degrees and Certificates Offered by the
California Community Colleges through Distance Education Colleges Offering Degrees
and Certificates via Distance Education in 2009-10 Total Associate in Arts Degrees Offered Total Associate in Science Degrees Offered Total Certificates of Achievements Offered Total Degrees and Certificates Offered 45 113 95 241 449
Modifications to Substantive Change and Distance Education Policies of the Accrediting Commission of Community and Junior Colleges
The Accrediting Commission for Community and Junior Colleges (ACCJC) Western Association of Schools and Colleges (WASC) is responsible for assuring that colleges meet the requirements of the Higher Education Opportunity Act of 2008 (see page 39) regarding distance education. At its January 2011 meeting the ACCJC considered two policy changes that will have an impact on California’s community colleges and their continued implementation and expansion of distance education. One is a change to its substantive change policy and the other is a change to its policy on distance education and correspondence education. Both of these changes are scheduled to be presented for action at the next regularly scheduled meeting in June 2011. There are seven changes the ACCJC considers substantive, of which one is “Change in Courses or Programs or their Mode of Delivery that Represents a Significant Departure from Current Practice”. Specific changes to this policy are located at the following URL:
http://www.accjc.org/wp-content/uploads/2010/09/Policy-on-Substantive-Change.pdf. The need to submit a substantive change proposal is triggered by the addition of courses that constitute 50% or more of a program offered through a mode of distance or electronic delivery.
Example: When an institution offers courses that make up 50% or more of the
credits required for a program through an instructional delivery that is new for the college such as on-line instruction it is required to submit a substantive change request to the Commission. Federal law mandates that accrediting agencies require institutions to obtain accreditor approval of a substantive change before the degree is granted at the institution.
Table 5 provides the number of community colleges and substantive change proposals that have been approved.
Table 5
ACCJC Approved Substantive Change Proposals for a Change in Mode of Instruction to Distance Education in 2008-09 and 2009-10
Academic Year Number of Colleges Submitting
Substantive Change Proposals
Number of Substantive Change Proposals Approved
2008-09 14 14
2009-10 18 19
Total 32 33
Source: www.accjc.org
The ACCJC also considered as a First Reading proposed changes to its policy on distance
education and correspondence education. Adopted in 2001, this policy has been edited and/or revised three times the most recent was in January 2010. Significant changes to its background statement and definitions for distance and correspondence education as well as minor
modifications to its policy and policy elements sections are proposed. Specific changes to this policy are located on the ACCJC website at the following URL: http://www.accjc.org/wp- content/uploads/2010/09/Policy-on-Distance-Education-and-on-Correspondence-Education1.pdf.
Course Development and Support
This section addresses the issues related to the development of DE courses/curriculum in the system. The development of a DE course requires instructional design that links learning objectives to specific activities and measurable outcomes. There are many models available to faculty and colleges; one is to pair a faculty member with an instructional designer so that each brings unique skills to the course-creation process to enhance content.
The Chancellor's Office 2011 DE Program Survey
In The Chancellor's Office 2011 DE Program Survey, DE coordinators rated 13 areas in the development of distance education courses. The top three areas rated as very important were faculty training (80%), curriculum development/approval (78.5%), and regular personal contact between student and faculty (77.5%). Interestingly, faculty compensation was the lowest rated area in the very important category with only 16.5%. It was also the highest rated in the not
important category, again with 16.5%. The detailed results of the responses to this survey question are displayed in Appendix B.
Available Resources
The coordinators were also asked to rank twelve resources that were related to course
development. Graph 5 displays the resources. The coordinators were specifically asked to rank the most common method of developing distance education courses and curriculum to the least common method. The resource ranked number one is the faculty’s own initiative at 14 percent. All courses are generally developed by faculty and the development and growth of DE courses are also being fueled by individual faculty interest. This is followed at 13 percent by training being provided by the college staff.
Graph 5
Inter-College Collaborations
In the report “The Master Plan at 50: Using Distance Education to Increase College Access and Efficiency,”released in October 2010, the Legislative Analyst’s Office recommended more collaboration between California colleges and universities in the development of DE courses. Indeed, the colleges are collaborating in a wide variety of methods.
In the Chancellor's Office 2011 DE Program Survey,an average of 42.6 percent of the DE coordinators surveyed responded in March 2011 they have shared costs, materials, and faculty development activities. Table 6 displays the responses the DE coordinators provided to the question, “Has your college collaborated with other colleges to develop, teach, or deliver distance education courses in any of the following areas?”
Table 6
Inter-College Collaborations in DE Course Development Yes No Total
Collaborated on curriculum development 43.6%
48 56.4% 62 100% 110 Used faculty from two or more colleges to teach a course at two or
more colleges 23.6% 26 76.4% 84 100% 110
Shared equipment or facilities to teach a course at two or more
colleges 31.5% 35 68.5% 76 100% 111
Shared course materials 47.3%
52 52.7% 58 100% 110 Shared staff development activities between two or more colleges 55.0%
61 45.0% 50 100% 111 Collaborated on distance education program development 44.0%
48 56.0% 61 100% 109
Examples of inter-college collaborations include:
Joint grants between colleges that has allowed for staff development between two colleges.
An engineering education program – where three colleges are offering a summer workshop on distance education strategies for engineering students.
College’s instructional technologists participating in Blackboard 9 training at a local California State University campus.
A Great Teacher’s retreat on teaching English online and sharing pedagogy teaching methods using Etudes.
Faculty – Student Interaction
Significant faculty-student interaction is not only a requirement by title 5 of the California Code of Regulations for distance education, it is also a foundation of quality instruction, academic integrity, and student authentication.
In The Chancellor’s Office 2011 DE Program Survey, DE coordinators were asked a question that addressed the most commonly used communications methods of interacting with students by faculty. On a scale of 1 to 5, with 5 being the most common use, they were asked to rate eighteen methods of communications they believed DE faculty used the most.
The two highest rated areas were online discussion boards (78.8%) and e-mailing (77.5%). Afterward, there was a significant drop off to third and fourth, class chat room (11.4%) and video conferencing with students (10.1%). Not surprisingly, the lowest form of interacting with students was meeting face-to-face on campus (1.3%). The full results of the responses to the question are displayed in Appendix C.
Online Student Services
When colleges began to expand the delivery of DE instruction, they were presented with the challenge of teaching at a distance and being able to offer students the same needed support and library services as if they were on a college campus. For more than a century, the higher education model had remained relatively stable. But, with the growth of the information age and globalization along with changing demographics, technology is driving today's trends in student services. Colleges are creating innovative ways to reach their distance learners with student support.
In The Chancellor’s Office 2011 DE Program Survey, DE coordinators were asked to work with their student services professionals to identify if 30 student services were offered via the Internet, telephone or on campus. They were asked to also identify if the services were offered only on campus or not at all, as well as if the information available was static or interactive. The full summary of their responses can be viewed in Appendix D.
The following is a list of the seven communication areas: Service or program is offered only on-campus.
Offered on-campus and through other communication technologies. Information available via static web page posting.
Student can request or submit information to program or service via an interactive web page.
Student can obtain information via the telephone through prerecorded message. Student can request or submit information to program or service using the telephone. Not offered.
The results of the two highest-rated student services within each communication type were: • Service or program is offered only on-campus - Health Services (40.7%) and Assessment
and Testing (Diagnostic, Placement, & Academic) (39.1%).
• Offered on-campus and through other communication technologies - Student to Student Communications (48.2%) and Faculty to Student Communications (39.8%).
• Information available via static web page posting - Course/Program Catalog (40.7%) and Schedule of Classes (36.6%).
• Student can request or submit information to program or service via an interactive web page- Registration (30.2%) and Student Accounts (30.1%).
• Student can obtain information via the telephone through prerecorded message- College to Student Communications (9.6%) and Admissions (7.2%).
• Student can request or submit information to program or service using the telephone - Academic Advising and Counseling (13.6%) and Admissions (12.9%).
• “Not offered” - E-portfolios (60.7%) and Financial Planning (Budgeting, Banking, Loan & Credit Card Management) (42.2%).
Successful Enrollment and Completion Rates 2005 - 2010
A gap exists in both successful completion6 and retention7 rates between DE and traditional instruction. Successful completion of a course is defined as performance with a grade of “C” or better. Students receiving a grade of “D” or lower were not counted as successful completions. Table 7 displays the comparison of success rates between DE students and traditional
education students in credit courses. The number of students in Table 7 is a total student duplicated headcount which means that the students are counted more than once. If they enrolled in two DE courses they were counted two times, etc. The distance education success rate rose slightly in 2009/10, from 53 percent to 57 percent.
6
The success rate as defined by COMIS is:
Numerator: Number of enrollments with A,B,C,CR,P
Denominator: Number of enrollments with A,B,C,D,F*,CR,NC,W,I*,P,NP,DR 7
The retention rate as defined by COMIS is:
Numerator: Number of enrollments with A,B,C,D,F*,CR,NC,I*,P,NP Denominator: Number of enrollments with A,B,C,D,F*,CR,NC,W,I*,P,NP,DR
This success rate compares to an increase from 64 percent in 2005-06 to 67 percent for
traditional education students. The gap for the success rate between traditional instruction and DE instruction closed from 11 percent to 10 percent. The success rate for DE courses grew by 2 percentage points in one year from 2008-09 to 2009-10, while the success rate in traditional courses remained the same.
Table 7
Success Rates for Credit Distance Education and Traditional Education Course Sessions
(Duplicated Headcount) Credit Distance Education Sessions
Student Outcome 2005-06 2006-07 2007-08 2008-09 2009-10 Completed 319,541 392,145 500,142 649,997 696,088 Not Completed 289,005 346,551 425,762 525,136 524,723 Total 608,546 738,696 925,904 1,175,133 1,220,811 Success Rate 53% 53% 54% 55% 57%
Credit Traditional Education Sessions
Student Outcome 2005-06 2006-07 2007-08 2008-09 2009-10
Completed 5,390,916 5,469,554 5,725,712 6,208,474 6,264,182
Not Completed 3,024,343 2,963,846 3,023,945 3,105,924 3,024,017
Total 8,415,259 8,433,400 8,749,657 9,314,398 9,288,199
Success Rate 64% 65% 65% 67% 67%
Enrollment and Completion Rates by Age
Appendix E compares student success rates by age in DE credit course sessions. The categories are: less than age 18; 18–19; 20–24, 25-29, 30–34, 35–39, 40–49, and 50 and older. Data is also shown for students who declined to report their ages. Success rates remained constant from 2005-06 through 2007-08, but in 2008-09 and 2009-10 success rates improved significantly. The largest increase is in the 20-24 year-old group which increased by five percentage points. The smallest growth was in the 40-49 year-old category of only 2 percentage points. Even this growth occurred in the last two years after remaining constant for the first three years of the five-year period. The only area that had a decrease in the rate of student success in DE courses was the unknown area dropping from 58 percent in 2005-06 to 54 percent in 2009-10.
This success rate can be attributed to better instructional design and increased familiarity with distance education instruction by students. As more students took DE courses their ability to perform in the new delivery method improved.
Distance education courses are taken predominantly by young people. Graph 6 describes the enrollment by age for 2009-10. The largest number of students taking DE courses was in the 20-24 age group growing from 216,219 in 2005-06 to 428,234 in 2009-10. The age categories 18-19 and 25-29 were tied for the second largest areas with both representing 17 percent each of the total enrollment in 2009-10. These three categories represent 69 percent of all students taking DE courses in 2009-10, an indication that a significant number of DE students are under 30 years of age.
Graph 6
Enrollment and Completion Rates by Ethnicity
Appendix F compares success rates by ethnicity. In the five-year period following a similar pattern as age success rates remained constant the first three years of the period and increase significantly in the last two years. The largest increase was for Filipino students improving by 7 percentage points from 50 percent to 57 percent. The smallest success growth was in the two or more races category where after posting increases in the first three years, from 50 percent to 52 percent, it decreased by 4 percentage points in the fourth year before improving by two percentage points in 2009-10 to end up at 50 percent, the same as 2005-06.
Graph 7 describes the enrollment in 2009-10 by ethnicity. The largest category of students is White students accounting for over 38 percent of the students taking DE courses in 2009-10. This category grew by over 67 percent from 277,980 students in 2005-06. The next largest category is Hispanic students representing over 23 percent and growing by over 136 percent from 119,239 in 2005-06 to 282,322 in 2009-10.
Enrollment and Completion Rates by Gender
Graph 8 shows more females take DE courses than males at 61 percent compared to 38 percent.Table 8 compares success rates by gender. The success rate between males and females improved overall by 3 percent; females performed slightly better than males during this time period, maintaining a 2 percent gap.
Graph 8
Table 8
Student Enrollment and Completion Rate by Gender in Credit Course Sessions
(duplicated headcount)
Gender Student Outcome 2005-06 2006-07 2007-08 2008-09 2009-10
Female Completed 200,641 244,575 305,512 394,200 419,447 Not Completed 179,232 214,495 264,494 328,115 323,267 Total 379,873 459,070 570,006 722,315 742,714 Rate of completion 53% 53% 54% 55% 56% Male Completed 115,375 143,009 183,338 239,059 252,644 Not Completed 109,679 132,349 166,402 203,055 213,979 Total 225,054 275,358 349,740 442,114 466,623 Rate of completion 51% 52% 52% 54% 54% Unknown Completed 1,987 2,380 3,434 6,412 6,746 Not Completed 1,632 1,888 2,724 4,292 4,728 Total 3,619 4,268 6,158 10,704 11,474
Student Enrollment and Completion Rate by Gender in Credit Course Sessions
(duplicated headcount)
Gender Student Outcome 2005-06 2006-07 2007-08 2008-09 2009-10
Rate of completion 55% 56% 56% 60% 59%
Enrollment and Completion Rates by Disability
There are nine categories of disabilities that are recorded in COMIS data:
acquired brain injury
developmentally delayed learner
hearing impaired
learning disabled
mobility impaired
other disability
psychological disability
speech/language impaired and visually impaired
Appendix G compares success rates of students with disabilities in DE course sessions. There was significant improvement in success rates for students who are developmentally delayed learners (+12 percent), from 35 percent to 47 percent over the five-year period. There was a slight decline in rates for students with acquired brain injury (-1 percent) from 2008-09 to 2009-10 as well as for speech/language impaired (-2 percent) during the same period. The latter dropped 10 percentage points from 2005-06 to 2006-07 before rebounding in 2008-09 to 54 percent. Speech/language impaired has demonstrated the most volatility among all disabilities. There was a significant decline in success rates for students who are visually impaired (-3
percent) in the first three years but these students have improved 5 percentage points since the last reporting year of 2007-08. This may be an outcome of improved services from the colleges in providing accommodations such as speech recognition, audio content and other adaptive learning tools.
Graph 9 compares two disabilities and the very different outcomes they have experienced over the three year period. The two areas are DEVELOPMENTALLY DELAYED LEARNER and
SPEECH/LANGUAGE IMPAIRED, who demonstrate the greatest growth and the most volatile categories respectively.
Graph 9
College Retention Efforts 2005 – 2010
In the previous section we discussed the following successful completion rates: overall, age, gender, ethnicity, and disability. This section addresses the DE retention rate, which is when a student gets a “W” in the course. Students who drop a DE or traditional course with a “W” grade are considered not to have been retained. Colleges have developed a variety of approaches to improving retention in DE courses ranging from institutional data mining to instructional redesign.
The focus in the early years of DE implementation was on growth. In the last five-years, more attention has been devoted to retaining students and closing the retention gap. Improving the rate of retention can improve the fiscal impact of DE courses. As the number of students taking DE courses continues to grow over the next five-years the importance of closing this gap must become a priority of colleges.
Graph 10 compares the traditional retention rate to the DE retention rate. There is an average retention gap between DE and traditional instruction of 6.96% over the five-year period. In 2009-10 the DE retention rate was at its highest (78.05%) and at its lowest (76.29%) in 2007-08. Face-to-face (FTF) retention rates have averaged 84.08. The FTF rate was also at its highest during 2009-10 (85.11%) and at its lowest (83.49%) in 2007-08. This graph displays that the rates have generally mirrored each other. When one falls so does the other, and when one raises the other does also.
Graph 10
A strong contribution to student retention appears to be a positive student-faculty relationship. Establishing direct contact with students and making them aware of the requirements of a DE course is essential. Successful instructors keep their students engaged through frequent e-mails, prompt responses, regular hours during which they can be contacted, and adding personal touches such as photos and graphics to lessons.
The Center for Community College Student Engagement (CCCSE)8 conducts a national survey of 719 colleges in 49 states that measures five categories linked to student engagement: academic challenge, active and collaborative learning, student-faculty interaction, student effort and support for learners.
Results from this survey help colleges focus on good educational practice — defined as practice that promotes high levels of student learning and retention — and identify areas in which community colleges can improve their programs and services for students. The CCCSE survey results show that colleges are expanding their strategies in the instructional design of DE courses that can lead to improved retention.
DE administrators are also now requiring instructors to have a plan to incorporate retention strategies into their class and encourage more student participation in study groups,
collaborative projects, etc. Many instructors are given the power to make flexible deadlines for students struggling to balance their studies with other commitments. This enables the
instructor to lessen some of the burden the students feel, and hopefully keep them enrolled in the class.
8
CCCSE is affiliated with the University of Texas, College of Education, Department of Educational Administration, Community College Leadership Program, www.cccse.org
Other retention strategies include:
an advisor assigned to work with DE students
analysis of data provided by institutional researcher as part of program review process a CTE counselor is in the online course with students
early assessments embedded tutors evaluative surveys
faculty contacting students faculty training
Human Presence Design9
instructor contacts student when logins have not taken place mandatory regular student contact
In The Chancellor’s Office 2011 DE Program Survey, DE coordinators were asked to identify their student retention efforts. The six strategies are shown on Graph 11. Faculty contacting students was the method most selected, which is consistent with other observations.
9
Human Presence Design is the practice of incorporating video and audio of the instructor teaching an online course and therefore increasing interaction between faculty and student which increases and enhances engagement, comfort and, eventually, retention. Dr. Doug Hersh from Santa Barbara City College has pioneered this approach and has demonstrated the effectiveness of this design through research conducted in completing his dissertation in 2009. His research demonstrated that students feel more satisfied in their online courses when they feel engaged through human presence design by finding intrinsic satisfaction in their human presence courses and complete them at higher rates and with higher levels of academic success. His research demonstrates that when students are able to see the face of the instructor who is guiding them through a course, they are more likely to trust that professor, and they feel more invested in the course which translates into improved retention rates.
Graph 11
The Chancellor’s Office 2010 “W” Student Survey: Why Students Take and Drop DE Courses
As stated earlier, the average retention gap between DE and traditional instruction over the last five-years is 6.69%. The Chancellor’s Office Management Information System (COMIS) can calculate the retention rate; however, there was no systemwide information about why
students withdrew from distance education courses.
In an effort to learn more about the why, in December 2010 the Chancellor’s Office invited colleges to participate in a survey. Fifty-six colleges responded and in January of 2011 the Chancellor’s Office sent a survey to over 50,000 unduplicated headcount students who
withdrew from at least one distance education course between the 20% and 75% date stamps of the Fall 2010 term. A list of participating colleges can be found in Appendix H.
The Chancellor’s Office 2010 “W” Student Survey was based almost exclusively on the
Fredericks Community College (FCC) of Maryland’s 2007 “”W” Survey of Online Students study for the terms of Winter 2006 and Spring 2007. The FCC study results are based on 100
telephone interviews from a sample of 356 students who withdrew from online courses. It also tested the hypothesis that there is a statistically significant overlap between the reasons why the course is taken online to why the course is dropped.
The Chancellor’s Office 2010 “W” Student Survey had several differences from the FCC “W” Survey:
It was conducted electronically as opposed to telephone interviews.
It included all types of distance education delivery formats as opposed to only online distance education.
The sample population was significantly larger in students contacted and responses received.
Less than 20% of the FCC survey questions were eliminated, added, or modified to reflect the method of new delivery (electronic) and other differences between priorities and regions.
The purpose of The Chancellor’s Office 2010 “W” Student Survey was to gather information about why students withdraw from distance education courses, to test the hypothesis of the FCC“W” Survey, and to compare the results between the two surveys.
The Chancellor’s Office 2010 “W” Student Survey established a baseline of systemwide information, which will identify student interventions that can effectively close the retention gap. Increased student retention equates to improved student success and degree completions.
The survey contained 16 questions in five areas related to why a student withdrew from a distance education course. Students were asked to provide their opinions and to select from a range of options to questions in the various areas of the survey. The five areas and the number of questions in each area are identified below:
Student identification Information (3 questions)
Preliminary distance education questions (4 questions)
Reasons why the student enrolled in the distance education course(s) (3 questions) Reasons why the student dropped the distance education course(s) (3 questions) and Future distance education use and the student’s advice to others and the college (3 questions)
The survey was electronically sent to the e-mail addresses of all the students in the 56 participating colleges (see Appendix H) who enrolled in a distance education course and
withdrew from the course in the Fall 2010 term. The survey tool used to deploy the survey was SurveyGizmo, a third party survey vendor that offers a secure encrypted database collection and storage service.
The data was aggregated statewide using the 56 colleges out of 112 in the system. Participating colleges received their data with student identifier information for further use in local research efforts. There were a total of 11,475 responses received, 1,969 partial, and 9,506 complete. The required statistically valid number of responses for a 99% confidence index, with 50%
prevalence rate and 2% error rate was 3,380. The responses were 300% over what was minimally required.
The reasons why students take DE courses can be summarized in one word: convenience. When asked to rate 13 reasons as very important, somewhat important, or not important at all, students selected:
1. My work schedule is heavy and a distance education course is more convenient (57.6%); 2. Personal circumstances (family, health, etc) made a distance education class more
convenient (55.5%)
3. I had a good experience with a distance education course before. (44.1%).
When asked to select the most important reason from among the 13,students selected No. 1, above, at 37.6% and No. 2 at 19.2%. Graphs 12 -14 display the responses to questions from The Chancellor’s Office 2010 “W” Student Survey.
Graph 12
Primary Reasons for taking DE Courses
Students were also asked why they dropped DE courses and given a list of 20 reasons to rate as very important, somewhat important, and not important. The top three reasons given were:
1. I had personal problems (family, health, job, childcare, etc) (39.9%) 2. I could not handle the combined study plus work responsibilities (29.9%) 3. I got behind and it was hard to catch up (29.6%)
When asked to select the primary reason from among the 20 reasons, students again chose the top two reasons from above at 22.2% and 12.8 % respectively.
Graph 13, below, from The Chancellor’s Office 2010 “W” Student Survey displays the responses. Graph 13
Primary Reasons for dropping DE courses:
Students were asked if they were likely to take another DE course in the future. Graph 14, on the next page, from The Chancellor’s Office 2010 “W” Student Survey, displays the responses.
Distance Education
Student Authentication
Student authentication in distance education has been an issue of interest to federal policymakers for several years.
The growth in enrollments and in the number of educational providers of online learning fueled concerns about institutions verifying the identity of students throughout the cycle of an online course: registration, participation, assessment, academic credit. Passage of the Higher Education Opportunity Act of 2008, followed by federal rulemaking, resulted in new regulations.
One regulation required accrediting agencies to assure distance and correspondence education programs have processes in place to verify student identity.There are three authentication approaches stipulated in the new federal guidelines:
1. Secure credentialing/login and password
2. Proctoring
3. Technology authentication systems The issue is complex and frequently
misrepresented. Among many e-learning professionals, it seems unfairly aimed only at online education when similar concerns of identity falsification could apply in traditional higher education settings. The policy and regulatory conversations concerning identity authentication, originally focused on
academic dishonesty, now encompass the
serious problem of financial aid fraud, as reported in some high-profile cases.
Virtually every community college is using a DE Course Management System (CMS) that meets the first criteria identified above for secure credentialing/login and password. However, the
Higher Education Opportunity Act of 2008 Regulation Impacting Student Authentication
602.17 Application of standards in reaching an accreditation decision.
(g) Requires institutions that offer distance education or correspondence education to have processes in place through which the institution establishes that the student who registers in a distance education or correspondence education course or program is the same student who participates in and completes the course or program and receives the academic credit. The agency meets this requirement if it --
(1) Requires institutions to verify the identity of a student who participates in class or coursework by using, at the option of the institution, methods such as --
(i) A secure login and pass code; (ii) proctored examinations; and (iii) New or other technologies and practices that are effective in verifying student identification;
(2) Makes clear in writing that institutions must use processes that protect student privacy and notify students of projected additional student charges associated with verification of student identity, if any, at the time of registration or
regulation guidelines place an expectation that colleges will continue to look at future technological solutions. While colleges are for the most part compliant with the regulations, few have taken formal positions on student authentication.
As depicted in Graph 15 when campus DE coordinators were surveyed in March 2011 and asked, “Does your district have a board of trustees approved student authentication policy?” Eighty-seven percent responded no, they did not. More colleges have indicated they will be developing such a policy. This is expected due to the changes in the distance education policy definition at the regional accrediting agencies.
In Graph 15, the 87 percent is misleading because this is a new requirement and colleges are beginning to take these policies to their boards of trustees for review and adoption. It is fully expected that most if not all colleges will have such a policy in place within a year.
Graph 15
Distance Education
Academic Integrity
The issue of academic integrity is broader than distance education and is defined as the moral code or ethical policy of academia. This includes values such as not cheating or committing plagiarism, maintenance of academic standards, and honesty and rigor in research and academic publishing.
Academic integrity is a fundamental value of teaching, learning and scholarship. According to the Center for Academic Integrity at Clemson University, there is growing evidence that students are cheating and plagiarizing in record numbers in both face-to face and distance education courses.
The issue of academic integrity is especially highlighted in distance education because of the perception that it is easy to cheat or have someone else complete the work when the student is at a distance. This issue is therefore tied to student authentication but is addressed in this report separately because it is an issue that impacts both areas.
Academic integrity is essential to the success of the mission of the California Community Colleges. It provides a foundation for responsible conduct in our students’ lives after
graduation. It can be difficult to translate values, even widely-shared values, into action—but action is needed now to promote academic integrity on our campuses in general and in
distance education in particular. Researchers agree that rates of cheating among American high school and college students are high and increasing. The issue was a topic discussed at length in the federal rulemaking process associated with the passage of the HEOA of 2008.
Appendix I is a list of Best Practice Strategies to Promote Academic Integrity in Online
Education, developed by partnership of WCET, the Instructional Technology Council (ITC), and the University of Texas TeleCampus. This list is based on “Institutional Policies/Practices and Course Design Strategies to Promote Academic Integrity in Online Education,” produced by WCET in February 2009 and updated in April 2009. In May 2009, the Instructional Technology Council surveyed its membership to invite feedback and additional strategies to enhance the WCET work.
The strategies are grouped into five categories: Institutional Context and Commitment Curriculum and Instruction
Faculty Support Student Support
While not specific to distance education, the Academic Senate for the California Community Colleges (Academic Senate) has demonstrated significant leadership in the area of academic integrity through the adoption of eight resolutions on the topic and the development and publication of the paper, Promoting and Sustaining an Institutional Climate of Academic Integrity, by its Educational Policies Committee in the spring of 2007.
This Academic Senate paper is in response to two resolutions from the Fall 2005 Plenary Session concerning academic dishonesty:
Resolution, 14.02, "Student Cheating," sought clarification on a System Office legal position that limited the ability of local faculty to fail a student for a single incident of academic dishonesty.
Resolution 14.01, "Student Academic Dishonesty and Grading," required the Academic Senate to investigate faculty legal and professional rights and obligations with regards to dealing with academic dishonesty, including options for grading, disciplinary action, definitions of academic dishonesty, a statement of best practices, and an explanation of student rights.
The paper discusses the need for a culture of academic integrity that enriches the educational experience of students and faculty and, indeed, all individuals associated with the college as employees or community members. The paper recommends that colleges involve all
constituent groups, particularly student leaders in developing and promoting policies and procedures supportive of a climate of academic integrity. Students have key responsibilities and protections provided by Title 5 51023.7 and have the potential to raise awareness throughout an institution concerning academic integrity. The paper includes examples of policies and procedures that have been adopted at several colleges. Central to all discussions of academic integrity is the importance of due process and the protection of student rights.
Suggestions for promoting a climate of academic integrity are provided, along with examples of policies are applied to such issues as test taking, technology, distance education, Internet use, group work, and maintaining the integrity of graded assignments. Emphasis is placed on the roles of classroom faculty, library services, counseling, and the need to institute mandates for information competency as a means of creating and sustaining a culture of academic integrity. The Promoting and Sustaining an Institutional Climate of Academic Integrity paper is located at the following URL: http://www.asccc.org/node/175013.
The Academic Senate has adopted eight resolutions addressing the issue of academic integrity: Fall 2005, 14.02 - Student Cheating
Fall 2005, 14.01 - Student Academic Dishonesty and Grading Spring 2007, 19.02 - Adoption of Academic Integrity Paper
Spring 2007, 19.03 - Resolution to Amend Adoption of the Academic Integrity Paper Spring 2008, 14.03 - Academic Integrity
Fall 2008, 02.02 - Academic Integrity and the Higher Education Reauthorization Act of 2008
Fall 2008, 13.03 - Academic Integrity Resource Library Fall 2008, 14.01 - Academic Dishonesty
Distance Education
Programs and Partnerships
This section addresses the various programs and partnerships that the Chancellor’s Office and colleges have to support DE implementation in the system. It discusses in detail the following areas, state authorization, California Virtual Campus, @ONE, Educational Technology Advisory Committee (ETAC), High Tech Center Training Unit, Open Educational Resource (OER)
Initiatives, Affordable Content Initiatives, Distance Education Coordinators, CCCConfer, and 3CMedia Solutions.
State Authorization
New federal regulations may require the California Community Colleges to register or apply in other states and seek their approval to offer instruction in their state to students enrolled in DE courses and programs. This requirement can be triggered by a number of factors that currently vary from state to state. As a result of the passage of the HEOA of 2008 and the federal rule making process, on October 29, 2010 the U.S. Department of Education released the following new regulation for higher education institutions as “§ 600.9(c) State authorization:”
“If an institution is offering postsecondary education through distance or
correspondence education to students in a State in which it is not physically located or in which it is otherwise subject to State jurisdiction as determined by the State, the institution must meet any State requirements for it to be legally offering
postsecondary distance or correspondence education in that State. An institution must be able to document to the Secretary the State's approval upon request.”
Institutions are expected to comply in each state in which they “operate” by July 1, 2012. U.S. Department of Education officials informed colleges through a second “Dear Colleague” letter on April 20, 2011 that institutions possessing proof that they are applying in a state by July 1, 2012 will be considered as “good faith” that the institution is in compliance for the 2012-2013 year.
Historically, the regulation of education in the United States has been the province of the individual states, and over time every state has established laws and rules governing
institutions operating within their boundaries. The fundamental premise of this regulation has been the concept of “physical presence” – in order to be subject to regulation by a state an institution had to be located in that state.
First, most states consider the conduct of “instructional” activities the appropriate trigger for state oversight. However, the term “instructional” abides a multitude of definitions, from the aggregation of learners in “electronic classrooms” to individual students interacting with the institution via the Internet, and in a number of states there is no definition at all, the
application of the term is a matter of specific circumstances.
Second, some agencies consider whether an institution is “operating in their state. Again, the term “operating” is differently defined, and again in many cases not defined at all. Finally, a substantial plurality of states consider as part of their determining whether to assert
jurisdiction, the degree to which an institution “directly targets” their residents.
What is most apparent is the lack of consistency among the states in terms of how they view the regulation of distance education. Some states have established rigorous criteria to
determine when an institution is engaged in sufficient activity within its borders to mandate an assertion of its regulatory authority. At the other extreme are states which have taken the position that the mere act of enrolling their citizens in a distance education program – without any further institutional contact with the state – is sufficient to require that institution to seek and secure state authorization. In between lays a multitude of combinations and permutations. To assist institutions in finding and complying with these regulations, the WICHE Cooperative for Educational Technologies, Southern Regional Education Board, American Distance Education Consortium, and the University of Wyoming formed a partnership and produced and released on March 17, 2011 the document, State Approval Regulations for Distance Education: A Starter List.
Appendix J is a chart of the states and their related requirements to seek approval to offer DE courses and programs in respective state. This list is in flux and can and is expected to change over time. The California Community Colleges will need to look at their enrollments and determine where their out of state enrollments are and then look at the chart to determine their next course of action.
California Virtual Campus
The California Virtual Campus (CVC) is a statewide community college system program to create comprehensive distance education support for faculty and students, including the development of content and delivery of online and hybrid instruction. The principal goals are to support the California community colleges in online course offerings, e-learning and/or distance education. It is funded through a grant in partnership with Butte College.
In 2008, California State Senate Bill 1437 created an expanded role for the California Virtual Campus as an educational entity. It authorized the “California Virtual Campus to pursue specified purposes relating to education technology to the extent funding is available.”
The Chancellor’s Office has responded to the direction of this bill in support of online and distance education by:
Forming the California Educational Collaborative, a K-20 group dedicated to sharing information on technology. This group is currently collaborating with the California Stem Learning Network on intersegmental science, technology, engineering, and math (STEM) initiatives.
Launching a community-based organization Connectivity Pilot Project with CENIC and establishing initial grants to provide high-speed internet access to community-based organizations to increase access to online education resources.
Assisting the Chancellor’s Office Academic Affairs Division with the development of two intersegmental online California High School Exit Examination preparation online tutorial courses and expanding their use to 42 counties. These tutorials prepare students to pass this critical exam that is needed to obtain their high school diplomas. Partnering with LA Trade Tech, expanded course concurrent enrollment opportunities for underrepresented and underserved K-12 students across the state by integrating high-quality interactive digital media and providing ten online classes that fulfill both high school and college credit transferrable to four-year colleges and universities. Starting the electronic portfolio10 pilot project, ePortfolio California which recruited 21 participating institutions from all California educational segments (K-12, California community colleges, CSU and UC).
@ONE
This project was funded through a grant in partnership with Evergreen Valley and Mt. San Jacinto Colleges. In 2009/10, @ONE responded to the demand for quality distance education and launched the Certification Program for Online Instructors, created a vibrant community of distance education coordinators and continued to promote participation in the Online Teaching Conference.
10
At its basic core, an ePortfolio is a digitized collection of artefacts including demonstrations, resources, and accomplishments that represent an individual, group, or institution. Students use ePortfolio to showcase accomplishments and reflect progress and skills development, as well as develop and sustain career paths. Faculty use ePortfolio to learn more about the ways California and national educators are using ePortfolios to improve student engagement and learning outcomes. Faculty can also use ePortfolios to demonstrate their research and teaching achievements.
The Certification Program for Online Instructors created a complete certification curriculum pattern for current and future instructors interested in achieving a recognizable standard of excellence in online distance education. The certification program is designed around the International Association for K-12 Online Learning’s (iNACOL) National Standards for Quality Online Teaching whichis designed to provide states, districts, online programs, and other organizations with a set of quality guidelines for online teaching and instructional design. The initiative began with a thorough literature review of existing online teaching quality standards, a cross-reference of standards, followed by a research survey to iNACOL members and experts to ensure the efficacy of the standards adopted.
Certification Program for Online Instructors highlights: Standardized statewide curriculum
Curriculum aligned with the International Association for K-12 Online Learning (iNACOL) standards.
Course redesign and continuous improvement. Complete certification curriculum pattern.
Establish process and standards to incorporate ePortfolios to demonstrate participant competency and store training artifacts. Custom certification programs for districts and colleges.
Educational Technology Advisory Committee
The board of governors Standing Order 409, Distance Education and Education Technology, directs the chancellor to establish an advisory committee “…to advise the Chancellor’s Office on the vision, policy, and planning in support of distance education and education technology.” The advisory group is composed of faculty, administrators, staff, and students from the system and works in collaboration with the Technology and Telecommunications Advisory Committee and System Advisory Committee on Curriculum in formulating recommendations to the chancellor. The committee has been in existence since 1994.
Distance Education Accessibility Guidelines for Students with Disabilities
In January 2011, the Chancellor’s Office issued a resource for supervisors of Disabled Students Program and Services (DSPS), assistive technology specialists, alternate media specialists, distance education coordinators, instructional designers, faculty, ADA/504 coordinators, trainers and administrators. These guidelines provide an extensive revision to the 1999
Distance Education: Access Guidelines for Students with Disabilities and an expansion of the guidance provided in the interim document, Distance Education Guidelines, 2008 Omnibus Version.
Since 1996, the California Community College system has been striving to fulfill its obligations to assure accessibility and usability of all college offerings, including those provided through distance education, for people with disabilities. These 2011 Distance Education Accessibility Guidelines were developed in response to the results of a 2007 statewide needs assessment
study appraising the resources needed to ensure that online distance education delivered in the system is accessible. The needs assessment was conducted after a recommendation by the High Tech Center Training Unit Advisory Committee, with the support of the Educational Technology Advisory Committee, and following observations by the High Tech Center Training Unit that steps to ensure accessibility of distance education offerings varied significantly by local expertise, capacity and the level of resources available to the college.
Since the publication of the 1999 Distance Education: Access Guidelines for Students with Disabilities, there has been explosive growth in the number of distance education courses provided by the 112 campuses. Concomitant growth is evident in the technologies available to faculty in developing exciting and interesting course o