Malware classification using self organising
feature maps and machine activity data
Pete Burnap
a,*
, Richard French
b, Frederick Turner
b, Kevin Jones
b aSchool of Computer Science & Informatics, Cardiff University, 5 The Parade, Roath, Cardiff, Wales CF24 3AA, UKbCyber Operations Team, Airbus Group Innovations, Newport, Wales, UK
A R T I C L E I N F O Article history:
Received 17 July 2017
Received in revised form 11 October 2017
Accepted 24 November 2017 Available online 5 December 2017
A B S T R A C T
In this article we use machine activity metrics to automatically distinguish between ma-licious and trusted portable executable software samples. The motivation stems from the growth of cyber attacks using techniques that have been employed to surreptitiously deploy Advanced Persistent Threats (APTs). APTs are becoming more sophisticated and able to ob-fuscate much of their identifiable features through encryption, custom code bases and in-memory execution. Our hypothesis is that we can produce a high degree of accuracy in distinguishing malicious from trusted samples using Machine Learning with features derived from the inescapable footprint left behind on a computer system during execution. This includes CPU, RAM, Swap use and network traffic at a count level of bytes and packets. These features are continuous and allow us to be more flexible with the classification of samples than discrete features such as API calls (which can also be obfuscated) that form the main feature of the extant literature. We use these continuous data and develop a novel classi-fication method using Self Organizing Feature Maps to reduce over fitting during training through the ability to create unsupervised clusters of similar “behaviour” that are subse-quently used as features for classification, rather than using the raw data. We compare our method to a set of machine classification methods that have been applied in previous re-search and demonstrate an increase of between 7.24% and 25.68% in classification accuracy using our method and an unseen dataset over the range of other machine classification methods that have been applied in previous research.
© 2017 The Authors. Published by Elsevier Ltd. This is an open access article under the CC BY license (http://creativecommons.org/licenses/by/4.0/). Keywords:
Malware Machine learning Self organising maps Intrusion detection Data science
Security operation centre
1.
Introduction
The detection of malicious software that “deliberately fulfills the harmful intent of an attacker” (Bayer et al., 2006) (malware) is a persistently difficult challenge for network security ana-lysts. Attackers are developing increasingly sophisticated methods to avoid detection based on vulnerabilities in
software and weak configuration of technical security coun-termeasures. Typical network security countermeasures include Network Intrusion Detection Systems (NIDS) capable of performing fine-grained network data and protocol-level analysis to identify anomalous and malicious traffic; and anti-virus tools that scan incoming software and attempt to match code signatures to a list of known malicious code bases.
*Corresponding author.
E-mail address:[email protected](P. Burnap). https://doi.org/10.1016/j.cose.2017.11.016
0167-4048/© 2017 The Authors. Published by Elsevier Ltd. This is an open access article under the CC BY license (http:// creativecommons.org/licenses/by/4.0/).
Available online at
www.sciencedirect.com
j o u r n a l h o m e p a g e : w w w. e l s e v i e r. c o m / l o c a t e / c o s e
Examples of such malware at the extreme end of the so-phistication scale are known as Advanced Persistent Threats (APTs). An in-depth study of the “Big 4” APTs – Stuxnet, Flame, Duqu and Red October – highlighted the factors that enabled malware to evade detection from security solutions (Virvilis and Gritzalis, 2013). The factors include (i) encrypted and/or obfuscated network traffic, limiting the effectiveness of network traffic analysis. Command and control servers received traffic on ports 22/TCP, 80/TCP and 443/TCP, so egress traffic was merged with other http packets (80/TCP) or encrypted in transit (22/TCP and 443/TCP). For http traffic, Duqu transformed data into JPEG image files before transmission avoiding packet-level analysis; (ii) Stuxnet, Flame and Duqu scanned the target for endpoint security products and customised the payload ac-cordingly to evade detection, limiting the effectiveness of signature based static analysis of executables; (iii) Red October made use of in-memory execution to remain undetected (Virvilis and Gritzalis, 2013). conclude that Anti-virus and Network Intrusion Detection products face serious shortcom-ings in the detection of APT and propose the analysis of “low severity events” that malware will inevitably generate during the attack’s life cycle’ as a future research direction. As such this work generates a range of system-level activity metrics by executing samples of malicious and trusted executables in a Sandbox environment, and uses these metrics to train a machine classifier to distinguish malicious from trusted executables using “low severity events” that are inevitably gen-erated while the executable is running – namelyCPU User Use (percentage), CPU System Use (percentage), RAM use (count), SWAP use (count), received packets (count), received bytes (count), sent packets (count), sent bytes (count), number of processes running (count) – just 9 metrics in total.
An additional consideration for malware classification with so many new instances appearing daily is the ability to detect malware that exhibits previously unseen behaviour. McAfee suggests tens of thousands of distinct samples that are seen daily1, and VirusTotal provides statistics that show that 1.37 million distinct new samples were submitted on Feb 12 20172. This is a non-trivial task but an important test is whether a classification model can generalise from previously seen features – those used to train the model – to unseen features. One way to partially test this is to use a different set of samples to test the classification. Not all previous work does this – several existing research papers usek-fold cross vali-dation which does split the dataset into iterative train/test subsets but does not use an unseen dataset. Thus, this paper also investigates the performance limitations of using cross validation versus an unseen dataset when using various machine learning methods.
Our main contributions are (i) using continuous machine activity data (e.g. CPU use, RAM/SWAP use, Network I/O) to classify malware – thus not depending on network traffic or API calls that can presently be encrypted or obfuscated by the malware itself. Malware can detect and avoid virtual machines but it cannot avoid leaving a behavioural footprint, so we use these data to classify malware. The introduction of
continuous data offers the opportunity to identify fuzzy activity boundaries in unseen attacks; (ii) the identification of over-fitting in some machine learning algorithms when using cross validation, leading to a drop in performance on unseen data (representing zero-day attacks), while other algorithms that are outperformed on cross validation show less evidence of overfitting when tested on unseen data; and (iii) using Self Organising Feature Maps (SOFM) to process machine activity data to capture fuzzy boundaries between machine activity and classes (malicious or trusted). This approach overcomes overfitting issues presented by other machine learning methods such as decision trees and support vector machines (for which we present performance results as a baseline for the SOFM improvement). An additional benefit of the SOFM data processing is the intuitive visual representation of machine activity data. We present the node activation frequencies of two competing SOFMs to develop behavioural visualizations for malicious and benign behaviour that have implications for use in Security Operation Centres (SOCs) for human analysis and visual detection of malicious behaviour.
2.
Related work
Malware analysis falls into two main approaches: static and dynamic. Static analysis examines software without execut-ing it, detectexecut-ing patterns in strexecut-ings, byte sequences, library calls and operation codes to determine if it is malicious (Gandotra et al., 2014). Static approaches are widely considered inad-equate on their own due to obfuscation techniques that make the approach unreliable (Moser et al., 2007; Ranveer and Hiray, 2015). Furthermore, the approach depends on matching pat-terns to known malicious signatures, which makes previously unseen attacks, such as polymorphic malware and zero-day exploits, difficult to detect. Dynamic analysis executes the soft-ware and analyses its behaviour during execution in an isolated environment known as a Sandbox. Behaviour monitoring tools capture interactions between the software and the underly-ing system such as process detail, file and registry changes, and network traffic (Gandotra et al., 2014). This approach is also imperfect as attackers are able to detect Sandbox environ-ments and alter their behaviour to avoid detection. However, for a successful attack to occur, interaction between malware and the underlying system it is attempting to exploit must occur, and dynamic analysis offers the potential to capture metrics during this interaction that can be used to detect the attack (Ranveer and Hiray, 2015).
Both static and dynamic approaches to malware analysis produce data that can be transformed into a form that repre-sents the characteristics of the software being used to fulfil the harmful intent of an attacker, which has led to an inter-est in automating the detection of patterns within these data using machine learning.Ranveer and Hiray (2015)conducted a survey in 2015 to collate and compare features used to detect malware. While there is still some research support-ing the value of static analysis (e.g. byte code ngram features, opcode ngram features and strings), the majority of the lit-erature suggests there are too many evasion techniques in use for this to be practical. Nataraj et al. also support this 1McAfee Threats Report: Second Quarter 2012.
view, stating that binary obfuscation techniques that affect static analysis are ‘near-universally adopted by today’s malware publishers’ (Nataraj et al., 2011). As Ranveer and Hiary state, any malicious software invokes some kernel level system call to communicate with the underlying operating system, thus capturing and analyzing kernel interactions can enable the detection of malware (Ranveer and Hiray, 2015). Their review provides a comparative table that collates and com-pares performance metrics from a number of malware detection systems. It also refers to a standard dataset used by some research as a benchmark, though many research papers do not use this dataset so it is difficult to make a true compari-son. It is important to distinguish different forms of malware classification when comparing related work. There is re-search that attempts to classify executable files as malicious or benign, and work that aims to categorize malware in fami-lies using classification (e.g. David and Netanyahu, 2015; Kolosnjaji et al., 2016; Nataraj et al., 2011; Saxe and Berlin, 2015; Shibahara et al., 2016). Our focus is on the detection of malware as it executes, thus we focus on the former when analysing related work.
Tian et al. use Support Vector Machines (SVM), Random Forest (RF), Decision Table (DT) and IB1+AdaBoost together with frequency-based API calls with Windows XP as a base operat-ing system to 97% malware classification accuracy usoperat-ing RF and DT (Tian et al., 2010). This result was obtained using 10 fold cross validation. Firdausi et al. used K-Nearest Neighbour, J48 Decision Trees, SVM and Multi-layer Perceptron using API calls to produce 96.8% accuracy on a Windows XP base OS using J48 (Firdausi et al., 2010). They use a small sample of 250 malware so we assume these results are also cross-validated. Damodaran et al. used Hidden Markov Models (HMM) with API calls and a hybrid static/dynamic model (Damodaran et al., 2017). They use 5-fold cross-validation to achieve a 0.98 AUC-PR score for family-based malware classification. They demonstrate that dynamic analysis outperforms static and hybrid classification. Further-more, they inflate the benign class during testing to create a more realistic balance of malicious and benign samples, showing classifier performance drop-off as benign samples in-crease – with the dynamic approach remaining more stable than static or hybrid approaches. Tobiyama et al. performed feature extraction from 81 malware logs and 69 benign logs using Long Short Term Memory (LSTM) models (Tobiyama et al., 2016). They achieved an AUC score of 0.96 using 5-fold cross validation. Ahmed et al. studied the sequence of API calls using a dataset of around 500 files. They showed a performance of 0.98 AUC using 10-fold cross validation and a Naive Bayes classifier (Ahmed et al., 2009).
Device activity metrics have previously been used on mobile platforms such as Android to detect malware, sup-ported by additional device-specific metrics such as SMS and key-stroke data (Dini et al., 2012). On more traditional desktop computing environments Scaife et al. studied RansomWare, which is a specific type of malware that heavily uses read/ write calls to the file system to encrypt a user’s data. Using rule-based indicators relating to modification of user data and suspicious file activity, rather than machine learning, they matched a sample of 492 RansomWare attacks with 100% accuracy (Scaife et al., 2016). Continella et al. also studied RansomWare and used machine learning to detect
this type of attack using file system calls. Unlike much of the existing literature, they tested their classifier using 305 unseen samples and detected 97.7% of unseen RansomWare attacks (Continella et al., 2016).
These results show significant promise for malware clas-sification but using k-fold cross validation leaves questions as to the generalizability of results to unseen samples in most cases, and no research to date has attempted to test the suit-ability of continuous machine activity data with a non-discrete choice classification method as a way to avoid over-fitting on unseen general malware samples that could exhibit a broad range of observable actions. In our research we will reproduce these results using an unseen test dataset on the best performing classification methods to provide evidence for a hypothesis that unseen data will cause a drop in perfor-mance – especially on discrete-choice models such as RF and DT where unseen data may exhibit a different range of behaviours.
Pascanu et al. argue that more research was required to handle reordered temporal patterns so proposed an ap-proach to extract executed instructions using Echo State Networks and Recurrent Neural Networks (RNN), then used Logistic Regression to classify malicious files with a true posi-tive rate of 71.71% and a false posiposi-tive rate of 0.1% (Pascanu et al., 2015). A key point here was the comparison between the recurrent model and a bag-of-events model, where the recurrent approach showed a factor of three improvement. Extending work into Neural Networks, Dahl et al used 3.6 million files (from Microsoft) to train and test models using Logistic Regression, shallow and deep Neural Networks (Dahl et al., 2013). Using API calls they produced an error rate of 0.49% with an ensemble of 9 Neural Nets. It was notable that the best performing model was a shallow Neural Network (1 layer). However, Huang and Stokes built on this research and used a sample of 6 million (from Microsoft) to train and test a Deep Neural Net (Huang and Stokes, 2016). They utilised ReLU and Dropout to good effect, using 114 API events plus parameters to achieve an error rate of 0.36%. Adding more layers to the NN did not achieve significant gains in perfor-mance (confirming the findings of Dahl et al.), neither did increasing the sample size by almost double that of Dahl et al. – but using Dropout did see improvements, suggesting that optimizing the efficiency of the Neural model can improve performance more than increasing the depth and dataset size. Neither dataset is publicly available so it is difficult to benchmark against this research. A key limitation of both papers, which is not specific to this work, but Neural Network models more generally, is the time taken to build a model. It took nearly 3 hours to train the model used by Dahl et al., and 7 hours to build for Huang and Stokes. With the vast amounts of new malware appearing daily it would seem infeasible that either of these models could be built and deployed to take into account new samples appearing in “real time” as happens with existing signature-based anti-virus systems. In our research we will investigate the use of a neural competitive learning model that has the ability to generalise across different datasets and is capable of online learning so that new samples can be fed in as they become available with minimal training time – a property exhibited by Self Organizing Feature Maps (SOFMs).
3.
Methods
3.1. Self Organising Feature Maps
The Self Organising Feature Map (SOFM) ofKohonen (1982)is an unsupervised learning technique that takes as input an n-dimensional vector of real values and uses this to modify the contents of randomly-seeded vectors (known asmodelor referencevectors) stored in anm-dimensional array (usually a two-dimensional grid, known as amap). Significantly, input and model vectors can exist in a higher dimensional space than that of the map itself and thus permits dimensionality reduction. This means using a low-dimensional (e.g., 2D) map allows convenient visualisation of data points in a higher-dimensional space (e.g., 5D). It is important to note, however, that the choice of attributes that make up the model vector, together with the characteristics of the dataset, will deter-mine an SOFM’s susceptibility to the problem of over-fitting. The SOFM has found application as a data analysis tool in industry, finance, natural sciences, linguistics (Kohonen, 2013), and robotics (Smith, 2002). It has been used in a cyber secu-rity context previously to visualize the effect on binary files when infected with viruses (Yoo, 2004), but to the best of our knowledge it is yet to be integrated into an algorithmic ap-proach to malware classification.
For each input vector, the map is scanned for the best match-ing model vector. This is known as the Best Matchmatch-ing Unit (BMU). The BMU’s model vector is then adjusted by a small amount to be closer to the input vector. Importantly, model vectors surrounding the BMU (using a radius that defines its neighbourhood) are adjusted by an amount inversely propor-tional to their distance away from it. As learning progresses, vectors in this vicinity of the grid represent points in space similar to that of the BMU, thus the map preserves the topol-ogy of the input vectors. As Kohonen puts it:
More similar models will be associated with nodes that are closer in the grid, whereas less similar models will be situ-ated gradually farther away in the grid.
It is this formation of topographic neighbourhoods, sepa-rated by “fuzzy boundaries”, that allow the SOFM to respond sensibly to new inputs that fall into an area of the map de-veloped by previously presented inputs. It is for this reason that we selected SOFMs as a method to process machine activity data from potentially malicious executable files that may exhibit different behavioural properties over time. The “fuzzy bound-aries” enable us to map new samples onto existing maps and determine that the behaviour may be different but similar enough to previously observed behaviour to label it as mali-cious – that is, to better generalize between samples over time. Essentially what we have developed are representations of behavioural ‘DNA’ in a malicious or trusted context that provide a model to which potentially malicious executables can be compared for similarity.Being inherently visual, this is not only appar-ent to algorithms, but also to humans when reducing multiple dimensions of machine activity to a 2D map.
Over time the radius of the neighbourhood surrounding a BMU is reduced. This means the map has acritical period of
de-velopment(e.g.Wiesel and Hubel, 1963), after which modification is limited without resetting the radius value. This is one way of addressing the plasticity-stability dilemma, that isa learn-ing system needs the ability to adapt to its environment, but it also needs stability in order to maintain efficacy of function(e.g.Abraham and Robins, 2005).
In this work we use the SOFM approach in two ways: Firstly by taking advantage of the topographic neighbourhoods as a simple method of generalization when evaluating previously unseen machine activity. In this respect the SOFM is tested as a standalone malware classification method. Secondly, by using dimensionality reduction to transform machine activity to two dimensions from a higher-dimensional dataset, we are able to use SOFMs as a pre-processing stage to produce a new feature set for use with machine classification algorithms that re-flects topographical neighbourhoods as “fuzzy” feature sets that have the potential to improve the generality of behaviour clas-sification on unseen samples – for example, polymorphic viruses or hand-modified malware.
3.2. Data and architecture
To develop a system capable of supporting the stated require-ment of a behavioural-driven classification of malware, we produced a dataset of “clean” and “malicious” files. Execut-able files were collected from the VirusTotal API. VirusTotal is owned by Google and provides a public service to upload sus-picious files and obtain a report that can be used to determine whether or not it is malicious based on the outcome of passing it through up to 48 individual virus scanning tools – includ-ing Kasperky, McCafee etc. The API is available for academic research and includes a broad range of search parameters with which queries can be created to produce a specific software sample for analysis. Example parameters include: Type (e.g. por-table execupor-table, HTML, Email, PDF, DocX); Tag (e.g. FTP, SSH, MySQL, SMTP); Type (suspicious-dns, hosts-modifier, create-file, download, registry; Behaviour (http). The API also supports the collection of “trusted” (no hits from the scanning tools) and signed files, enabling a “clean” sample to be collected. This is necessary for the task of training machine classifiers to dis-tinguish between malicious and benign actions.
We collected an initial sample of 594 malicious files of the Portable Executable (PE) 32-bit format where at least 10 indi-vidual virus scanners labelled the file as malware. For the purposes of developing a “clean” sample we collected a further 594 files that were labelled “trusted” – i.e. considered not to be malware by all the individual scanners. This does have the limi-tation of depending on the individual scanners of course. If the file is a zero-day piece of malware with a code signature unknown to existing anti-virus software, the “trusted” label is misleading. However, we have to work on the assumption that the vast majority of samples would not fall into this category and proceed with the sample available. These 1188 files were then passed into the Sandbox Architecture described inFig. 1 for the purposes of observing and recording their behaviour during execution. The number of files used is in line with many existing research studies of this nature (Ahmed et al., 2009; Damodaran et al., 2017; Firdausi et al., 2010; Tobiyama et al., 2016; Yuan et al., 2016).
To produce logs of behaviour we developed a bespoke Sandbox environment based on an extension of Cuckoo Sandbox. The architecture diagram inFig. 1illustrates the en-vironment in which the sample files were executed for the purposes of recording their behaviour and generating a dataset for use in developing machine learning approaches to distin-guish malicious files from benign ones. The figure depicts the storage of sample files (top right) and a script that sequen-tially pushed samples to Worker Nodes. Each Worker node consisted of a Ubuntu 12.04 Operating System running minimal services, with an installation of VirtualBox running Windows 7 in a virtual environment. The Windows configuration in-cluded: Adobe Acrobat Reader; Microsoft Office Word, Excel and Powerpoint, SQL Server and an active email account via Outlook. Samples were submitted to Worker nodes with the Cuckoo Sandbox API, wrapped by a script to provide the reliable in-jection of large batches of samples and log failures. Cuckoo operates as a malware analysis platform by accepting sample files either via an HTML user interface or a command line Python client. Once a sample is received it opens a virtual machine and executes the file within the virtual environ-ment, keeping the environment running for 5 minutes to allow the file to execute its payload. The 5 minute window was ar-bitrarily defined on the assumption that the payload would execute immediately upon execution and would take no longer than 5 minutes to complete. This presents the limitation of not capturing delayed execution commands, but with a finite time frame for experimentation, we needed to define a reasonable time window. During and post execution Cuckoo generates
several reports, including Hashes of the executable binaries, file accesses, registry keys accessed, processes executed and a PCAP dump. Cuckoo also calls the VirusTotal API indepen-dently and submits the file for analysis, which returns another report with similar logs but without the detailed PCAP traffic and with the addition of the names of various anti-virus soft-ware solutions that have tagged the file as malsoft-ware.
In addition to the default cuckoo analysis, we developed a script that executed as a background service in the virtual en-vironment while samples were being executed. The script was designed to capture dynamic behaviour on the system, par-ticularly system activity that could potentially be used to train a machine to recognize the signals of malicious behaviour on the system. The script collected CPU and memory/swap use, remote connection established flags, open port numbers, network interface types being used, bytes sent and received, and packets sent and received.
One of the main objectives of this work was to better un-derstand the utility of using machine behaviour to classify sample files, thus each sample was executed in a Worker Node on a single machine. This limits the speed of the analysis as it prevents multiple virtual machines executing samples in par-allel on the same machine, but it avoids contamination between samples. With the addition of more physical machines, the sample execution could be made much faster by replicating the virtual environment on each physical node.
After each sample was executed, the virtual environment was restored to its original “clean” state by reverting to a “Snap-shot” taken before the experiments began. For persistence, Fig. 1–Malware analysis platform architecture.
Cuckoo stored the reports in a local directory on the host machine (not within the virtual environment). The dynamic behaviour capture script took observations of the system behaviour every second, producing 300 observations for each sample in the 5 minutes (300 second) time window. Each ob-servation was pushed to a network-hosted SQL database within the local network. Naturally this produces an increase in network traffic, which will contribute to the observed network statistics. However, this is the case for every observation, and for malicious and benign samples, so we were confident it would not interfere with the experiments.
The approach described above is applicable for internal and external threats based on the assumption that malware and insider threats are executed via instructions codified into ex-ecutable files. There also exists the possibility that internal and external threats can be executed manually, through script modi-fication, password changes/cracking etc. These have not been considered at this stage because the focus of the work is machine classification to distinguish between malicious and benign activity. It is non-trivial to produce a sample of manual behaviour of this kind, and the ethics of monitoring individu-als at work is complex across international jurisdictions. This can be investigated in future should it be deemed a viable option.
To aid in the training and testing of our model, and to prototype a deployable malware detection system, we created a framework to automate the analysis, from sample submis-sion through to classification. As described earlier in this section, the first software element injects samples into Cuckoo and logs those which did not process successfully. This is important, as some of the samples received from VirusTotal are not compatible with Windows 7 and their attempted ex-ecution in the virtualised environment fails. The error log files generated are subsequently parsed, and those samples whose execution failed are excluded from processing. The next program in the suite reads the data files created by Cuckoo, along with the machine statistics in the database, collates and generates metrics, and outputs an ARFF (Attribute-Relation File Format) file of feature vectors; one for each second snapshot of each software sample. For the results used in this study, the machine statistics from the database are simply transformed into feature vectors.
The malware analysis framework can be run in either of two modes: training mode, for retraining the classification model on a newly presented set of sample data; or online mode, in which a single software sample is analysed by the trained classifiers, and the classification result (the model’s belief as to whether the sample is benign or malicious) is output. If being run in training mode, the generated ARFF file is split into two – one for training and another for validation – which are sent onwards to the machine learning module over a socket con-nection; else the ARFF file contains only a single sample, the vectors of which are sent to the machine learning classifiers one at a time. This sequence of processing is orchestrated by the Malware Analysis Coordinator (Mack), and the framework is designed as a distributed system capable of running many such instances (regardless of the mode) simultaneously. A Mack instance terminates once the classifiers have been trained suc-cessfully (training mode) or have returned a classification result (online mode).
The code for the SOFM module is wrapped in an agent named Somantha (Self Organising MAp NeTworking Helper Agent) which is responsible for coordinating training and online pro-cessing requests from Mack clients, and facilitates the concurrent analysis of online instances. The secondary clas-sifier is also wrapped in an agent, Florense (Forwarding LOgistic REgression Networking Server), to perform the same duties of han-dling networking, coordinating training and online processing, and facilitating concurrent analyses. When the system is run in training mode, the SOFM generates files containing the BMUs for the training vectors, which are sent on to Florense via Mack; when run in online mode, the SOFM sends this data straight to Florense, one BMU at a time as it is generated. Florense and Somantha also contain various locking mechanisms to ensure that online analysis cannot be conducted if training of the model failed due to system malfunction, and to avoid dead-lock between these servers and Mack instances. The final component of the framework is a“PERmission SErvEr”(Persee), which maintains a centralised repository of feature vector at-tributes, and prevents race conditions between training and online instances which could otherwise result in feature vectors with an incorrect attribute structure being submitted to the SOFM. To keep connections between the agents in the frame-work organised, communications between Somantha and Florense relating to a given Mack instance are routed through said Mack instance.
Developing the system with a client-server architecture, which permits multiple Mack instances running on different hosts, but in which there is only a single instance of the model(s) (managed by Somantha and Florense); fulfils require-ments for scalability by facilitating concurrent analysis without the limitation of “cross-contamination” inherent to perform-ing this task on a sperform-ingle machine, while requirperform-ing only a sperform-ingle copy of the model prevents the need for redistribution when-ever the system is retrained. The software suite developed also contains applications for running batch online analysis from a single ARFF file (i.e. given the feature vectors for a set of samples, classifying them all), and performing cross-validations of the model.
3.3. Machine learning for malware classification
To develop an automated machine classification system that is able to identify patterns of behaviour that distinguish between malicious and trusted samples we began by developing a set of baseline results using machine learning algorithms across a range of classifier types that performed best in the existing literature – decision trees, probabilistic Bayesian, support vector machine and neural networks.
To produce experimental results the Java Weka machine learning libraries were used to develop a number of super-vised classifiers that were trained and tested using a set of behavioural features –CPU User Use (percentage), CPU System Use (percentage), RAM use (count), SWAP use (count), received packets (count), received bytes (count), sent packets (count), sent bytes (count), number of processes running (count). These observations were transformed into a feature vector (represented as a comma separated list of behaviour features), which included the actual class label (malicious or benign). InSection 4we provide results for Bayesian Belief Nets, Decision Trees, Support Vector
Ma-chines and Neural Networks. All of these algorithms make classification decisions based on different underlying math-ematics so provide the opportunity to investigate the utility of static and dynamic behaviour.
3.3.1. Probabilistic models
Probabilistic classifiers identity statistical coefficients for each feature in a vector based on the likelihood of that feature ap-pearing in any of the classes available and uses this to predict the classes of previously unseen samples. We implemented a Bayesian Network model that considers conditional depen-dencies between features, and a Naive Bayes model, which assumes conditional independence between variables. We would expect conditional dependence as, for example, more pro-cesses running on the machine would be expected to push up CPU and RAM use. We only report the best performing of these as the optimum probabilistic model - which was, as ex-pected, the Bayesian Network model.
3.3.2. Decision trees
Decision Tree methods recursively select features within the vector and develop a set of rules based on minimizing classi-fication error when using each feature, selecting the optimum features and making a rule-based criteria for classification (e.g. feature x with value greater than y will likely fall into class z). Performing this step multiple times creates a hierarchical set of rules that can be used to make classification decisions. The Random Forest Decision Tree (RFDT) method was used as a rule-based approach to classification. A Random Forest imple-mentation of a decision tree was used because it iteratively selects a random subsample of features in the training phase and trains multiple decision trees before predicting the outputs and averaging out the results, maximizing the reduction in clas-sification error (Breiman, 2001). The approach combines the results of a number of decision trees to identify the optimal set of rules, which was appropriate in this case because of the amount of noise and variance within the training and testing data sets.
3.3.3. Support vector machines
Support Vector Machines (SVM) make classification decisions by transforming feature vectors into high-dimensional space, and identifying hyperplanes (lines that separate the data points) to divide the space such that the behavioural features belong-ing to different classes are separated. Multiple hyperplanes can be used and the optimal hyperplane will be the line that maxi-mizes the separation between classes and minimaxi-mizes classification error. In this case linear kernel and non-linear kernels were used as hyperplanes and we report the best per-forming SVM kernel method inSection 4.
3.3.4. Artificial neural networks
Artificial Neural Networks are inspired by biological neural networks (in particular the human brain) and are comprised of a range of functions that map input nodes to output nodes through a series of hidden nodes that can be connected to varying degrees and whose connections are weighted based on a learning rule that reconfigures weightings based on node activation in the training phase. The recent growth of Deep Learning has brought ANNs to the forefront of modern
machine learning and in this phase we studied the perfor-mance of ANNs by implementing a Multilayer Perceptron with 9 hidden layers and a learning rate of 0.01, optimized through experimentation.
3.4. Self organising feature maps
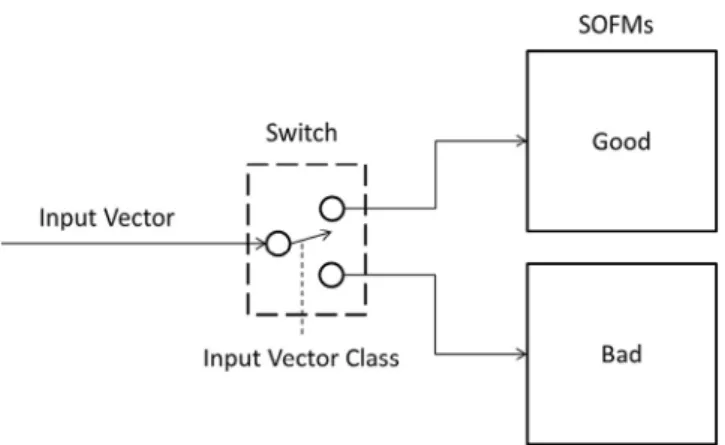
Early experiments using a single map for two class outcomes (malicious and benign) led to confusion because of the com-petitive nature of SOFM function. The single map found it difficult to separate malicious and benign behaviour which led to poor classification performance results. Hence, we trained two maps with labelled examples from a training set. The “Good” map was trained using the trusted samples, while the “Bad” map was trained using the malicious samples. This is shown inFig. 2.
4.
Results
4.1. Machine learning baseline results
To establish a baseline for the comparison of evaluation metrics between k-fold cross validation metrics with those achieved by testing on an unseen dataset we used a 10-fold cross validation approach using the entire dataset of 345,000 observations. This approach iteratively trains the classifier on 90% of the training data and tests on the remaining 10%. After 10 iterations, the results are calculated by taking the mean ac-curacy across all models. Evaluation metrics provided inTable 1 are the standard classification measures of Precision (an in-dicative measure of false positives), Recall (an indicate measure of false negatives), and F-measure (a harmonized mean of Pre-cision and Recall). The maximum score for each is 1.0.
Fig. 2–Training the SOFMs from labelled input vectors.
Table 1–Summary of 10-fold cross validation classification results.
Algorithm % Correct Precision Recall F-Measure
Random Forest 98.54 0.985 0.985 0.985
BayesNet 82.90 0.832 0.829 0.829
MLP 81.86 0.823 0.819 0.818
The results show a very high performance for Random Forest Decision Trees. This method derives a set of discrete choice rules over the whole dataset with which to classify new instances. This finding is in line with those ofTian et al. (2010)andFirdausi et al. (2010) who both achieved high performance using decision tree classifiers and cross validated results. Interest-ingly we found the Bayesian Network to outperform a Naive Bayes approach, confirming our initial thoughts that condi-tional dependencies would exist between features derived from machine activity. BayesNet and our ANN approach using a multi-layer perceptron with 9 hidden layers both performed similarly, but were significantly lower than a decision tree approach.
To test the generalization potential of these models we next tested them using behaviour observations from an unseen set of samples. The sample set of 1188 files (594 malicious and 594 benign – seeSection 3.2) was split equally so that half the ma-licious samples and half the trusted samples were in a “training” dataset, while the other half of each was stored in a “testing” dataset. Our hypothesis now was that in doing this, models based on data-driven rules and probability may struggle to generalise beyond the training data and be unable to accu-rately classify unseen behaviour from the testing dataset. This is effectively a simulation of polymorphic malware or hand-crafted malware behaviour, where the interaction with the system on which it is run leaves a different footprint to pre-vious samples.
Table 2shows that the Random Forest approach drops by more than 12% when the model is trained and tested using different datasets. As expected, this is likely due to the set of rules derived during training being overfit to the data, and suf-fering from a lack of diverse behavioural data in the testing phase. BayesNet performance is reduced by just over 5%, again suffering from a lack of exposure to the volume of data it saw in the k-fold cross validation method – but staying reason-ably stable suggesting that the probability of behavioural features occurring in both data sets is high, albeit with some degradation of performance where differences occur. The MLP model only dropped in performance by 2.45% – providing evi-dence that a model based around weighting features through an Artificial Neural Network provides stability between train-ing and testtrain-ing datasets. This is in line with other research that found benefits in the ANN approach such asDahl et al. (2013) andHuang and Stokes (2016), but the decision tree approach based on the Random Forest algorithm continued to outper-form the other algorithms used in the existing literature on the continuous machine activity data.
4.2. Using SOFM as a classification method
The next phase of results are based on our implementation of a SOFM. In the first instance as a standalone classifier,
and secondly as a pre-processing method to transform 9-dimensional continuous machine activity data into a 2D new feature set that reflects topographical neighbourhoods as fuzzy feature sets representative of similar behaviour.
During training, a 9-dimensional input vector of normalised values from the training set was directed to either theGood map, used to represent the class of clean baseline data, or to theBad map, used to represent the class of data that in-cludes “dangerous” values. Importantly, “Bad” data will likely include “Good” examples. In such cases the Euclidean dis-tance between Good and Bad map BMU model vectors will be relatively low.3
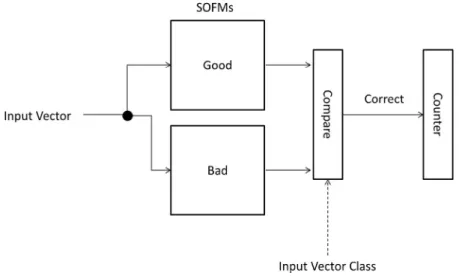
Testing with unseen data is performed by comparing the output activity of the BMU, from each map, for a given input vector. The activity of a BMU is a function of the Euclidean distance between its reference vector and the input vector, where the smallest activation “wins” and the sample is asso-ciated with “winning” map. We implemented a voting scheme accumulating correct classifications during testing in a counter for each sequence presented to the maps (i.e. every time a new snapshot of machine activity was presented to the map), giving a total of 300 “wins” per sample, where the highest number of “wins” led a classification outcome of “Good” or “Bad” depending on which map had the most. The accuracy of this stage was determined by comparing the class labels of each sample with the classification outcome. This is shown inFig. 3.
SOFMs are n by nmatrices so in order to make an in-formed choice regarding map size, we conducted a series of experiments exploring how this parameter affected the dis-tribution of classification accuracy when using the testing dataset. Map sizes were varied from 5×5, in increments of 5, through to maps of 100×100, with training limited to 10 presentations of the training set. Significantly, because a map is initialised with a randomly-seeded set of model vectors, each experiment with a particular size was repeated 100 times and was carried out in order to determine the distribu-tion of results, with the peak of the distribudistribu-tion taken as the optimum size.
The plot showing the relationship between the distribu-tion of correct sample classificadistribu-tion versus lattice size is given inFig. 4. Map size is plotted against the percentage of correct sample classification, with the frequency axis showing the number of times the map size achieved the level of accuracy out of the 100 runs. This clearly shows a correspondence between map size and a higher frequency of correct matches for map sizes between 50 and 100 (top left corner). The maximum accuracy achieved was 90% on an 80×80 map size.This is an improvement of 3.48% over the best performing algorithm in the previous phase. 89% was achieved on map sizes of 60, 65, 70 and 75. The 50×50 map achieved 88%. Thus, as a standalone classification method using machine activity data as input, the SOFM approach has improved on the Random Forest approach based on, we would posit, its ability to generalize beyond discrete rules and support “fuzzy” neighbourhood boundaries for similar behaviour. This allows
3Assuming examples of good data include vectors similar to benign samples labelled as bad data.
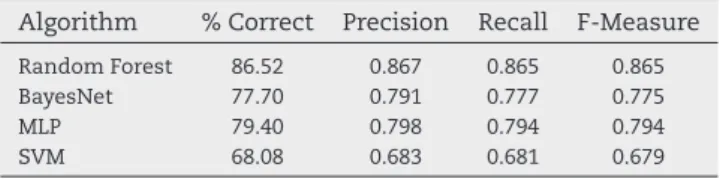
Table 2–Summary of train/test classification results. Algorithm % Correct Precision Recall F-Measure
Random Forest 86.52 0.867 0.865 0.865
BayesNet 77.70 0.791 0.777 0.775
MLP 79.40 0.798 0.794 0.794
the model to distinguish between known malicious and trusted machine activity footprints during training and subse-quently map unseen and differentbut similarbehaviour onto a regional cluster.
4.3. Using SOFM output to produce a probabilistic model for classification
Given the success of the SOFM as a standalone classifier, and our assumption that this improvement over the state of the art was due to the ability to capture regions of behaviour, the final phase of our experimentation was to take the output of the SOFM as a new feature set. For maximum accuracy we could have used the 80×80 map for this, but given the difference was only 2% we chose to use the 50×50 map to reduce com-putational processing time for training. With the number of
new samples emerging daily training time is an important con-sideration given that an ideal scenario would be to re-train the model frequently to include new samples of malware – much in the way signature-based anti-virus would update.Table 3 shows that the 50×50 map was more than 37% faster to train than the 80×80 map.
In this experiment we pushed each sample onto the SOFM and instead of the classification result we recorded the BMU – a 2D representation of the node onto which the feature set was closest in terms of Euclidean distance – effectively anx-y coordinate on a 2D map. This produced a new feature vector of up to 300x-ycoordinates for each sample which were sub-sequently used to train and test an ensemble classifier composed of a Logistic Regression module to transform the fea-tures into a binary classification. This forms an end-to-end workflow from sample, to Sandbox, to SOFM, to Logistic Fig. 3–Testing the SOFMs ability to classify labelled input vectors, and accumulating results with a counter.
Distribution of % Correct Matches vs Map Size
10 20 30 40 50 60 70 80 90 100 Map Size 55 50 60 65 70 75 80 85 90 95 % Correct Matches 0 10 20 30 40 Frequency 0 5 10 15 20 25 30 35 40
Regression and classification results. We refer to this work-flow as the Malware Operational Plot Review, or MOPR. The same training and testing datasets were used to evaluate the performance of MOPR in comparison to the existing bench-mark results, and the results are shown inTable 4.
The results show that using the SOFM with two 50×50 maps as a pre-processing phase, where the results are then used an input to an additional classifier improves the classification per-formance by an additional 3.76% over the SOFM alone and by 7.24% over the best performing method currently used in the state of the art literature when applied to continuous machine activity data. Our explanation for this improvement is that, while the SOFM improved over the Random Forest as a stand-alone classifier, this was based on a majority vote decision resulting from the number of times the “Good” and “Bad” maps “won” the BMU for each sample. This approach does not enable
us to control for differences in statistical co-efficient likely to be evident to a Logistic Regression model when making a binary classification decision. That is, not all BMUs are equal and a count-measure does not control for this.
4.4. Visualizing activity using SOFM
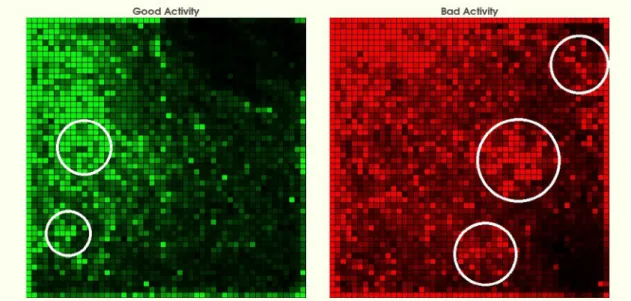
An added advantage of SOFM is the ability to represent BMU activation frequencies as heat maps on a 2D visualization. Fig. 5shows the malicious and trusted system behaviour plotted onto two SOFMs. The circles on the maps indicate regions of high activation, denoted by brighter colour within each cell (one cell=one BMU). The brighter the cell, the more it is ac-tivated during the training phase. Thus, when mapping new activity from an unseen sample onto these maps the BMUs emerging in the brighter regions can be used for automated classification (as they were in the standalone SOFM classifi-cation task), but also have utility for inference by human analysts – for instance Security Operations Centre analysts who need to act on the result of machine classification. This has significant implications for practical security applica-tions. If an alert is raised through automated classification of machine behaviour the visualization can be used to add further weight to the confidence in the classification of the sample. For instance, if the BMUs activated are mostly in the “bad” map, and in a high activation region, the confidence that this is correctly identified as malware can be higher than if the BMUs are split between the maps and/or in areas of low ac-tivation. This also enables human feedback to be integrated in future to be able to improve the classification model through human-in-the-loop confirmation or rebuttal of the auto-mated classification output.
5.
Conclusions
Cyber attacks are becoming increasingly complex with obfus-cation of network traffic and system level interactions in recent Table 3–SOFM performance vs. train/test time.
Map Size Max % Correct Frequency Train Time Test Time 50 88 21 45m7.846s 3m49.715s 55 88 22 57 m24.167s 4m39.516s 60 89 17 67m30.578s 5m31.670s 65 89 35 79m40.964s 6 m24.448s 70 89 17 93 m27.141s 7m19.671s 75 89 19 104m49.351s 8m13.109s 80 90 22 119m38.442s 9 m22.653s
Table 4–Summary of train/test classification results. Algorithm % Correct Precision Recall F-Measure
MOPR 93.76 0.946 0.930 0.938
Random Forest 86.52 0.867 0.865 0.865
BayesNet 77.70 0.791 0.777 0.775
MLP 79.40 0.798 0.794 0.794
SVM 68.08 0.683 0.681 0.679
APTs, and polymorphic malware changing the measurable behaviour of the executable. We aimed to use machine data to classify malware using data that is presently more diffi-cult to obfuscate – system level behaviour such as CPU, RAM, process data and network bytes/packet count. We built machine classifiers using state of the art methods from the extant lit-erature as a baseline, with data that is continuous and represents behaviour on the system without depending on precise system level operations.
We then implemented a two-map SOFM with the aim of en-abling ’fuzzy boundaries’ to be captured around system behaviour and the hypothesis that this method would improve classification accuracy over the state of the art methods. The ’fuzzy boundaries’ enable us to map new samples onto exist-ing maps and determine that the behaviour may be different but similar enough to previously observed behaviour to label it as malicious - that is, to better generalize between samples over time. Essentially what we have developed are represen-tations of behavioural ‘DNA’ in a malicious or trusted context that provide a model to which potentially malicious executables can be compared for similarity - introducing a new way of think-ing about malicious behaviour modelthink-ing. We found a 3.45% increase in classification performance using an unseen testing dataset.
We also investigated the impact on classifier performance when using the unseen test dataset versus a k-fold cross validation method, which is frequently used in malware classification research. The rationale for this was to deter-mine whether system behaviour that was not exposed to the classification model during the training phase would evade classification during testing. K-fold cross validation of course leaves a sample out during training, but having a separate dataset of samples allowed us to test beyond the holdout approach. It is effectively a simulation of polymor-phic malware or hand-crafted malware behaviour, where the interaction with the system on which it is run leaves a different footprint to previous samples. We found that there was a significant drop in performance when the model was exposed to an unseen dataset with an equal balance between classes.
Finally we combined the SOFM with an ensemble classi-fier based around a Logistic Regression model and used the Best Matching Unit output from the SOFM – which represents “fuzzy neighbourhoods” of system behaviour – as features, in place of the continuous machine activity data used in the previous experiments. We saw an increase of classifier performance of between 7.24% and 24.68% over the state of the art when using this novel approach to malware classification. The findings suggest that the neural-type model for learning, combined with an ability to provide flexible classification boundaries using the SOFM shows promise as a method for the detection of APTs and polymorphic malware where the activity carried out during the attack may vary between samples.
Future work will include increasing samples size and granularity of data to determine if other models can perform better with increased behavioural context through more fine-grained data. We will also look to try and model phases of system behaviour with an aim to detect such attacks at an early stage rather than waiting for full execution of the malicious payload.
R E F E R E N C E S
Abraham WC, Robins A. Memory retention the synaptic stability versus plasticity dilemma. Trends Neurosci 2005;28:738.
Ahmed F, Hameed H, Shafiq MZ, Farooq M. Using spatio-temporal information in API calls with machine learning algorithms for malware detection. In: Proceedings of the 2nd ACM workshop on security and artificial intelligence. ACM; 2009. p. 55–62.
Bayer U, Moser A, Kruegel C, Kirda E. Dynamic analysis of malicious code. J Comput Virol 2006;2(1):67–77.
Continella A, Guagnelli A, Zingaro G, De Pasquale G, Barenghi A, Zanero S, et al. Shieldfs: A self-healing, ransomware-aware filesystem. In: Proceedings of the 32nd annual conference on computer security applications. New York, NY, USA: ACM; 2016. p. 336–47. ACSAC ’16.
Dahl GE, Stokes JW, Deng L, Yu D. Large-scale malware
classification using random projections and neural networks. In: 2013 IEEE international conference on acoustics, speech and signal processing. IEEE; 2013. p. 3422–6.
Damodaran A, Troia FD, Visaggio CA, Austin TH, Stamp M. A comparison of static, dynamic, and hybrid analysis for malware detection. J Comput Virol Hacking Tech 2017;13(1):1– 12.
David OE, Netanyahu NS. Deepsign: Deep learning for automatic malware signature generation and classification. In: 2015 International Joint Conference on Neural Networks (IJCNN). 2015. p. 1–8.
Dini G, Martinelli F, Saracino A, Sgandurra D. MADAM: a Multi-level Anomaly Detector for Android Malware. Berlin, Heidelberg: Springer Berlin Heidelberg; 2012. p. 240–53.
Firdausi I, Lim C, Erwin A, Nugroho AS. Analysis of machine learning techniques used in behavior-based malware detection. In: 2010 second international conference on advances in computing, control, and telecommunication technologies. 2010. p. 201–3.
Gandotra E, Bansal D, Sofat S. Malware analysis and classification: a survey. J Inform Secur 2014;5:56–64. Huang W, Stokes JW. Mtnet: A multi-task neural network for
dynamic malware classification. In: Proceedings of the 13th international conference on detection of intrusions and malware, and vulnerability assessment, vol. 9721. New York, NY, USA: Springer-Verlag New York, Inc.; 2016. p. 399–418. DIMVA 2016.
Kohonen T. Self-organized formation of topologically correct feature maps. Biol Cybern 1982;43(1):59–69.
Kohonen TK. Essentials of the self-organizing map. Neural Netw 2013;37:52–65.
Kolosnjaji B, Zarras A, Webster G, Eckert C. Deep learning for classification of malware system call sequences. In: Australasian joint conference on artificial intelligence. Springer; 2016. p. 137–49.
Moser A, Kruegel C, Kirda E. Limits of static analysis for malware detection. In: 23rd Annual Computer Security Applications Conference (ACSAC2007), December 10–14, 2007. Miami Beach, Florida, USA: 2007. p. 421–30.
Nataraj L, Yegneswaran V, Porras P, Zhang J. A comparative assessment of malware classification using binary texture analysis and dynamic analysis. In: Proceedings of the 4th ACM workshop on security and artificial intelligence. New York, NY, USA: ACM; 2011. p. 21–30. AISec ’11.
Pascanu R, Stokes JW, Sanossian H, Marinescu M, Thomas A. Malware classification with recurrent networks, 2015 I. EEE International Conference on Acoustics, Speech and Signal Processing (ICASSP). 2015. p. 1916–20.
Ranveer S, Hiray S. Article: comparative analysis of feature extraction methods of malware detection. Int J Comput Appl 2015;120:1–7. Full text available.
Saxe J, Berlin K. Deep neural network based malware detection using two dimensional binary program features. In: 2015 10th International Conference on Malicious and Unwanted Software (MALWARE). 2015. p. 11–20.
Scaife N, Carter H, Traynor P, Butler KRB. Cryptolock (and drop it): Stopping ransomware attacks on user data. In: 2016 IEEE 36th International Conference on Distributed Computing Systems (ICDCS). 2016. p. 303–12.
Shibahara T, Yagi T, Akiyama M, Chiba D, Yada T. Efficient dynamic malware analysis based on network behavior using deep learning. In: 2016 IEEE Global Communications Conference (GLOBECOM). 2016. p. 1–7.
Smith AJ. Applications of the self-organising map to reinforcement learning. Neural Netw 2002;15:1107–24. Tian R, Islam R, Batten L, Versteeg S. Differentiating malware
from cleanware using behavioural analysis. In: 2010 5th international conference on malicious and unwanted software. 2010. p. 23–30.
Tobiyama S, Yamaguchi Y, Shimada H, Ikuse T, Yagi T. Malware detection with deep neural network using process behavior. In: 2016 IEEE 40th annual Computer Software and
Applications Conference (COMPSAC), vol. 2. 2016. p. 577–82. Virvilis N, Gritzalis D. The big four – what we did wrong in
advanced persistent threat detection? In: Proceedings of the 2013 international conference on availability, reliability and security. Washington, DC, USA: IEEE Computer Society; 2013. p. 248–54. ARES ’13.
Wiesel TN, Hubel DH. Effects of visual deprivation on morphology and physiology of cells in the cats lateral. J Neurophysiol 1963;26:978–93.
Yoo I. Visualizing windows executable viruses using self-organizing maps. In: Proceedings of the 2004 ACM workshop on visualization and data mining for computer security. New York, NY, USA: ACM; 2004. p. 82–9. VizSEC/DMSEC ’04. Yuan Z, Lu Y, Xue Y. Droiddetector: android malware
characterization and detection using deep learning. Tsinghua Sci Technol 2016;21(1):114–23.
Pete Burnapis a Reader (Associate Professor) at Cardiff
Univer-sity and is seconded to Airbus Group to lead Cyber Security Analytics Research – heading projects involving the application of Artificial Intelligence, Machine Learning and Statistical Modeling to Cyber Security problems (most recently malware analysis). Pete ob-tained his B.Sc. in Computer Science in 2002 and his Ph.D: Advanced
Access Control in support of Distributed Collaborative Working and De-perimeterization in 2010, both from Cardiff University. He has published more than 60 academic articles stemming from funded research projects worth over £8m and has advised the Home Affairs Select Committee, Home Office and Metropolitan Police on socio-technical research outcomes associated with cyber risk and evolving cyber threats.
Richard Frenchis Research Scientist/Engineer in Cyber Security
Innovation at Airbus, a global network of; teams, projects and collaborations that undertake; research, innovation and state of the art cyber security solutions development. Richard obtained his B.Sc. in computer science with artificial intelligence in 1998 and his Ph.D in biologically-motivated learning in autonomous robots in 2002, both from the University of Southampton. Addi-tionally, he spent his postdoctoral research time at the Adaptive Systems Research Group, University of Hertfordshire, exploring the application of neuromodulation to neurorobotics in 2004. His primary areas of research interest are artificial life and machine intelligence.
Frederick Turneris a student at the University of York, reading for
an Mmath degree in Computer Science and Mathematics, due to graduate in 2019. He is enjoying spending a year of his studies at Airbus Group Innovations, working in the Product and Cyber Se-curity Research team, which specialises in research into the protection of cyber-physical (SCADA) systems. His work is primar-ily focussed on the development of behaviour based machine learning models for malware classification, particularly on the imple-mentation of a classification platform using the technologies developed.
Kevin Jonesis Head of Cyber Security Architecture, Innovation and
Scouting at Airbus, leading a global network of; teams, projects and collaborations including; research & innovation, state of the art so-lutions development, and technology scouting for cyber security across; IT, ICS and product security domains. He holds a BSc in Com-puter Science and MSc in Distributed Systems Integration from De Montfort University, Leicester where he also obtained his PhD: A Trust Based Approach to Mobile Multi-Agent System Security in 2010.
He is active in the cyber security research community, has pub-lished numerous papers and holds a number of patents within the domain. Kevin is an advocate and champion for cyber security in academia, development of cyber skills and for multi-disciplinary research.