Development of a simple artificial
intelligence method to accurately subtype
breast cancers based on gene expression
barcodes
Fanechka N. Esterhuysen
A thesis submitted in partial fulfilment of the requirements for the degree of MAGISTER SCIENTIAE (M.Sc.)
South African National Bioinformatics Institute (SANBI) University of the Western Cape
Supervisor: Professor Junaid Gamieldien
KEYWORDS
Microarray RNA-SeqGene Expression Barcode Feature Selection
Machine Learning Support Vector Machine Gene Signature
ABBREVIATIONS
ANN Artificial Neural Network
cDNA Complementary DNA
DNA Deoxyribonucleic Acid
DNA-Seq DNA Sequencing
ER-positive Estrogen Receptor Positive (breast cancer) fRMA Frozen Robust Multiarray Analysis
FS Feature Selection
GC-RMA GeneChip Robust Multiarray Analysis
GExB Gene Expression Barcode
GTEx project Genotype-Tissue Expression project
HER2-postive Human Epidermal Growth Factor Receptor 2 Positive (breast cancer)
kNN k-Nearest Neighbours
MC-OVO-SVM Multiclass One-versus-One Support Vector Machine MC-OVR-SVM Multiclass One-versus-Rest Support Vector Machine
ML Machine Learning
mRNA Messenger RNA
NGS Next Generation Sequencing
NN Neural Network
ONT Oxford Nanopore Technologies
PacBio Pacific Biosciences
PCR Polymerase chain reaction
RMA Robust Multiarray Analysis
RNA Ribonucleic Acid
RNA-Seq RNA Sequencing
rtPCR Real-Time PCR
SOM Self-Organizing Maps
SVM Support Vector Machines
TCGA The Cancer Genome Atlas
ABSTRACT
INTRODUCTION: Breast cancer is a highly heterogeneous disease. The complexity of achieving an accurate diagnosis and an effective treatment regimen lies within this heterogeneity. Subtypes of the disease are not simply molecular, i.e. hormone receptor over-expression or absence, but the tumour itself is heterogeneous in terms of tissue of origin, metastases, and histopathological variability. Accurate tumour classification vastly improves treatment decisions, patient outcomes and 5-year survival rates. Gene expression studies aided by transcriptomic technologies such as microarrays and next-generation sequencing (e.g. RNA-Sequencing) have aided oncology researcher and clinician understanding of the complex molecular portraits of malignant breast tumours. Mechanisms governing cancers, which include tumorigenesis, gene fusions, gene over-expression and suppression, cellular process and pathway involvement, have been elucidated through comprehensive analyses of the cancer transcriptome. Over the past 20 years, gene expression signatures, discovered with both microarray and RNA-Seq have reached clinical and commercial application through the development of tests such as Mammaprint®, OncotypeDX®, and FoundationOne® CDx, all which focus on chemotherapy sensitivity, prediction of cancer recurrence, and tumour mutational level.
The Gene Expression Barcode (GExB) algorithm was developed to allow for easy interpretation and integration of microarray data through data normalization with frozen RMA (fRMA) preprocessing and conversion of relative gene expression to a sequence of 1's and 0's. Unfortunately, the algorithm has not yet been developed for RNA-Seq data. However, implementation of the GExB with feature-selection would contribute to a machine-learning based robust breast cancer and subtype classifier.
METHODOLOGY: For microarray data, we applied the GExB algorithm to generate barcodes for normal breast and breast tumour samples. A two-class classifier for malignancy was developed through feature-selection on barcoded samples by selecting for genes with 85% stable absence or presence within a tissue type, and differentially stable between tissues. A multi-class feature-selection method was employed to identify genes with variable expression in one subtype, but 80% stable absence or presence in all other subtypes, i.e. 80% in n-1
subtypes.
For RNA-Seq data, a barcoding method needed to be developed which could mimic the GExB algorithm for microarray data. A z-score-to-barcode method was implemented and differential gene expression analysis with selection of the top 100 genes as informative features for classification purposes.
The accuracy and discriminatory capability of both microarray-based gene signatures and the RNA-Seq-based gene signatures was assessed through unsupervised and supervised machine-learning algorithms, i.e., K-means and Hierarchical clustering, as well as binary and multi-class Support Vector Machine (SVM) implementations.
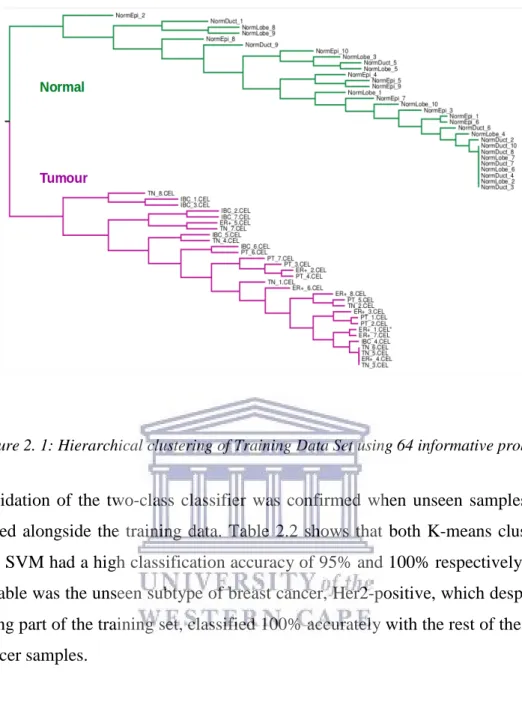
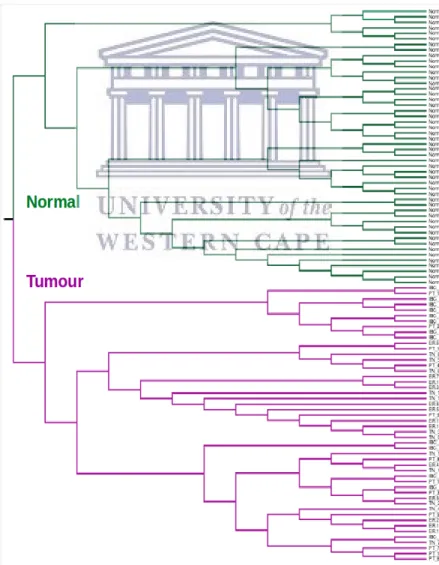
RESULTS: The GExB-FS method for microarray data yielded an 85-probe and 346-probe informative set for two-class and multi-class classifiers, respectively. The two-class classifier predicted samples as either normal or malignant with 100% accuracy and the multi-class classifier predicted molecular subtype with 96.5% accuracy with SVM.
Combining RNA-Seq DE analysis for feature-selection with the z-score-to-barcode method, resulted in a two-class classifier for malignancy, and a multi-class multi-classifier for normal-from-healthy, normal-adjacent-tumour (from cancer patients), and breast tumour samples with 100% accuracy. Most notably, a normal-adjacent-tumour gene expression signature emerged, which differentiated it from normal breast tissues in healthy individuals.
CONCLUSION: A potentially novel method for microarray and RNA-Seq data transformation, feature selection and classifier development was established. The universal application of the microarray signatures and validity of the z-score-to-barcode method was proven with 95% accurate classification of RNA-Seq barcoded samples with a microarray discovered gene expression signature. The results from this comprehensive study into the discovery of robust gene expression signatures holds immense potential for further R&F towards implementation at the clinical endpoint, and translation to simpler and cost-effective laboratory methods such as qtPCR-based tests.
DECLARATION
I declare that Development of a simple artificial method to accurately subtype breast cancers based on gene expression barcodes is my own work, that it has not been submitted for any degree or examination in any other university, and that all the sources I have used or quoted have been indicated and acknowledged by complete references.
Full name: Fanechka Naomi Esterhuysen
Date: December 2018
CONTENTS
KEYWORDS ... i ABBREVIATIONS ... ii ABSTRACT ... iii DECLARATION ... v CONTENTS ... vi List of Figures ... xiList of Tables... xii
Chapter 1 ... 1
Literature Review ... 1
1.1 Machine Learning ... 1
1.1.1 Different Machine Learning classifiers and algorithms ... 2
1.1.1.1 K-means clustering... 2
1.1.1.2 Hierarchical Clustering ... 3
1.1.1.3 Neural Networks ... 5
1.1.1.4 Self-Organizing Maps (SOMs) ... 6
1.1.1.5 Support Vector Machines (SVMs) ... 6
1.1.1.5.1 Binary SVMs ... 7
1.1.1.5.2 Multi-class SVMs ... 8
1.2 Application of Machine Learning (ML) in Biomedical Scenarios ... 8
1.3 Feature Selection ... 9
1.3.2 Dimension reduction of expression microarray data using feature selection ……….11
1.4 Microarrays and Gene-expression signatures ... 11
1.4.1 Microarray Technology ... 11
1.4.2 Expression Profiling ... 12
1.4.3 Microarray data analysis ... 13
1.4.4 Frozen Robust Microarray Analysis (fRMA) ... 14
1.4.5 The Gene Expression Barcode algorithm ... 15
1.4.6 Gene expression profiling in Breast Cancer... 17
1.4.7 Prognostic gene expression profiling ... 17
1.5.1 RNA-Seq Technology ... 18
1.5.2 RNA-Seq Data Analysis ... 19
1.5.3 Application of RNA-Seq within Cancer Studies ... 20
1.5.4 Prognostic and Diagnostic Gene Expression Profiling ... 20
1.6 Breast Cancer: Molecular Subtyping through Gene Expression Analysis ……….21
1.7 Research Rationale ... 21
1.8 Aims and Objectives ... 22
1.8.1 The application of the GExB to Micro-array data ... 23
1.8.2 The development of a barcoding method for RNA-sequencing data, comparable to the GExB algorithm ... 23
Chapter 2 ... 25
A Two-Class Breast Cancer Classifier for Malignancy ... 25
ABSTRACT ... 25
2.1 Introduction ... 26
2.1.1 Breast Cancer Classification ... 26
2.1.2 Gene Expression Profiling ... 27
2.1.3 Microarray Data Analysis simplified with The Gene Expression Barcode (GExB) algorithm ... 28
2.1.4 Feature Selection for Classification ... 29
2.1.5 Study Aims and Objectives ... 29
2.2 Methods and Materials ... 30
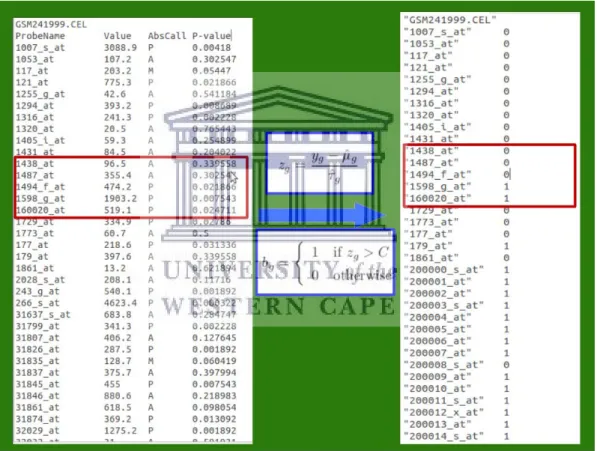
2.2.1 Data Curation ... 30
2.2.2 Gene Expression Barcode (GExB) implementation and data integration ... 32
2.2.3 Feature selection... 33
2.2.4 Machine learning classifier based evaluation of the signatures ... 35
2.2.4.1 K-means and Hierarchical clustering ... 35
2.2.4.2 Support Vector Machines (SVM) ... 35
2.3 Results ... 36
2.3.1 Phase I: Preliminary Method Design ... 36
2.3.1.1 Gene Expression Barcode-Feature Selection paired method (GExB-FS)………...36
2.3.1.2 Machine Learning: K-means, Hierarchical clustering, SVM... 36
2.3.2 Phase II: Method Optimization ... 38
2.3.2.1 Gene Expression Barcode-Feature Selection paired method (GExB-FS)………...38
2.3.2.2 Machine Learning: K-means, Hierarchical clustering, SVM... 39
2.4 Discussion ... 40
2.5 Conclusion ... 44
Chapter 3 ... 46
A Multi-Class Breast Cancer Classifier for Molecular Subtyping... 46
ABSTRACT ... 46
3.1 Introduction ... 47
3.1.1 Breast Cancer and Personalized Medicine ... 47
3.1.2 Multi-class Classification and predictive modelling ... 49
3.1.3 Implementing Frozen Robust Multi-array Analysis (fRMA) and the Gene Expression Barcode (GExB) algorithm for microarray gene expression data………..50
3.1.4 Machine Learning and Feature selection for Breast Cancer Classification ... 50
3.1.5 Aims and Objectives ... 51
3.2 Materials and Method ... 52
3.2.1 Data Curation ... 52
3.2.2 Gene Expression Barcode (GExB) implementation and data integration ... 53
3.2.3 Feature selection and application to datasets ... 54
3.2.3.1 Phase I: Preliminary Phase - Method Development ... 54
3.2.3.2 Phase II: Method Optimization ... 55
3.2.4 Machine Learning classifier evaluation ... 55
3.2.5 K-means and Hierarchical clustering ... 56
3.2.6 k-Nearest Neighbour classification ... 56
3.2.7 Multi-class Support Vector Machines (SVM) classification ... 57
3.3 Results ... 57
3.3.1 Phase I: Preliminary Method Development ... 57
3.4 Discussion ... 61
3.5 Conclusion ... 64
Chapter 4 ... 65
A Multi-Class Classifier for RNA-Seq Breast Cancer Data ... 65
ABSTRACT ... 65
4.1 Introduction ... 67
4.1.1 RNA-Sequencing and Cancer ... 67
4.1.2 Breast Cancer Transcriptomics ... 67
4.1.3 Public Transcriptomic Data ... 68
4.1.4 The Cancer Genome Atlas (TCGA) ... 68
4.1.5 The Genotype-Tissue Expression (GTEx) project ... 69
4.1.6 Research Aims and Objectives... 69
4.2 Materials and Methods ... 70
4.2.1 Data Curation ... 70
4.2.2 Discovery of Differentially Expressed Genes (DEGs) ... 72
4.2.3 Paired TCGA Samples ... 72
4.2.4 Integrated GTEx and TCGA datasets ... 73
4.2.5 Separation of GTEx normal from TCGA normal-adjacent-tumour 73 4.2.6 Z-Score Barcoding of RNA-Seq count data ... 74
4.2.7 Z-score Barcoding of unpaired TCGA and GTEx samples ... 74
4.2.8 Unsupervised Machine Learning: Hierarchical and K-means Clustering ... 75
4.2.9 Supervised Machine Learning: Support Vector Machines ... 76
4.3 Results ... 76
4.3.1 Feature set discovery in a paired TCGA normal-tumour dataset .... 76
4.3.2 Feature set discovery in an integrated GTEx-TCGA dataset ... 82
4.3.3 Feature set discovery for multi-class classification of a GTEx normal, TCGA normal-adjacent-tumour and TCGA primary tumour integrated dataset ... 82
4.3.4 Z-scores and “Barcoding” RNA-Seq gene counts ... 83
4.3.5 Machine Learning classification ... 84
4.3.5.2 Clustering and SVM classification of GTEx-TCGA integrated
data………..85
4.3.5.3Multi-class classification of healthy breast, normal-adjacent-tumour (NAT) and primary tumour tissues ... 85
4.4 Discussion ... 89
4.5 Conclusions ... 93
CHAPTER 5 ... 94
Conclusions and Future Work ... 94
5.1 Conclusion ... 94
5.2 Discovered signatures are applicable across technologies ... 95
5.3 Future Work ... 96
6 References ... 97
7 Appendices ... 117
Appendix I ... 117
Appendix II ... 126
GTEx Data Curated ... 126
Appendix III ... 134
List of Figures
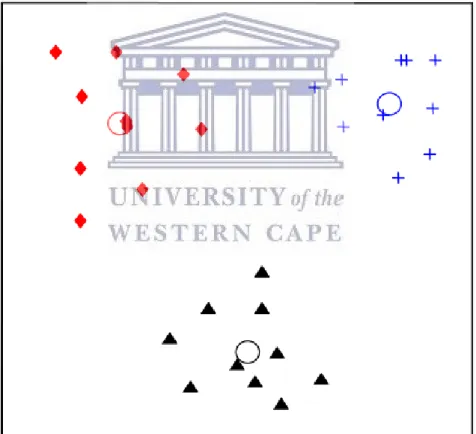
Figure 1. 1: An example of K-means clustering where k = 3 (Jain, 2009) ... 4 Figure 1. 2: An example of a dendogram generated from hierarchical clustering. (Jain, 2009) ... 5 Figure 1. 3: An example of a binary, two-class SVM with hyperplane construction (Statnikov et al., 2005). ... 7 Figure 2. 1: Example of expression calls from a micro-array converted to an absolute call by use of the Gene Expression Barcode algorithm. ……….33 Figure 2. 2: Hierarchical clustering of Training Data Set using 64 informative probe set ... 37 Figure 2. 3: Hierarchical clustering of Training Data Set using 85 informative probe set ... 39 Figure 3. 1. : Hierarchical clustering of Training Data Set using 346-gene signature………..58 Figure 4. 1: Hierarchical clustering of “barcoded” TCGA Normal-Adjacent-Tumour (NAT) and TCGA Primary Normal-Adjacent-Tumour (Normal-Adjacent-Tumour) Unpaired RNA-Seq samples (n = 100) yielded 98% accuracy when classified using the Top 100 DEG's discovered using 40 paired Normal-Adjacent-Tumour and Tumour samples. ... 80 Figure 4. 2: Hierarchical clustering of “barcoded” TCGA Normal-Adjacent-Tumour (NAT) and TCGA Primary Normal-Adjacent-Tumour (Normal-Adjacent-Tumour) Unpaired RNA-Seq samples (n = 100) yielded 100% accuracy when classified using the Top 100 DEG's discovered using 80 paired Normal-Adjacent-Tumour and Tumour samples. ... 81 Figure 4. 3: Z-Score Heatmap of Paired Normal-Tumour Samples using Top 100 DEGs as a feature set ... 84 Figure 4. 4: Barcode-based hierarchical clustering of 300 GTEx and TCGA samples, yielded 98% accuracy when classified with the Top 59-overlapping DEG’s (described in Sections 4.2.5 and 4.3.3). ... 86 Figure 4. 5: Barcode-based hierarchical clustering of 300 GTEx and TCGA samples, yielded 100% accuracy when classified with the Top 216-overlapping DEG’s (described in Sections 4.2.5 and 4.3.3). ... 87 Figure 4. 6: Heatmap of 59 DEG's separating GTEx normal, TCGA NAT, and TCGA tumour tissues ... 89
List of Tables
Table 2. 1: Summary of Breast Cancer Samples curated ... 32
Table 2. 2: Validation of Preliminary Two-class Classifier ... 38
Table 2. 3: Validation of Optimized Two-class Classifier ... 40
Table 3. 1: Summary of Breast Cancer Samples curated………..53
Table 3. 2: Validation of Preliminary Multi-class Classifier ... 59
Table 3. 3: kNN Leave-Out-One Cross-Validation classification of Training dataset ... 60
Table 3. 4: One-versus-one Multi-Class SVM classification of Unseen Validation dataset ... 60
Table 4. 1: Summary of breast tissue samples curated from The Cancer Genome Atlas Data Repository………71
Table 4. 2: Top 50 DEG's extracted from differential expression analysis of 80 paired TCGA NAT and Primary Tumour samples ... 78
Table 4. 3: Classification results of TCGA Normal-Adjacent-Tumour (NAT) and TCGA Primary Tumour (Tumour) Unpaired RNA-Seq samples (n = 140) ... 85
Table 4. 4: Classification results of GTEx Normal (Normal) and TCGA Primary Tumour (Tumour) Test RNA-Seq samples (n = 100) ... 85
Table 4. 5: Classification results of GTEx Normal (Normal), TCGA Normal-Adjacent-Tumour (NAT) and TCGA Primary Tumour (Tumour) RNA-Seq samples with Validation dataset ... 88
Table 4. 6: Overlap of Top DEG’s: SVM classification with Validation dataset ..88
Table 7. 1: Microarray breast tissue samples curated………..117
Table 7. 2: Normal breast tissue samples filtered from GTEx Version 7 Gene Counts file ... 126
Table 7. 3: Paired TCGA NAT and Primary Tumour Samples ... 134
Table 7. 4: Unpaired TGCA NAT Samples ... 136
Chapter 1
Literature Review
The pairing of biological data and computational algorithms has contributed to new classification models of cancer. Past and current high throughput analysis of cells and tissues is revolutionizing biomedical and biological research. Completion of the whole human genome, discoveries of gene sequence and annotation along with the development of microarray technology, and more recently, next-generation sequencing (NGS) technologies, over the past 15 years has seen characterization of cells and tissues in greater depth. Although our knowledge of the human genome has improved vastly, genomic data does not provide enough information on the differentiation of cell types, while Transcriptomic data has proven to be more informative. Despite these advancements, there have been little to no big advances in diagnosis or treatment (McCall, Uppal, Jaffee, Zilliox, & Irizarry, 2011; Zilliox & Irizarry, 2007a).
The vast amount of publicly available gene expression data has seen a move towards classification models for cancer from gene expression profiling. The profiling entails examination of the differential expression of genes and their unique combinations in different states of the cancerous tissues and healthy tissue. Gene signatures have been developed which can predict cancer subtype and prognosis, such as Mammaprint® and Oncotype® DX. The robust nature of machine learning algorithms has accelerated and assisted the design of such signatures through application of the mathematical and data sciences to biomedical questions.
1.1Machine Learning
Machine learning encompasses the design and application of algorithms that enable the use of existing data to establish models for pattern recognition, classification and prediction (Alpaydin, 2010). The aim of automatic model construction approaches is to minimize human biases and errors that could skew selection and performance of the algorithm, while enabling the discovery of subtle
patterns and associations between data points. Over the years, machine learning techniques have become more pliable and have been expanding together with mathematical frameworks for measuring reliability. The coupling has led to improving the efficiency and accuracy of discoveries made in biology and understanding complex biological data (Sommer & Gerlich, 2013; Tarca, Carey, Chen, Romero, & Drǎghici, 2007).
Within machine learning, two exemplars exist; supervised and unsupervised learning. Supervised learning entails a sample or group using a feature set of attributes such as genes. The resultant classification scheme is a set of rules that designate objects based on the values of the features. The primary objective of supervised learning is to construct a system capable of accurately predicting the class “membership” of an object. Other than accurate classification of unknown objects, supervised machine learning also aims to be able to predict possible outliers in data; those instances that do not specifically match any of the predefined classes according to the features selected by the algorithms designed. An example of object-to-class assignments, in a biological setting, would be classification of tissue gene expression profiles to disease group (Libbrecht, Noble, & Genome, 2017).
Unsupervised learning, conversely, has no predefined class labels for the data to be studied. The aim instead is to simultaneously analyse the data and observe similarities between objects. The similarities observed, called clusters would define groups of objects. Hence, unsupervised learning's intention is to reveal naturally occurring groupings of objects based on the measurements of specific features in data (Yip, Cheng, & Gerstein, 2013)
1.1.1 Different Machine Learning classifiers and algorithms 1.1.1.1K-means clustering
Clustering algorithms are considered to be a form of unsupervised learning. Data instances that share similarities are grouped together. The algorithm can only access data about the features describing each object. However, in real
applications of clustering, the scientist usually has some knowledge about the dataset (Wagstaf, Cardie, Rogers, & Schroedl, 2001). Data clustering can be separated into two types, namely hierarchical and partitional clustering.
K-means clustering is classified as a partitional clustering algorithm. The method finds a partition that separates data (Jain & Dubes, 1988) by minimizing the squared error between the emperical mean of a cluster and the data instances, called points, of the said cluster. The main aim of the K-means algorithm is to minimize the squared error of all the clusters specified for a given dataset being investigated for classification (Drineas, Frieze, Kannan, Vempala, & Vinay, 2004).
The algorithm first selects k initial clusters, then for a specific data instance, x, assigns it to the closest related cluster centers. Every time a new data instance is added to the dataset, the cluster center is re-computed to be the average (mean) of its constituent data instances. K-means converges when there are no changes made to the clusters formed; the squared error of the cluster's mean is minimized and the cluster is centred (MacQueen, 1967).
Distance metrics are used to compute the distance between related samples or data instances in a cluster and also the distance between the different clusters. Euclidean distance, a metric based on the Pythagoras theorem of points in a dimensional plane, is applied in K-means clustering (Mao & Jain, 1996).
1.1.1.2Hierarchical Clustering
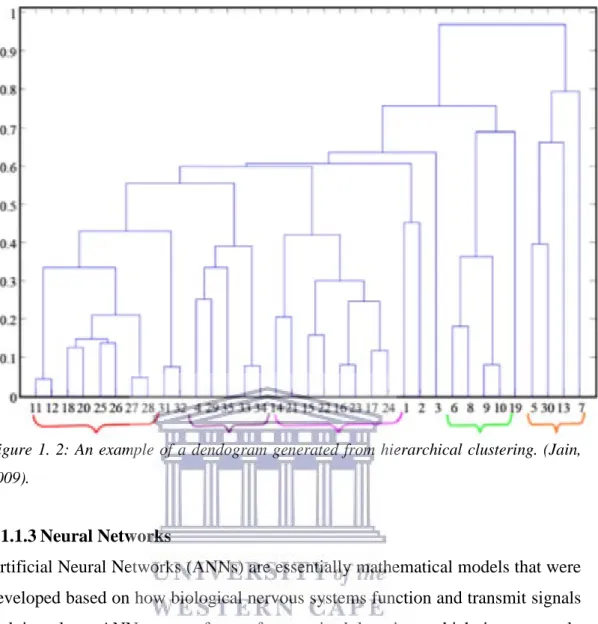
Hierarchical clustering is based on variants of primarily three algorithms; single-link (King, 1967), complete-single-link (Sneath & Sokal, 1962), and multi-variance (Murtagh, 1984; Ward, 1963). The two most broadly used algorithms in hierarchical clustering are single-link and complete-link, however, the two algorithms are distinctive in the manner in which they separate and characterize clusters of similarity. The hierarchy of clusters formed from the single-link algorithm can easily be used to construct dendograms; allowing the easy
visualization of clusters formed. The visualization of hierarchical clustering is depicted in a tree-like format, a dendogram, and branches correlate to the data instances being clustered (D’haeseleer, 2005), with closely related data clustering together as one big branch. Dendograms are particularly useful for classification applications within biological settings.
Nested clusters, data instances or samples branching from the main branches of the dendogram, are found either in an agglomerative or a divisive manner. The agglomerative mode entails starting with each data point in its own cluster and merging the most similar clusters in successive order to form a hierarchy. The divisive mode separates and organizes all data points from a single large cluster into smaller clusters (Jain, 2010).
Figure 1. 1: An example of K-means clustering where k = 3 (Jain, 2009.
Figure 1. 2: An example of a dendogram generated from hierarchical clustering. (Jain, 2009).
1.1.1.3Neural Networks
Artificial Neural Networks (ANNs) are essentially mathematical models that were developed based on how biological nervous systems function and transmit signals and impulses. ANNs are a form of supervised learning, which is commonly categorised as semi-supervised learning. It uses a feed forward network; signals which can be represented by variables such as genes which are either mutated or gene expression levels of a specific cell, are inseminated through the layers of units. The units referred to mimic neurons, and are referred to as nodes (Abraham, 2005).
Usually three units make up the network; (1) an input layer, which is in most cases fed with gene expression data, (2) a hidden layer(s) of units, and (3) an output layer, one for each classification of tissue, in a biological instance (Mitchell, 1997). The connections formed between the layers are assigned weights, which are adjusted during the training phase of machine learning. With
propagation neural networks, the algorithm adjusts the weights by back-propagating the error between the units until the best fit for the training data is found (Statnikov, Aliferis, Tsamardinos, Hardin, & Levy, 2005). The weights are modelled on neuronal synapses and input signals are disseminated in a non-linear fashion as to simulate how signals are transmitted by neurons (Abraham, 2005).
Commonly used NN algorithms include Forward Propagation, Back Propagation, and Probabilistic Neural Networks (Mitchell, 1997).
1.1.1.4Self-Organizing Maps (SOMs)
SOMs can be viewed as a derivative of Artificial Neural Networks. Data dimension reduction is the main objective of SOMs and is primarily a qualitative data visualization tool. The algorithm learns the classification, topology and distribution of input vectors. Neurons or nodes are assigned according to the amount of input vectors. Nodes in close proximity to each other learn to respond to similar input data.
The algorithm is designed such that data regularities and correlations are detected; resulting in future response being adapted accordingly. Data visualization aims to solve humans' inability to visualize high-dimensional data through mapping data in a 1- or 2-dimensional space. SOMs generate maps that plot data instance similarities into clusters (Abraham, 2005). The machine learning application itself is unsupervised.
1.1.1.5Support Vector Machines (SVMs)
Support Vector Machines (SVM) was initially developed for two-class classification problems. The aim was to develop an algorithm capable of robust pattern recognition that would have high generalization ability with minimal errors in the training datasets. Polynomial and radial basis function equations were used to obtain optimal margins that would separate two classes within a training set (Cortes & Vapnik, 1995). SVM hasbeen shown to classify data with superior accuracy to other supervised machine learning algorithms like early ANN's and
ensemble classification methods (Statnikov et al., 2005). The applications of SVM's vary from text-categorization technologies (Joachims, 1998), to facial recognition software (Osuna, Freund, & Girosit, 2000), to biological implementation in disease classification like cancer and bacterial infections (Su et al., 2001).
1.1.1.5.1 Binary SVMs
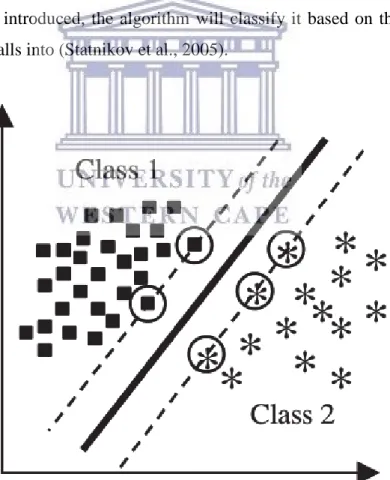
Support Vector Machines are considered one of the most reliable forms of machine learning (Furey et al., 2000). Initially designed for binary, or two-class classification, the algorithm maps data instances to a dimensional space. A maximum-margin margin hyperplane is then identified to separate training instances (Vapnik, 1998). The set of training instances used to construct the boundary or hyperplane, are referred to as support vectors. When an unknown data sample is introduced, the algorithm will classify it based on the side of the hyperplane it falls into (Statnikov et al., 2005).
Figure 1. 3: An example of a binary, two-class SVM with hyperplane construction (Statnikov et al., 2005).
1.1.1.5.2 Multi-class SVMs
Multi-class SVMs arose as the need for multi-category classification for disease and industry arose. The most commonly used amendments of the binary SVM algorithms are the One-versus-Rest (OVR) and the One-versus-One (OVO) adaptations (Ulrich, 1999). The OVR method constructs k binary SVM classifiers: class 1 (positive) versus all the other classes and proceeds to do the same for all k classes in the experiment. The combined decision function would correlate to the maximum value of k binary decision functions. The OVO method, builds binary classifiers for all pairs of classes. Subsequently, a binary problem is solved: a decision function assigns an instance to a class with the largest number of votes. Recent studies have revealed that the OVR multi-class SVM algorithm has superior classification performance which is further enhanced when feature-selection methods are applied to data preceding SVM classification (Statnikov et al., 2005).
1.2Application of Machine Learning (ML) in Biomedical Scenarios
Machine learning has the ability to solve classification problems in real world medical diagnosis. The development of algorithms such as Artificial Neural Networks (NN), Decision Trees, k-Nearest Neighbour (kNN), and Support Vector Machines (SVM) have assisted in both disease diagnosis and classification but also the interpretation of biological data from technologies like PCR, Microarray assays, and DNA- and RNA-sequencing data (Kourou, Exarchos, Exarchos, Karamouzis, & Fotiadis, 2015).
Bioinformatics has been able to make progress in fields relating to disease diagnosis and mechanism through genomic and proteomic function prediction. Applications of machine learning to systems biology include: protein-coding genes, protein function prediction, protein-RNA interactions (Caragea & Honavar, 2009), and the impact of these genetic factors on cell regulation and function.
Machine learning has been applied extensively in cancer classification from gene expression profiles (Kourou et al., 2015).
Artificial intelligence has been used in cancer prediction and prognosis for more than 25 years; predominantly with applications of NN's and decision trees (Cichetti, 1992). The diagnosis of cancers is not only achieved through gene expression analysis, but also from tumour biopsy histopathological examinations, X-rays and CRT images. Machine learning algorithms have contributed to accurate classification of tumours using data from all of these technologies (Liotta & Petricoin, 2000; Zhou, Liu, & Wong, 2004). The accurate prediction of cancer susceptibility and diagnosis, which integrates both macro (physical) and microscopic (genetic) data, has vastly improved through the application of machine learning algorithms. Furthermore, ML has assisted in the identification of novel disease biomarkers and drug targets (Cruz & Wishart, 2006).
1.3 Feature Selection
Irrelevant information is part of raw data generated from biological studies (Guyon, Weston, Stephen, & Vapnik, 2002). The need for Feature Selection (FS) techniques in bioinformatics has therefore grown in recent years, as it is now a requirement in the building of models for real-world applications. Originally, the designs for pattern recognition software were not built to manage large amounts of data. Due to the high dimensionality of biological data used in computational biology, dimension reduction is implemented to facilitate the interpretation of data. Feature selection offers dimension reduction without the loss of the original data representation, and merely selects a subset of the definitive properties of a data instance, e.g. genes expressed. FS can be applied to both supervised and unsupervised machine learning algorithms and classifiers (Liu & Yu, 2005).
The three main aims of FS approaches include: (1) to avoid over-fitting and improve model performance, (2) to provide faster and more cost-effective models, and (3) to gain deeper insight into the underlying processes that generated the data. Selection of features cannot be dependent of the parameters of the optimized machine learning algorithm applied or classification model under investigation. Idealistically, the optimal model parameters and optimal feature set are paired
(Daelemans & Hoste, 2002). Within classification schemes, there are three categories of FS methods; filter, wrapper and embedded methods. Each differ in how they are implemented with the construction of the classification model (Saeys, Inza, & Larrañaga, 2007).
1.3.1 Feature Selection techniques
Filter techniques evaluate the relevance of features by taking only intrinsic properties of the data into account. The approach calculates a feature relevance score, and low-scoring features are removed from the original feature set (Saeys et al., 2007). Features selected must be relevant for prediction, but redundant features should be minimized. Relevance criteria measures how well a feature, e.g. a gene expressed or microarray chip probe, distinguishes between classes of data. Criteria like Symmetric Uncertainty (SU), Spearman rank correlation coefficient (CC), Value Difference Metric (VDM), Fit Criterion (FC) measure how useful a variable is for predicting the class of a data instance (Auffarth, 2010). Thereafter, the set of features selected are presented as input to the classification algorithm.
Wrapper techniques embed the model hypothesis search within the feature subset search. With wrapper methods, a search protocol in the space of possible feature subsets is defined, and various subsets of features are generated and evaluated. The evaluation of a specific subset of features is obtained by training and testing a specific classification model, rendering this approach tailored to a specific classification algorithm. To search the space of all feature subsets, a search algorithm is then ‘wrapped’ around the classification model.
With embedded techniques, the search for an optimal subset of features is built into the classifier construction itself, and can be seen as a search in the combined space of feature subsets and hypotheses. This method interacts with the classifier and is better computationally when compared to wrapper methods. The embedded approach is also capable of modelling feature dependencies. As with wrapper approaches, embedded approaches are thus specific to a given learning algorithm
(Saeys et al., 2007).
1.3.2 Dimension reduction of expression microarray data using feature selection
Univariate filter techniques are most favoured in dimension reduction of microarray data. The method is fast and efficient, yet simple. In comparative studies of different classification algorithms paired with feature selection, the filter method is most prevalent in evaluation and investigation of DNA and mRNA microarray datasets (Dudoit, Fridlyand, & Speed, 2002; J. W. Lee, Lee, Park, & Song, 2005; Li, Zhang, & Ogihara, 2004). Reasons for this include; the output of feature ranking is easy to understand, the gene-ranking output fulfils the objectives of bio-domain experts that want to validate results in laboratories, and short computation time for data analysis (Saeys et al., 2007).
However, univariate approaches have restrictions, and in some instances lead to less accurate classifiers as they ignore gene-gene interactions. FS techniques using wrapper or embedded methods, can offer a way to perform multivariate gene subset selection (Saeys et al., 2007). Hybrid methods that incorporate univariate pre-selection with multivariate altered wrapper methods have also been proposed in the case of cancer classification (Ruiz, Riquelme, & Aguilar-Ruiz, 2006).
1.4Microarrays and Gene-expression signatures 1.4.1 Microarray Technology
Microarray chips are designed to generate gene expression measures from cell and tissue samples by using cellular mRNA to elucidate gene up-regulation and down-regulation in different tissues; ranging from biological to agricultural settings. Nucleic acid microarrays make use of short oligonucleotides (15-25 nt), long oligonucleotides (50-120 nt), and PCR-generated complimentary DNA (cDNAs) (100-3000 base pairs) as array elements (Miller & Tang, 2009; Stears, Martinsky, & Schena, 2003).
expression analysis. However, each has its own drawback. Short oligonucleotides can lack single-gene specificity in complex hybridizations. On the other hand, PCR-generated cDNAs produce strong signals and high specificity (Schena, 1996; Lockhart et.al., 1996; Yuen et.al., 2002). Long oligonucleotides produce strong hybridization signals, good specificity and the ability to unambiguously identify transcripts within samples; but are dependent on the availability of genomic sequence information for each species under study (Kane et.al., 2000).
Expansion of traditional microarrays into exon arrays has allowed for larger coverage of exon regions of genes, and has been termed as whole transcript arrays. This is also largely due to an increase in array features, by decreasing the number of probes (Okoniewski & Miller, 2008). Gene alternative splicing through hybridization of variant transcript isoforms is detectable by exon arrays, along with expression levels of each exon independently (Bemmo et al., 2008; Kapur, Xing, Ouyang, & Wong, 2007).
1.4.2 Expression Profiling
Quantitative gene expression data is generated by transcript profiling. In order for profiling to take place, one- or two-colour fluorescent schemes are implemented (R. J. Cho et al., 1998), and the most broadly used and easily interpreted scheme is two-colour fluorescence. Each RNA sample is labelled with two different fluorescent tags prior to hybridization with cDNA. Visualization of genes that are “activated” or “repressed” is produced from two-colour graphical superimposition. The two-colour graphic representation of probes expressing genes at different levels, allows the separation and comparison of various tissues based on their respective expression profiles. This process allows for the throughput of high quality gene expression data (S. M. Y. Lee et al., 2002).
Detection of fluorescent probes (tags attached to oligonucleotides/genes) is achieved with instruments that contain confocal optics, photomultiplier tubes, and charge-coupled devices. The detection instruments render graphical images in tagged-image file format (TIFF), which are two-dimensional, 16-bit numerical
representations of microarray surfaces with intensity values assigned. These numerical values are then interpreted as expression values of genes (Carr, Somogyi, & Michaels, 1997). The data collected is raw data, and sequentially further data analysis which includes transformation and normalization of data is necessary for extrapolation of biologically significant knowledge from machine learning algorithm applications and microarray analysis software (Stears et al., 2003).
1.4.3 Microarray data analysis
In order for microarray data to become useful in biological settings, a wide range of data analysis and processing is required. The two most important components of the analysis are design and pre-processing. Both are necessary steps preceding the classification of genes, cells and tissues, as well as validation of data (Allison, Cui, Page, & Sabripour, 2006).
Design: How the microarray experiments and the relevant study is designed impacts efficiency and validity of experiments. Within the design of a study, there are certain optimization steps that can be employed (Kerr, 2003). Firstly, biological replication is imperative. There are two forms of replication which can be applied to microarray experiments, which include technical and/or biological replication (Churchill, 2002; Yang, Buckley, & Speed, 2001). Secondly, the pooling of biological samples may further assist design optimization. This is due to the fact that when trying to ascertain and identify differential gene expression, high data variability can be eliminated from a study (Kendziorski, Irizarry, Chen, Haag, & Gould, 2005). And thirdly, avoiding confounding by extraneous factors is vital. When such factors vary with the independent variable of the experiment, it may yield confusing and erroneous conclusions of a study (Kerr, 2003).
Preprocessing: Image analysis and data normalization and transformation form part of pre-processing. These steps are required in order to remove systematic variation in the data. Normalization of data from different experiments and chip platforms is necessary to account not only for background noise (mismatched
probes), but also technical variance of fluorescence readings, which infer up- and down-regulation of gene expression, of microarray chips. Data transformation typically describes mathematical formulas being applied to data to change the format. Most often, log2 is applied to numerical values produced from micro-array detection technologies (Allison et al., 2006).
The most broadly applied micro-array data normalisation algorithm used is called robust multi-array average (RMA), designed for use on Affymetrix and Nimblegen microarray platforms (Irizarry, Bolstad, et al., 2003). The algorithm corrects data for background noise by transforming the data. Normalization by the algorithm is performed with a formula that uses normal distribution and a linear model to estimate expression values on a log scale). An alteration to RMA is GCRMA, which corrects for the GC content of the oligonucleotides used in the initial microarray chip experiment (Bolstad, Irizarry, Åstrand, & Speed, 2003).
1.4.4 Frozen Robust Microarray Analysis (fRMA)
The use of gene expression microarray experiments has become broadly used for research in biological studies. Methods for data analysis have had to adapt to the various aspects that affect micro-array data, such as batch effects, noise and reproducibility of experiments. Micro-array analysis consists firstly, of preprocessing the probe-level fluorescent readings to gene-level expression estimates. This initial step requires algorithms to resolve multiple or batches of arrays together (Bolstad et al., 2003). Despite the robust nature of the RMA algorithm, the multi-array processing complicates and limits inquiry (Ramasamy, Mondry, Holmes, & Altman, 2008). To process individual array experiments is computationally expensive, and introducing data from single arrays cannot be combined without introducing noise. This is a real dilemma for applying microarray technologies to clinical settings; the requirement is to extract actionable information from a single sample as opposed to a batch set of samples from an isolated experiment.
as it presented a method to pre-process individual array experiments, while retaining the advantages of batch array pre-processing (McCall, Bolstad, & Irizarry, 2010a). The basis of fRMA is simple; the parameter estimates are pre-computed on a massive and biologically diverse database of micro-array experiments, after which these parameters are frozen. This is then used to pre-process individual or low sample batches and later condensed for analysis.
1.4.5 The Gene Expression Barcode algorithm
The complexity of distinguishing tissues based on transcriptomic or microarray data is due to the use of relative expression of genes when reporting data, i.e. which genes are differentially expressed in one condition compared to others (Parkinson et al., 2009). Probe effects and noisy data obfuscate the correlation between observed probe intensity and actual expression of a transcript. Knowing absolute expression of genes, i.e. whether a gene is expressed or not, instead of relative expression of a gene in a tissue type would improve our understanding of systems and cellular biology, and provide a starting point for research targeting drug discovery and personalized medicine (McCall et al., 2011).
For the above reasons The Gene Expression Barcode project was established. The initial barcode algorithm, referred to as Barcode 1.0 (McCall et al., 2011) was based on a basic detection method and distance calculation. The rationale behind the algorithm was to develop the first method that could clearly demarcate expressed from silenced genes; and in so doing, denominate a specific or unique gene expression barcode for each tissue type. Vast numbers of raw microarray data was curated from publicly available datasets in the Gene Expression Omnibus (GEO) and ArrayExpress data repositories and pre-processed with the same algorithm. Clinical data from three cancer studies and one Alzheimer’s disease study was also collected. The aim was to evaluate which probe intensity relates to expression. Thereafter, the intensity distribution for each gene needed to be determined. Genes that are shown to be expressed would be classified as ones and silenced genes, as zeros. The sequence generated is referred to as the gene expression barcode (Zilliox & Irizarry, 2007a).
Due to the original barcode methodology only being able to provide absolute expression measures for a limited number of genes, the algorithm was extended to estimate transcriptomes (McCall et al., 2011). This is motivated by the fact that transcriptome data allows insight into what discriminates cell and tissue types, hence contributing to the classification of unknown biological samples. In order to clearly classify genes as silenced or expressed, one needs clear separation between high and low expression values. This is not the case in the majority of genes. The original barcode algorithm was further developed to determine a more extensive estimate of cell-type transcriptomes by calculating expression calls for all genes represented on the array. This was achieved by firstly, establishing a set of negative control experiments; secondly, by mass curation of publicly available microarray data from the Affymetrix Human Genome U133A (HGU133a), U133 Plus 2.0 (HGU133plus2) and Mouse Genome 430 2.0 (Mouse4302) platforms; and thirdly, applying the probability of expression (POE) model in a novel setting (Parmigiani, Garrett, Anbazhagan, & Gabrielson, 2002).
A new version of the algorithm resulted which produced standardized values; allowing for comparison across all genes. The standardized values may be translated into absolute expression calls; silenced or expressed genes by designation of a single threshold value. The resultant binary values correlating to expression calls is called the “barcode” (McCall et al., 2011). Although the Gene Expression Barcode Version 3.0 has been extended to include other sequencing platforms, a method for barcoding RNA-Seq expression or raw count data has not yet emerged (McCall et al., 2014).
One of the other differences in methodology that separates the Gene Expression Barcode from other absent/present call algorithms is the approach to microarray raw data pre-processing. The common analysis tool for micro-array data is RMA; Robust Micro-array Analysis, but the barcode algorithm implements an altered algorithm, called frozen Robust Micro-array Analysis (fRMA) (Mccall, Bolstad, & Irizarry, 2009).
1.4.6 Gene expression profiling in Breast Cancer
DNA-microarray technologies have provided researchers with the ideal tools and opportunities to perform comprehensive molecular and genetic profiling of breast cancer (Trevino, Falciani, & Barrera-Saldaña, 2007). Microarray techniques provide insights into cell biology as well as developing clinically useful classification models. This has allowed clinicians to predict, amongst others, disease recurrence and response to different treatments, which promises to improve disease management of cancer patients (Cooper, 2001).
1.4.7 Prognostic gene expression profiling
Over the past years, several breast cancer research groups have conducted gene-expression profiling studies with the objective of improving on traditional prognostic markers. Researchers from the Netherlands Cancer Institute in Amsterdam (NKI) reported a 70-gene prognostic signature (Mammaprint™) developed on the Agilent platform (Straver et al., 2010).
The sample size consisted of 78 systemically untreated lymph-node-negative breast cancers of patients younger than 55 years of age. A year later, Mammaprint™ was validated on a larger set of 295 young patients, this time with a mixed sample set. The NKI provided proof that the 70-gene signature was the strongest predictor for distant metastasis-free survival, independent of adjuvant treatment, tumour size, histological grade and age, both in node-negative and node-positive cohorts.
A similar study was done by a group in Rotterdam; generating a 76-gene signature that was able to determine the development of distant metastases in untreated patients of all age groups with node-negative breast cancer (Y. Zhang et al., 2009). The main difference between the Amsterdam and Rotterdam studies was the microarray platform used and the study design used in the development of the classifiers. Both classifiers appeared to be good predictors of the development of distant metastases within the first 5 years, but showed a decreased prognostic ability with the increasing number of follow-up years.
1.5Next-Generation Sequencing
Sanger sequencing emerged as a “first-generation” sequencing method, and was soon widely adopted (Sanger & Coulson, 1975). Next-generation sequencing (NGS) refers to second and third generation sequencing platforms which are able to simultaneously sequence millions to billions of sequence reads for transcriptome assemblies and analyses (Figueroa, Tang, & Taur, 2014). The past ten years has seen the rapid development of various platforms, with slightly differing techniques, for the high-throughput sequencing of genomes and transcriptomes (Levy & Myers, 2016).
1.5.1 RNA-Seq Technology
RNA-sequencing (RNA-Seq) is an NGS technique which directly sequences RNA transcripts present within a cell or sample (Kukurba & Montgomery, 2015). The exploratory capabilities of RNA-Seq allows for the quantification and detection of not only protein-coding RNAs, but also non-coding RNA, miRNA, siRNA, and small RNA classes involved in RNA stability, protein translation, or chromatin state modulation (Han, Gao, Muegge, Zhang, & Zhou, 2015; Trapnell, Pachter, & Salzberg, 2009). As a whole RNA-Seq has allowed for whole transcriptome sequencing and analysis, but may also be applied to differing extents depending on the objectives of the research question.
Library preparation and sequencing comprises of multiple steps, which rely on biochemical interactions of synthetic nucleotides, and enzymes typically involved in in vivo DNA replication and/or RNA transcription and translation. Different technologies (different companies) achieve this through different techniques: (a) Illumina HiSeq/MiSeq technologies incorporate reversible terminator chemistry - sequencing by synthesis is achieved through reversible terminator nucleotides labelled with a different fluorescent dye, and subsequent imaging detects the positioning of these synthetic nucleotides to infer DNA sequence (Ansorge, 2009). (b) Life Technologies SOLiD sequencing utilises ligation of dinucleotide probes with DNA ligase enzymes – 16 different dinucleotide probes (labelled by four different colours) are hybridized to a template sequence (RNA fragment),
with ligation cycles resetting the primer end to successfully add the correct nucleotide complementary to the template (Ku & Roukos, 2013).
Third-generation sequencing (TGS) emerged 5 years ago in the form of Pacific Biosciences (PacBio) Single Molecule Real Time (SMRT) platform, and Oxford Nanopore technologies (ONT) following closely (Weirather et al., 2017). Both sequencing platforms use a similar technique of detecting clonally amplified DNA, as the Illumina platform (Levy & Myers, 2016). (a) PacBio differs from Illumina in that it captures a single DNA molecule, and uses circular DNA templates with hairpin adapters ligated so that the polymerase reaction synthesises a complementary circular strand (Rhoads & Au, 2015). (b) ONT implements a nanopore-based single molecule. Single-stranded DNA (ssDNA) is directly sequenced, and uses a similar circular DNA template as PacBio. Sequencing occurs by “threading” of the DNA template through the nanopore, addition of a ligated hairpin adaptor, and a complementary strand built via molecular motor proteins (Laver et al., 2015). Both PacBio and ONT produce continuous long reads (CLR) attributed to the use of circular DNA templates (Rhoads & Au, 2015).
1.5.2 RNA-Seq Data Analysis
RNA-Seq produces thousands-to-millions of reads, i.e. sequence fragments, of varying lengths. Numerous Python and R packages have been developed specifically for the analysis of sequencing data. Prior to any biological investigation of the transcriptomic data generated, data pre-processing is performed. Quality assessment is the first step in bioinformatics RNA-Seq pipelines followed by mapping of the transcript fragments to a reference genome in order to ascertain the identity, location, and functions of the sequences (Han et al., 2015).
Following alignment of transcripts, gene expression is quantified by counting the number of transcript reads mapped to the respective reference genome location (Conesa et al., 2016). The gene counts generated from software like HTSeq-count
(Anders, Pyl, & Huber, 2015), or featureCounts (Liao, Smyth, & Shi, 2014) can be implemented for gene expression analysis, following normalization of raw count data. Furthermore, analysis of the aligned transcriptome can be employed to identify alternative splicing of genes, variant detection, pathway analysis through gene enrichment and discovery of gene co-expression networks (Han et al., 2015; Pereira, Imada, & Guedes, 2017).
1.5.3 Application of RNA-Seq within Cancer Studies
Due to the ability of RNA-Seq to reveal a cell or tissue's entire transcriptome, integrative studies into cancer physiology have become possible. There exists a strong correlation between a tumour's transcriptome and phenotypic presentation. Deep sequencing permits a full view of the genetic regulatory and expression mechanisms governing tumorigenesis and pathophysiology of cancer (L. Wan, Pantel, & Kang, 2013). NGS has enabled the identification of gene mutations, oncogenic gene fusions (Byron, Van Keuren-Jensen, Engelthaler, Carpten, & Craig, 2016), methylation abnormalities, chromosomal rearrangements, and gene expression alterations within diseases (Ashwag Albukhari, Fawzi F. Bokhari, 2015). Interrogation of these genetic and transcriptomic cancer-specific traits may aid in the diagnosis and prognosis of different cancers and subtypes.
1.5.4 Prognostic and Diagnostic Gene Expression Profiling
Gene expression profiling for diagnostic biomarker discovery has been successfully applied to a number of different cancers. Utilising RNA-Seq data, prognostic signatures for invasive lobular breast cancer (Ciriello et al., 2015) , pancreatic adenocarcinoma (Kirby et al., 2016), lung adenocarcinoma (Shukla et al., 2017), as well as biomarker signatures for cancers of unknown origin (Wei, Shi, Jiang, Kumar-Sinha, & Chinnaiyan, 2014). The Cancer Genome Atlas consortium has also employed comprehensive analysis with integrative transcriptomic studies, through the application of different RNA-Seq and DNA-Seq platforms, for the discovery of molecular portraits of breast tumours (Koboldt et al., 2012), and lung adenocarcinomas (Collisson et al., 2014).
1.6Breast Cancer: Molecular Subtyping through Gene Expression Analysis Breast cancer is most frequently diagnosed in women in Western countries and accounts for approximately 30% of all cancers diagnosed and 16% of cancer deaths (F. Bray et al., 2018). Breast cancer is a clinically, molecularly and pathologically heterogeneous disease. Gene expression profiling has allowed the identification of molecular breast cancer subtypes. Clinically, the disease has been categorized into three basic therapeutic groups. Estrogen positive (ER) breast cancer is the most diverse in presentation (Paik et al., 2004). The HER2 subtype, is characterized by the presence of HER2 gene, which implicates that the tumour is stimulated by elevated levels of growth hormones (Moasser, 2007). Triple-negative breast cancer tumours do not express any hormonal receptors and are essentially progesterone, estrogen and HER2 negative. Triple-negative cancers are viewed as the most difficult to treat with the poorest patient survival outcomes (Sorlie et al., 2003).
Various clinical and pathological factors, such as age, menopausal status, tumour size, histological grade, lymphovascular invasion, oestrogen receptor have been implicated as prognostic indicators of clinical course (Perou et al., 2000). Primary treatments consist of tumour excision and radiation or mastectomy with or without radiotherapy. Adjuvant therapies have been shown to improve the long-term survival of patients (Dinh, Sotiriou, & Piccart, 2007).
1.7Research Rationale
The burden of breast cancer incidence and prevalence in both developed and developing countries has motivated the continual research on treatment biomarkers and more accurate classification models. Heterogeneous diseases like breast cancer require investigation into the genetic differences between diseased and healthy states through gene expression profiling. Large public repositories exist, such as NCBI, GEO and Array express, containing thousands of mRNA and cDNA microarray data samples. This provides researchers with an abundance of reusable data from which novel biological insights and predictive diagnostics can be developed in a cost-effective manner. The key and associated challenge to
optimally exploiting the diversity of data available, however, is in integrating breast cancer microarray samples from different microarray platforms and study population. Studies have shown that increased sample numbers and diversity should increase statistical power and discovery of population-independent predictive signatures (Nevins et al., 2003; Rung & Brazma, 2013). In the current era, the advent of large-scale next-generation sequencing, and the advantages of RNA-Seq in complete cancer transcriptomic profiling, holds immense promise for more accurate diagnostic and prognostic signature discovery (Cieślik & Chinnaiyan, 2018).
Prognostic and predictive gene signatures like Mammaprint™ and Oncotype DX™ (Buyse et al., 2006; Toole, Kidwell, & Van Poznak, 2014), using gene expression profiling with large microarray datasets indicates that gene-expression profiling has great potential for improving breast cancer management and increasing our understanding of disease biology. To date, only one clinically available gene signature is available developed using RNA-Seq data, FoundationOne Heme (Doebele et al., 2015), and focuses on gene fusion detection in soft tissue sarcomas (Byron et al., 2016).
Machine learning has been broadly applied to building breast cancer classifiers from gene expression data (Yue, Wang, Chen, Payne, & Liu, 2018). The simplicity of the Gene Expression Barcode (GExB), allows the integration of data from a diversity of experiments to develop accurate classifiers using machine learning algorithms. The absolute measures of expression, 1's and 0's, generated by the GExB, make implementation of a filter feature selection technique attractive; setting parameters for relevant variable (gene/probe) identification of differentiating features between diseased and healthy breast tissues. Applying these features to sophisticated algorithms, like SVM, holds promise for identifying robust and accurate gene signatures and the absence-presence nature of the signals would allow any finding to be easily migrated to simpler technology platforms such as RT-PCR.
1.8Aims and Objectives
This study was split into two parts: 1) The application of the GExB to Micro-array data and 2) The development of a barcoding method for RNA-sequencing data,
comparable to the GExB algorithm
1.8.1 The application of the GExB to Micro-array data
Hypothesis: Integrating existing breast cancer microarray expression data using the Gene Expression Barcode concept will enable the discovery of easily assayable signatures for classifying breast cancer samples into subtypes.
Main aim: Develop a feature selection method to identify predictive signatures in simplified expression datasets and test classification accuracy on “real” clinical datasets.
The following objectives were identified for achieving the main aim:
(1) Production of gene expression barcodes for breast cancer subtypes and development of a method for integrating barcodes from different chips. (2) Development of an automated feature selection pipeline for identifying a
minimal set of expression features based on (1).
(3) Evaluation and optimisation of the feature-selection method using a simple classifier.
(4) Derivation of a variation of the feature-selection method for development of a multi-class classifier.
1.8.2 The development of a barcoding method for RNA-sequencing data, comparable to the GExB algorithm
Main aim: To discover a novel method to convert gene counts in RNA-Seq data to absolute calls of expression, i.e. 1's and 0's, and therefore creating a “barcoding” method for NGS data
Objectives:
(1) Development of a method for barcoding RNA-Seq data and application on breast cancer data from The Cancer Genome Atlas (TCGA)
(2) Development of a two-class classifier for TCGA normal and tumour samples with feature selection based on best differentially expressed genes
(3) Integration of RNA-Seq data from normal breast tissue samples, from the Genotype-Tissue Expression (GTEx) project to discover a
signature for multi-class classification capable of distinguishing between normal, normal-from-cancer-patient, and primary tumour samples.
Chapter 2
A Two-Class Breast Cancer Classifier for Malignancy
ABSTRACTINTRODUCTION:
Breast cancer is a heterogeneous disease with an ever-growing increase in the biological subtypes being recognized. Along with molecular subtypes, are metastatic and primary cancers, where molecular profile, tumour histology and grade collectively contribute to subtype diversity. Accurate subtype classification has been shown to coincide with improved diagnosis, prognosis and aetiology; imparting a comprehensive patient status with strong correlation to clinical and 5-year survival outcomes. Histopathological examinations of tumours, which are mostly inaccurate, is unfortunately still the classification method of choice.
The use of gene expression profiling has been studied extensively for implementation in breast cancer subtyping. These profiles include classification, prognosis and in the case of MammaPrint™, chemotherapy sensitivity, and breast cancer recurrence with Oncotype DX™. Despite the success of MammaPrint™ and Oncotype™ DX, significant advances in diagnosis and treatment by gene expression profiling, diagnostic gene signatures need to be further explored.
The Gene Expression Barcode was developed to overcome the constraints of microarray expression data, such as probe effects, noisy data and the relationship between intensity and actual expression. The algorithm shows clear demarcation of low and high expression measurements to classify genes as silenced and expressed by means of a binary ‘barcode’. As signatures derived from absolute expression calls would simplify implementation in a laboratory setting, we explored the potential of expression barcodes as features for machine learning based classification. We present a simple method, which combines biologically relevant feature selection with the K-means clustering algorithm to accurately classify breast tissue samples as being normal or malignant.
METHODOLOGY:
Carefully selected and curated normal and tumour samples were obtained from the NCBI’s Gene Expression Omnibus database. We developed a filter to produce a minimal discriminating feature set/barcode by selecting probes which were
stably expressed within tissue types, yet differentially expressed between the two tissue types. K-means clustering of tissues based on the minimal feature set was performed to ensure that the barcode signature was able to correctly classify the training set. Unseen samples from both the original and unrelated experiments were then classified to ascertain the predictive accuracy of the signature and its ability to generalize to the classification of unseen samples.
RESULTS:
The optimized feature selection filter of binary data reduced the feature set from 22215 to 85 informative probes. K-means clustering showed clear separation of normal epithelial breast tissue and primary tumour samples. A 100% accuracy in tissue classification was observed, even for samples from tumour classes not represented in the training set.
DISCUSSION:
With a simplistic filtering and clustering technique, we were able to classify unseen normal breast and tumour samples with 100% accuracy based on gene expression data that has been converted to ‘absence/presence calls’. We propose that such signatures, which may be easily translated to a PCR- or hybridization-based laboratory test, shows promise for reliable classification of tissues of ambiguous malignancy status. Furthermore, we predict that pairing our barcode and filtering approach with more powerful classification techniques such as multi-category support vector machines could produce robust expression-based classifiers that have potential for clinical application.
2.1Introduction
The prevalence of breast cancer incidence has risen to 8 million cases globally between 2007 and 2015, making it the leading cause of cancer deaths among women internationally and in South Africa (Ferlay et al., 2015; Siegel et al., 2012). This highlights the importance of early-detection and accurate classification of a biopsied tissue prior to any treatment decisions being made.
2.1.1 Breast Cancer Classification
signatures has been a decade-long aim of many gene-expression profiling and bioinformatics studies. Diagnosing a patient with breast cancer accurately from the molecular portrait of the biopsy cells improves the treatment choices made for the patient, and also the survival outcomes (Henderson & Patek, 1998). The complexity of making accurate diagnostic decisions, however, lies in the heterogeneous nature of the disease; which is comprised of distinct subtypes having varied clinical, pathological and molecular presentations. Initial diagnosis of breast cancer heavily relies upon histopathology examination of biopsied tissues; immunohistochemical (IHC) staining of biopsied cells which reveal the presence or expression of hormone receptors estrogen, progesterone and human epidermal growth factor 2 (Her2) (Patnayak et al., 2015). However, these examinations are poorly reproduced for a given breast cancer case, and thus cannot always be relied upon as informative enough for clinicians to make a diagnosis (Haibe-Kains, 2010). In a recent study on the reliability of IHC examinations, 83% of the molecular subtypes were shown to be misinterpreted (Jorns, Healy, & Zhao, 2013). This demonstrates that even though IHC in terms of hormone receptor presence is reliable, misinterpretation still negatively impacts the treatment decisions of clinicians, with far-reaching consequences.
2.1.2 Gene Expression Profiling
Advances in microarray technology have granted biologists the ability to measure and assess the expression levels of thousands of genes in a single assay. Using the data and knowledge obtained, the discovery of molecular breast cancer subtypes has emerged. Gene expression profiling has been used to develop clinically relevant and implemented signatures for diagnostics and prognostics (Sotiriou & Piccart, 2007). The development of predictive and prognostic gene signatures such as Mammaprint™ has assisted clinicians with informed treatment decisions. Mammaprint™ is a 70-gene signature predictor of chemotherapy sensitivity of a patient. This clinical assay however has limitations in application, as only adjuvant drug therapy choices and consequent treatment course decisions, are informed. Oncotype DX™ is a PCR assay used in breast cancer prognostics; consisting of a 21-gene signature, which assigns a score for the likelihood of
recurrence of breast cancer in lymph-node negative, estrogen-positive patients. The assay is however limited to application in estrogen-positive breast cancer subtype cases (Toole et al., 2014). Despite the efforts of molecular biologists and bioinformaticians to discover a generically, globally applicable gene expression assay which can assess the multiple facets of the disease, the constraints of using traditional microarray raw data analysis has impacted the discovery of such signatures (Nevins et al., 2003).
2.1.3 Microarray Data Analysis simplified with The Gene Expression Barcode (GExB) algorithm
The development of Frozen Robust Microarray Analysis (fRMA) and the Gene Expression Barcode (GExB) has addressed the difficulty in using integrated microarray data from different experimental cohorts and different micro-chip platforms to generate molecular profiles of tissues (McCall et al., 2011). Robust Microarray Analysis (RMA), a broadly used normalization tool for raw data, is restricted to application of the experiment set under investigation (Irizarry, Hobbs, et al., 2003). Normalization parameters and threshold values for assigning up- or down-regulation of genes’ expression are relative measures across the microchip signals being interpreted (McCall et al., 2011). fRMA conversely, has precomputed generalised values, from thousands of microarray samples, for data normalization, which allows raw data to be preprocessed identically. The meta-analysis of healthy and diseased tissues of the body has standardized parameters that mitigate the clouding factors of gene expression level values; probe effects, mismatched probes, noisy data(McCall, Bolstad, & Irizarry, 2010b). The GExB algorithm takes this continuous data, i.e. expression values, and assigns an absolute measure of gene presence or absence, represented by a “1” or “0” respectively (McCall et al., 2011; Zilliox & Irizarry, 2007b). The resultant sequence, or barcode, is similar to the Affymetrix MAS 5.0 absent-present algorithm, but is more robust and not limited to a single experiment set due to the fRMA preprocessing phase.