VOLATILITY MODELING USING HIGH FREQUENCY TRADE DATA TO
IDENTIFY CRYPTOCURRENCY BUBBLES
By
VIJAY GAUTAM
Bachelor’s in Technology, Mechanical Engineering
Indian Institute of Technology
Kanpur, India
1999
Master’s in Business Administration
Indian Institute of Management
Bangalore, India
2004
Masters of Science in Quantitative Financial Economics
Spears School of Business, Oklahoma State University
Stillwater, USA
2016
Submitted to the Faculty of the
Graduate College of Oklahoma State University
In partial fulfillment of the requirements for
The Degree of Doctor of Philosophy
August, 2019
ii
VOLATILITY MODELING USING HIGH FREQUENCY TRADE DATA TO
IDENTIFY CRYPTOCURRENCY BUBBLES
By
VIJAY GAUTAM
Dissertation Approved:
Dr. Dave Carter
Dissertation Advisor
Dr. Betty Simkins
Dr. Greg Eaton
Dr. Weiping Li
Dr. Imran Syed
iii
Acknowledgements
I would like to express my deepest gratitude and regards to my academic father, dissertation chair and advisor, Dr. Dave Carter, who guided and mentored me in my research and always encouraged me along the way. He always inspired me in putting my best effort and channelizing it. Without his continuous encouragement, support and belief in me, this work would not have been possible. I would also like to thank Dr. Weiping Li in explaining to me the theory of martingales and stochastic calculus, and helping me in generating the algorithm to model stochastic volatility, and methodology to identify asset bubbles as well as conducting the statistical test. I would like to take this opportunity to thank my family, who put up with me during the tough days while I was on the course of earning PhD - it has been quite a journey to me, more than just an academic one.
I would like to thank other members of my dissertation committee - Dr. Betty Simkins, Dr. Greg Eaton and Dr. Imran Syed for their timely advice and help. All of them were extremely helpful and always steered me towards the best goal. I will be forever indebted to them for their advice and guidance.
I would also like to express gratitude to Dr. Joel Harper, erstwhile coordinator of the Finance PhD program, and Dr. Ramesh Sharda, Vice Dean – Watson Graduate School of Management at Oklahoma State University. Finally, I am indebted to all my well-wishers and advisors in my life: my professors during my MBA in IIM Bangalore, as well as my colleagues and seniors in the Finance profession, who sincerely guided me when I had doubts. I dedicate this work of mine to them as well. All errors in the dissertation, if any, are my own.
Disclaimer: Acknowledgements reflect the views of the author and are not endorsed by committee members or Oklahoma State University.
iv Name: VIJAY GAUTAM
Date of Degree: AUG-2019
Title of Study: VOLATILITY MODELING USING HIGH FREQUENCY TRADE DATA TO IDENTIFY CRYPTOCURRENCY BUBBLES
Major Field: BUSINESS ADMINISTRATION
Abstract
In the light of sudden interest in Bitcoin during 2017, which saw Bitcoin growing multifold in market price, I study blockchain, Bitcoin and few other top cryptocurrencies, and examine whether Bitcoin was in a financial bubble during late 2017 and early 2018, when Bitcoin price had a sudden and dramatic run up. I conduct statistical analysis on the High Frequency Trade (HFT) data, sourced from Bloomberg and other crypto exchanges. The statistical analysis includes filtering in price data using 5%, 7% and 10% daily price jump rules (considered separately), interpolating price points between low and high prices in the time series, estimating price volatility at discrete price points, analyzing the volatility behavior and concluding whether or not price process is a strict local martingale. A bubble is confirmed if the price process is a strict local martingale, and not a true martingale. I run the test for Bitcoin, and find that Bitcoin was in intermittently in bubble during the years 2017 and 2018. I repeat the test for Ethereum, another top trading cryptocurrency, and find that Ethereum was in bubble during Nov 2017 – Feb 2018, but infrequently and for lower duration of days as compared to Bitcoin. Though Bitcoin price dramatically increased during 2017, the number of transactions and transactions volume rather fell. I develop a statistical test that can be applied on the High Frequency Trade (HFT) data of any highly traded asset to identify whether or not that asset has been in bubble during the period of consideration. I also find that Bitcoin has positive correlation with other top cryptocurrencies and almost zero correlation with S&P 500, gold, and the crude oil.
JEL Classification: C14, C58, G12, G14, G17
Keywords: Blockchain, cryptocurrency, Bitcoin, financial bubble, volatility estimation, discrete observations, diffusion, martingale, strict local martingale
v
Table of Contents
List of Tables ... vii
List of Figures ... viii
1. Introduction ... 1
1.1 Motivation ... 2
1.2 Key research questions ... 4
2. Blockchain, Bitcoin and other cryptocurrencies ... 5
2.1 Blockchain ... 5
2.2 Cryptocurrency ... 8
2.3 Bitcoin: A Payment System ... 11
2.4 Early history of Bitcoin ... 13
2.5 Bitcoin architecture ... 15
2.5.1 Hash Functions ... 15
2.5.2 Cryptographic Hash function ... 15
2.5.3 Digital Signatures ... 16
2.6 Bitcoin valuation ... 16
2.7 Bitcoin mining and transactions ... 19
2.8 Economics of Bitcoin mining ... 20
2.9 Power Consumption ... 23
2.10 Bitcoin and financial markets ... 25
2.11 Bitcoin - Challenges and risks ... 26
3. Financial Bubbles ... 28
3.1 Introduction ... 28
3.2 History of financial bubbles ... 29
3.3 Causes and stages of financial bubbles ... 31
vi
3.3.2 Stages of financial bubble ... 32
3.4 Review of financial bubbles literature ... 33
3.4.1 Causes and effects of bubbles ... 33
3.4.2 Patterns of speculative bubbles ... 35
3.4.3 Types of asset bubbles ... 36
3.5 Stochastic approach for asset bubble identification ... 37
3.6 The Statistical model ... 40
3.7 Stochastic volatility estimator ... 44
4. Hypothesis, Data and Methodology ... 46
4.1 Hypothesis ... 47
4.2 Data ... 48
4.3 Methodology ... 50
4.3.1 Methodology for statistical test ... 50
4.3.2 Methodology of datasets construction ... 55
4.3.3. Methodology of finding the correlation between cryptocurrencies’ returns ... 55
4.3.4 Methodology of finding the correlation between cryptocurrencies and other assets ... 56
4.3.5 Methodology for identification of financial bubble ... 56
4.4 Correlation among cryptocurrencies ... 59
4.5 Correlation of cryptocurrencies with other assets ... 60
5. Empirical results ... 62
5.1 Statistical test on Bitcoin ... 62
5.1.1 Test results for Bitcoin: Year 2016 ... 63
5.1.2 Test results for Bitcoin: Year 2017 ... 64
5.1.3 Test results for Bitcoin: Year 2018 ... 67
5.2 Statistical test on Ethereum ... 70
5.2.1 Test results for Ethereum: Year 2016 ... 70
5.2.2 Test results for Ethereum: Year 2017 ... 71
5.2.3 Test results for Ethereum: Year 2018 ... 75
6. Conclusions & Remarks ... 77
Tables and Figures ... 80
vii
List of Tables
1 Bitcoin price milestones ……… 81
2 Top cryptocurrencies ………. 82
3 Bitcoin blocks ……… 83
4 Average volatility of top cryptocurrencies ……… 84
5 Bitcoin power consumption statistics ……… 85
6 Top Bitcoin exchanges ……….. 86
7 Top Ethereum exchanges ……….. 87 8 (a – c) Summary of statistical test for bubble: Bitcoin (2016) ………. 88 - 90 9 (a – c) Summary of statistical test for bubble: Bitcoin (2017) ……….. 91 - 93 10 (a – c) Summary of statistical test for bubble: Bitcoin (2018) ……….. 94 - 96 11 (a – c) Summary of statistical test for bubble: Ethereum (2016) ……….. 97 - 99 12 (a – c) Summary of statistical test for bubble: Ethereum (2017) ……….. 100 - 102 13 (a – c) Summary of statistical test for bubble: Ethereum (2018) ……….. 103 – 105 14 (a – c) Correlation between cryptocurrencies’ returns ……….. 106 - 108 15 (a – c) Correlation of cryptocurrencies’ returns with other asset classes ………….. 109 - 111
viii
List of Figures
1 Daily Bitcoin price ……… 112
2 Daily Ethereum price ……… 113
3 Hash Rate ……….. 114
4 Bitcoin market capitalization ……… 115
5 Bitcoin in circulation ……… 116
6 Difficulty of mining ……….. 117
7 Average daily Bitcoin transactions ………... 118
8 Average daily Bitcoin transaction value ………... 119
9 Average daily Bitcoin transaction volume ……….... 120
10 Cost per Bitcoin transaction ……….. 121
11 Average Bitcoin wallet users ……… 122
12 Average blockchain size ………... 123 13 (a – b) Volatility vs. Price charts………... 124 – 128
1
CHAPTER 1
Introduction
Cryptocurrency has generated significant interest in not just investors and the financial community, but also among common public. Bitcoin, in particular, has come up strongly as an alternate source of payment. With market price of $3,955 and market capitalization of $69.65 billion (as on 25-Mar-2019), Bitcoin has also become a force to reckon with in capital markets. Bitcoin is the first ever cryptocurrency, invented in 2008 by anonymous inventor Satoshi Nakamoto, and remains the largest of all cryptocurrencies. The underlying technology of Bitcoin is blockchain: a new revolutionary technology, which has the potential to disrupt ongoing processes in many industries. Unlike traditional or ‘fiat’ currency, Bitcoin is neither printed nor backed by any government. New Bitcoins are awarded by the Bitcoin blockchain system to the programmers (also known as ‘miners’) who verify Bitcoin transactions (in form of mathematical puzzle). Bitcoin award (mining) rate is constant for every 10 minutes, and halves every four years, making the final supply of Bitcoin limited to (slightly less than) 21 million tokens. Bitcoin’s value is derived from the savings in transaction that results due to using Bitcoin for payment, rather than making payment through fiat currencies (as monitoring systems are not required). Bitcoin is especially useful in making international transactions. In addition, Bitcoin derives some value from its privacy feature. Bitcoin transactions are safe and virtually impenetrable. This led to a hope that majority of financial transactions in future may be through Bitcoin, thus leading to an understanding that Bitcoin will rise in value as more Bitcoin transactions happen. This resulted in widespread speculation in Bitcoin, resulting in sudden and swift rise in its market price, especially during the latter half of 2017. Due to herd mentality, retail investors also fueled this sudden
2
euphoria. After a steep rise in market price in December 2017, Bitcoin price again started falling in 2018. This phenomenon makes for an interesting case for study, and has some underlying questions like: Is rise in Bitcoin value based on some fundamentals or is it merely because of investors’ herd mentality? What drives the fundamental value of Bitcoin? Is there a statistical test that can identify whether Bitcoin was in bubble or not? If Bitcoin was in bubble, what was the duration of the bubble? These are some of the questions I try to answer in this research.
I do a deep analysis on blockchain, Bitcoin and several other top traded cryptocurrencies. I run a statistical test on the HFT (High Frequency Trade) data of Bitcoin during 2016-18 to identify bubble in Bitcoin during this period. I repeat the procedure for Ethereum, another cryptocurrency that has the largest market cap after Bitcoin, and try to identify whether Ethereum was also in bubble during 2016-18. I consider each year during the period separately in my analysis.
1.1
Motivation
Since its introduction to the world in 2008, Bitcoin has spawned a large number of cryptocurrencies, and thus has created a legacy of its own. During this period, enormous interest has been generated in not only Bitcoin and other cryptocurrencies, but also in Blockchain – the underlying technology that has the potential to disrupt processes in many industries. Cryptocurrencies like Bitcoin are ‘virtual’ currencies and can be used for transactions; they are also traded on dedicated crypto exchanges, with Bitcoin leading the pack in the trading volume. The interest of investor community, both retail and institutional alike, is high in those cryptocurrencies that have suddenly risen up in market price. Bitcoin showed a remarkable run up in price since 2016, especially in the latter half of 2017. This run up in price was so sudden and swift that many investors who held Bitcoin termed it as a ‘lifetime opportunity’. However, Bitcoin price fell consistently and significantly, till it fell by 75% from its all-time high (Dec-2017). When invented and released for the first time in 2009 (3-Jan-2009), Bitcoin value was merely few cents. There was a famous incidence of
3
someone paying for a pizza using a few Bitcoins in 2009! While price of Bitcoin was a mere few cents in 2009, in 2017 it rose to few thousand dollars. From a few cents to few thousand dollars, Bitcoin came a long way in just 9 years. Majority of this run up was witnessed in 2017 itself, that too during the quarter Sep-Dec 2017. As reflected in Table 1, which shows Bitcoin price milestones, the cryptocurrency was moving ahead sluggishly till 2016, after which it accelerated suddenly. Bitcoin ran up so quickly during the fourth quarter of 2017 that it reminisced of the mad rush during the e-commerce boom of the late 1990s. Table 1 shows the Bitcoin price milestones from $1,000 to $20,000.
[Insert Table 1 here]
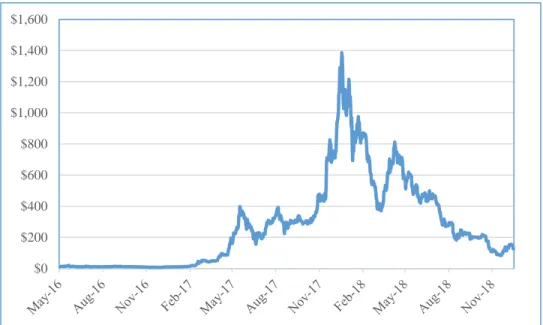
Figure 1 shows Bitcoin’s daily price movement during 2016-18. There was a dramatic increase in Bitcoin price during the last quarter of 2017, followed by a consistent fall in 2018, especially after the first quarter of that year. Bitcoin price rise during 2017 was so significant that the Bitcoin price increased more than tenfold in the year 2017 alone.
[Insert Figure 1 here]
Along with Bitcoin, Ethereum also increased in price, almost concurrently. Figure 2 shows Ethereum’s price movement during 2016-18. Its price chart is similar to Bitcoin’s price chart, with dramatic rise in price by the end of 2017, and fall in the subsequent year.
[Insert Figure 2 here]
While some financial analysts were deeming it as a classic case of bubble, some were of the view that the world has suddenly discovered a new technology and mode of payment, which has strong potential to overshadow traditional mode of payment (currency and cards), and which is causing such an unheard outburst in Bitcoin price. This motivated me to conduct a study that aims to identify whether there indeed was a financial bubble in Bitcoin, and other (top) cryptocurrencies during 2017 and early 2018. I conduct
4
a statistical analysis of price data during 2016-18 for Bitcoin and Ethereum. Along with that, I also do an in-depth analysis of blockchain, a revolutionary technology on which all cryptocurrencies are based.
1.2
Key research questions
This study focuses on the following research questions:
Is there a statistical test to analyze and identify whether Bitcoin was in a bubble during the last quarter of 2017, when it showed dramatic increase in market price?
Were other crypto currencies were also in bubble during this period?
If Bitcoin was in bubble during 2017, when did it enter the bubble territory? Also, was there a bubble in Bitcoin in the preceding year (2016) and the subsequent year (2018)?
Do the top trading cryptocurrencies move in tandem? What is the correlation between their prices?
5
CHAPTER 2
Blockchain, Bitcoin and other cryptocurrencies
2.1 Blockchain
Blockchain is the underlying technology of cryptocurrency like Bitcoin. A blockchain (i.e. a ‘chain of blocks’) is a distributed ledger technology, and consists of database that stores transaction information in ledgers, in the form of distributed blocks. A block is a ledger, or container of data / information, which is created on regular intervals. Blocks are arranged in form of a chain, in which each successive block holds the address of the preceding block. Each new block references the preceding block, thus sequentially forming a chain of cryptographically linked transaction bundles, or blocks (Pilkington (2015), Perlman (2019)). A blockchain allows a decentralized network of economic agents to agree, at regular intervals, about the true state of shared data. This shared data can represent exchanges of currency, intellectual property, equity, information or other types of contracts and digital assets - making blockchain a general-purpose technology that can be used to trade scarce, digital property rights and create novel types of digital platforms (Cataliani and Gans (2017)). At basic level, a blockchain enables a community of users to record transactions in a shared ledger within that community. Each transaction is verified by the users in that community through a mechanism called ‘consensus’. After verification, the transaction is published in a ledger on the blockchain platform, and cannot be changed once it is published (Perlman (2019)).
Blockchain is replicated over a peer-to-peer (P2P) network that enables multiple parties to share and modify the database in a safe and secure way even if they are unknown to each other. It is based on Distributed Ledger Technology (DLT): the blockchain consists of ledgers on distributed systems (Hileman and Rauchs
6
(2017)). Blockchain enables the transfer of digital files, and thus transfer of assets and other data, without relying on a Central authority. This enables network participants to independently verify the integrity of the shared database without having to rely on a trusted third party. Blockchain system is a decentralized platform on which network of computers located across the globe are linked together. These computers verify each other’s work - anyone can run programs on them - and users can pay for only what they wish to use (Pilkington (2015)). The potential Blockchain applications find use in industry processes like payments, mining, asset ownership, insurance claims, intellectual property, regular technology services, Internet of Things (IoT) integration etc. Blockchain technology has a potential to disrupt traditional industries (Hileman and Rauchs (2017)).
In traditional transactions, a neutral and trusted central agency maintains a central ledger and ensures the veracity of transactions and trust among transaction parties by tracking the movement and ownership of value. This is illustrated in the figure A, which shows traditional financial transactions process among the financial institutions.
Figure A: Traditional financial transactions
[Source: Hileman and Rauchs (2017)]
Counterparty with Central
7
Blockchain obviates the need for the central agency. The trusted third party is supplanted by the implementation of a shared public database, alteration of which requires consensus of all participants. A secure distributed ledger removes the counterparty, as the transaction record is universally visible and immutable. This is shown in the figure B, which shows financial transactions process among financial institutions on blockchain.
Figure B: Blockchain financial transactions
[Source: Hileman and Rauchs (2017)]
There are five essential components of blockchain (Hileman and Rauchs (2017), Mahmoud, Lescisin and AlTaei (2019)):
a) Cryptography: Use of a variety of cryptographic techniques including cryptographic hash functions, Merkle trees and public key infrastructure (private-public key pairs).
b) P2P network: Network for peer discovery and data sharing in a peer-to-peer fashion.
c) Consensus mechanism: Algorithm that determines the ordering of transactions to maintain trust among participants.
8
e) Validity Rules: Common set of rules of the network that validate transactions and update ledger. A blockchain network is defined by nodes and mesh that connects various nodes in the network. Transactions that result in transfer of assets are recorded in ledgers. The history of business transaction is visible to each node through the shared ledger technology. There is a common view of transaction history across the entire network. Blockchain uses consensus method to commit transactions to the system, implying that all parties must give consensus before a new transaction is added to the system. Each network member (on a node) has a copy of the same ledger, so asset provenance and traceability are transparent and trusted. The resulting process eliminates paper work, is quicker and efficient. The shared ledger is single, transparent and tamper-proof (Harvey (2016)).
Building blockchain involves following steps:
a) Verify each transaction, as it occurs.
b) After verification, put each transaction in a block.
c) After transactions are blocked together, connect each block to the one and after it by linking addresses (through techniques like linked lists and pointers).
d) Each block is added to the next in an irreversible chain.
2.2 Cryptocurrency
Harvey (2016) defines cryptocurrency as a digital system of non-physical tokens, which have an ascribed value. A cryptocurrency is a digital asset designed to work as a medium of exchange using cryptography to secure transactions, to control the creation of additional value units, and to verify the transfer of assets (Hardle, Harvey and Reule (2019)). Unlike a physical ‘fiat currency’, which is printed on paper and legally guaranteed by the government, a cryptocurrency is neither printed on pieces of paper, nor is it created by any Central Bank or government of any country. Rather, it is created by a cryptocurrency system, which
9
works on the method of cryptography, at a rate that is defined when this system is created (Nakamoto (2008)). Many different cryptocurrencies exist, each with their own set of rules. Differences among the cryptocurrencies may involve, for example, the choice of the consensus mechanism, the latency, or the cryptographic hashing algorithms (Hardle, Harvey and Reule (2019)). The highest trading cryptocurrencies are Bitcoin, Ethereum, Bitcoin Cash and Ripple. Table 2 shows top ten cryptocurrencies by trading volume and market capitalization, and their relative proportion.
[Insert Table 2 here]
Blockchain is the underlying technology of a cryptocurrency. Hence, the key tenets of a cryptocurrency are derived from features of blockchain: cryptography, peer-to-peer information sharing, shared ledger, no central agency (rather, other users verify and authorize transactions), consensus mechanism and validation rules. Along with that, a cryptocurrency will also have digital purse where all tokens, i.e. coins will be kept. A cryptocurrency coin is not in a physical form, but rather at online, on a computer. Parham (2017) describes the process of transactions using a cryptocurrency:
“At its core, a cryptocurrency network is a distributed ledger - a type of public database that is shared, replicated, and synchronized among the members of a peer-to-peer computer network. The distributed ledger records transactions among network participants, thus keeping track of asset ownership. Every participant in the network has a unique identifier, known as an address. One person or entity may create and use many addresses. The ledger, hence, is just a list of valid transactions between addresses. The validity of the transaction is verified before it is posted, by making sure that on date ddd at time ttt, address xxx did indeed have ccc tokens of cryptocurrency, and that the (anonymous) owner of address xxx is really the one who issued the transfer order. Authenticating the transaction issuer is achieved using a cryptographic mechanism known as public-key cryptography. When an address is created for the cryptocurrency, the owner of the address also creates two keys, a public-key, which is disseminated widely, and a private-key, which is known only to the owner. When the owner issues a transaction request, they
10
‘sign’ it by attaching an encrypted version of the transaction request, using their private-key for the encryption process. An important feature of public-key cryptography is that anyone holding the public-key can decipher this signature and verify it matches the transaction it is signing. Because only the account owner has the private-key, this signature verifies they are indeed the ones who issued the transaction”.
Published research in the area of Bitcoin and cryptocurrencies has focused on providing an overview of Bitcoin and its operations (Yermack (2013), Bohme, Christian, Edelman and Moore (2015)). Athey, Parashkevov, Sarukkai, and Xia (2016) combine theory and data to explain the velocity of Bitcoin and its use across countries as an investment vehicle, for gambling and illegal online markets. Because of its anonymous nature, Bitcoin has use in anonymous investments in stock markets as well. Governments across the world are bringing regulations to put control on unauthorized use of cryptocurrencies in such payment channels. Halaburda and Gandal (2014) examine competition between alternative cryptocurrencies and their differences. They find that when Bitcoin increases in value in the US dollar terms, it gains in value against other cryptocurrencies as well. Gans and Halaburda (2013) study developments in digital currency focusing on platform-sponsored currencies such as Facebook Credits. The authors find that it will not likely be profitable for such currencies to expand to become fully-convertible competitors to state-sponsored currencies. Halaburda and Sarvary (2015) point out that cryptocurrencies increase transparency by keeping the record of money transfer and payments in ledgers that are available for viewing to all market participants. Malinova and Park (2016) study the changes cryptocurrencies entail for trading behavior. The authors argue that since blockchain enhances transparency through ledgers, the implementation of blockchain technology in financial markets offers investors new options for managing the degree of transparency of their holdings and their trading intentions. Raskin and Yermack (2016) and Seretakis (2017) study the integration of cryptocurrencies with fiat-based currencies and argue that cryptocurrencies can have profound impact on the banking system and can narrow the relationship between the central banks and citizens. Rysman and Schuh (2016) study the direct use for providing citizens with central bank money and alternative payment systems. They study innovations in payments through mobile payments, faster
11
payments and digital payments. Wright and De Filippi (2015) and Davidson, De Filippi, and Potts (2016), study implications of blockchain and cryptocurrencies for regulation and governance. Wright and De Filippi (2015) say that widespread deployment of blockchain will lead to rules administered through self-executing smart contracts and decentralized (autonomous) organizations, and will shift the balance of power away from centralized authorities in the field of communications, business, and even politics or law. This may create corporate governance issues. Davidson, De Filippi, and Potts (2016) view blockchain as new institutional technology of governance that competes with other economic institutions of capitalism, namely firms, markets, networks, and even governments. Athey, Catalini, and Tucker (2017) study the privacy trade-offs cryptocurrencies and digital wallets introduce for consumers.
2.3 Bitcoin: A Payment System
Bitcoin is a blockchain application, is independent of any central authority, and is based on an open-source peer-to-peer protocol, where all users interact and transact with each other directly. It is a digital currency and was designed as a payment system (Harvey (2016)). Bitcoin relies on cryptography to secure and validate transactions, which are pseudonymous and decentralized. In a transaction, Bitcoin can be used as a currency in exchange for goods and services. It is easily portable, divisible and irreversible. It also increases system efficiency by obviating the use of various system checks at each transaction node (Hileman and Rauchs (2017)). Through a clever combination of cryptography and game theory, the Bitcoin blockchain (a distributed, public transaction ledger) can be used by any participant in the network to verify and settle transactions. The Bitcoin protocol was first described by Satoshi Nakamoto (a pseudonym) in 2008. Nakamoto (2008) proposed Bitcoin to address an economic problem inherent in electronic commerce: the frictions and the high transaction costs of trading over the internet, particularly relevant for small-value transactions. While the key innovation in Nakamoto’s paper is cryptography and computer science, it is ‘economics’ and the ‘theory of money’ that the paper impacts heavily. The concept of Bitcoin further fueled a debate on usage of cryptocurrencies, and increased awareness on it. Cryptocurrencies like Bitcoin can be
12
used in not only payment for the financial transactions, but also they are traded like stocks on dedicated cryptocurrency exchanges. Payments are made through tokens, which are essentially digital assets that are tradable and fungible (Perlman (2019). These tokens can be transferred on across the network and can be traded on cryptocurrency exchanges, on which the investor can buy and sell cryptocurrencies like Bitcoin in fractions. In contrast, the common stocks that can be traded only in whole numbers in a stock exchange.
Each Bitcoin is divided into 100 million smaller units called satoshis. Bitcoin transactions are verified by programmers called ‘miners’, who are rewarded for their efforts in form of new Bitcoins, when a transaction is successfully verified and authorized by them. This process of transaction verification by other programmers, who can also be the users on the Bitcoin system, is an innovation, since there is no trusted central authority to verify and authorize the transactions. Nakamoto (2008) defines ‘mining’ as the process of transaction verification and getting awarded in lieu of that. It involves finding the next valid block to be placed on the blockchain. The objective is to competitively solve computationally difficult problems in order to limit the rate at which new blocks are created. Nodes on a blockchain network are incentivized to participate in mining as if they are the first to obtain a valid block, the distributed network rewards them with an award of cryptocurrency. This award may be in the form of new tokens, also known as a block reward or it may be collected from transaction fees. Most cryptocurrencies are designed so that all coins in circulation are generated from block rewards and once all coins have been generated, miners are then incentivized through transaction fee rewards (Mahmoud, Lescisin and AlTaei (2019)).
In case of Bitcoin, the block reward, which is paid using freshly-mined Bitcoin, is halved every 210,000 blocks – roughly every 4 years. At the inception of Bitcoin (BTC), the initial award rate was 50 BTC every 10 minutes. This has come down to 12.5 BTC during 2016-20. Therefore, the reward rate progresses in a diminishing Geometric Progression in a block of 4 years. By 2032, over 99% of all Bitcoins will have been mined. By 2048, the total reward paid to miners for mining a Bitcoin block will drop to 0.05 BTC. This is down from the initial reward of 50 BTC upon Bitcoin’s inception. Table 3 shows Bitcoin blocks and year wise number of Bitcoins issued.
13
[Insert Table 3 here]
2.4 Early history of Bitcoin
In its early years, Bitcoin was known to a relatively narrow community of cryptography enthusiasts. The first time the currency made it into the mainstream media was probably in June 2011, when WikiLeaks started accepting donations in Bitcoin from its supporters (Halaburda and Sarvary (2015)). WikiLeaks started accepting donations in Bitcoin, while highlighting the flexibility of the currency, its anonymity and independence from traditional financial providers. By 2013, Bitcoin started appearing to be an increasing speculative investment opportunity (Parham (2017)). Its price (i.e. exchange rate to the US dollar) increased from under $15 in Jan-2013 to over $1,200 in Dec-2013. During this time, Bitcoin also started gaining foothold in electronic commerce, when the Chinese search engine Baidu (world’s 5th most visited site at the time) started accepting Bitcoin for payments. However, restrictions were put by the US government on digital currencies when it was revealed that Bitcoin was being used for payments in the illicit activities like drug trade by illegal websites like Silk Road. FBI raided the offices of this website and seized over 26,000 Bitcoins from there. Subsequently, the Chinese website Baidu also stopped accepting Bitcoins. In 2011, Japan-based Mt. Gox, then the largest Bitcoin exchange, experienced a security breach in which 850,000 Bitcoins worth approximately $450 million were stolen. As digital signature of a Bitcoin purse is nearly impossible to crack using brute force method, it happened only because the digital signature, or the password was known to someone who was involved in the incidence (Yermack (2013)).
Bitcoin started gaining popularity as it was touted as an instantaneous and anonymous way to make transactions, defying national boundaries, with no central bank and country as authority. Because of its anonymous nature, Bitcoins have been used in past in the criminal money laundering and tax evasion schemes (Nabilou (2019)). Chohan (2019) analyzes the growth of gambling activities on blockchain and
14
finds that the risk of illicit activities on the Bitcoin blockchain far outweighs the recreational aspect of gambling. During its initial days, Bitcoin was increasingly perceived as a quicker and cheaper alternative to existing money, to be used in peer-to-peer transactions, international transfers, etc. Its anonymous nature and ease of online transfer made Bitcoin a prominent method of illegal money transfer. Cryprocurrencies remain one of the largest unregulated markets in the world. Foley, Karlsen and Putnins (2019) find that approximately one-quarter of Bitcoin users are involved in illegal activity. The authors estimate that in 2018, around $76 billion of illegal activity per year involved Bitcoin (equivalent to approximately 46% of bitcoin transactions). This figure is close to the scale of the U.S. and European markets for illegal drugs. However, the authors also mention that the illegal share of Bitcoin activity declines with mainstream interest in Bitcoin and with the emergence of more opaque cryptocurrencies. In recent times, some research studies have proposed increased regulations on Bitcoin and other cryptocurrencies. Since cryptocurrencies are decentralized, Nabilou (2019) argues that instead of regulating the technology or the cryptocurrencies at the code or protocol layer, the regulation should target the applications and use-cases of cryptocurrencies.
Bitcoin transactions are now not completely anonymous, and are increasingly regulated (Parham (2017)). In addition, the underlying blockchain also has complete record of the path of all the addresses Bitcoin was sent to. The record of all prior transactions is stored in the ledger, which is transparent to all Bitcoin users. Also, Bitcoin transactions are not free, as Bitcoin miners, who verify and authorize a transaction, are paid a fee for their services. This fee has remained small in past years, in tune of ~0.0001 BTC per transaction (Parham (2017)). Therefore, the main reward of Bitcoin mining remains newly issued Bitcoins. However, as supply of new Bitcoins will diminish with time, the future transaction fees will be determined by the competitive forces of supply and demand: the supply of the computing power on the side of miners, and the demand for transaction verification on the side of Bitcoin buyers and sellers (Yermack (2013)).
15
2.5 Bitcoin architecture
Bitcoin architecture is built on cryptography, and is underpinned by the cryptographic hash functions and digital signatures to operate the digital purses.
2.5.1 Hash Functions
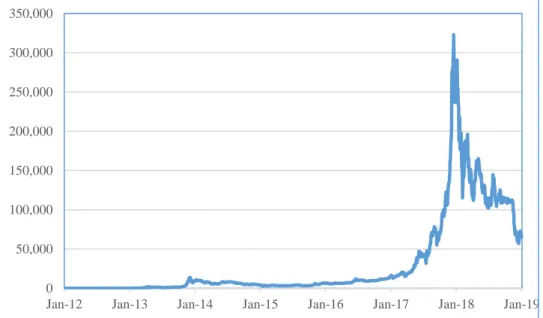
A hash function is computation that transforms input data of any size, to output data of a fixed size. The input message can be any sort of data (text, character strings, binary etc.), of any length. A hash is the output of a hash function and the hash rate is the speed at which a compute is completing an operation in the Bitcoin code (Nakamoto (2008)). Bitcoin uses the SHA-256 hash algorithm to generate verifiably ‘random’ numbers in a way that requires a predictable amount of CPU effort. Bitcoin mining network’s processing power is measured in hash rate. A higher hash rate is better when mining as it increases the chances of finding the next block and receiving the reward. In order for miners to confirm transactions and secure the blockchain, the hardware they use must perform intensive computational operations, which is output in hashes per second. Figure 2 shows the increasing trend of hash rate in last 2 years, given the increase in mining activity and Bitcoin award per block remaining same.
[Insert Figure 3 here]
2.5.2 Cryptographic Hash function
The cryptographic power of complex hash functions is that given a single output, it is hard to determine the input. A hash function is any computation that transforms input data of any size to output data of a fixed size. The Bitcoin blockchain encryption is virtually impenetrable and extremely secure1. Even if some
1 A Cryptographic Hash Function produces output of similar length, irrespective of the input length. The input may
be a word, a character string, a lengthy text, or a mix of numbers and characters. Irrespective of the input length, the output hash will be of similar size. Cryptographic hash function has a unique algorithm, which compresses the input string(s) and produces output of uniform length, blocks and size. It is nearly impossible to invert a hash (output) to its actual input. Also, no two different inputs produce the same hash (output) – a process known as ‘collision’. The cryptographic hash functions are extremely safe and secure to use, and are nearly impossible to be hacked.
16
hacking entity is able to commandeer the processing power of the entire Bitcoin network, approximately 1.4 billion Gigahash per second, a brute force approach to finding a collision in the NSA developed SHA256 would take 1.33 x 1051 years. To put that in perspective, our universe is approximately 13.7 billion years old, so it would take 9,672,989,162 trillion times the life of our universe to find a collision: an impossibility! (Hileman and Rauchs (2017))
2.5.3 Digital Signatures
Signatures are generated from a hash of data to be signed, and are a private key. Digital signatures are a derivation of public-key cryptography that uses a pair of keys to ensure the integrity and provenance of messages. A message is bundled with a ‘private key’ known only to the sender; anyone with access to the sender's paired ‘public key’ may then authenticate the message (Pilkington (2015)). There are risks associated with using digital purse. A Bitcoin holder can lose Bitcoins if the private key, i.e. the digital signature to the digital purse is lost. This is akin to losing password to a mailbox or a website. However, the access to digital purse and Bitcoins can be regained after a system identification process. There is also a slight chance of digital purse being hacked. Though it would be highly improbable using the brute force method, it is still doable if the hacker knows the private key.
2.6 Bitcoin valuation
As Bitcoin gains acceptance in international payment community, it has potential to expand in number of transactions. Also, the total number of Bitcoins are finite and limited in number (unlike fiat currencies, which can be printed on requirement by a central government). In addition, Bitcoin is based on the properties of Mathematics, rather than relying on physical properties (like gold and silver) or trust in central authorities, whom the fiat currencies rely on. There are no underlying cash flows in case of a cryptocurrency (as cryptocurrency is a substitute of cash). Therefore, the Discounted Cash Flow method cannot be applied for valuation of cryptocurrency. Rather, to value a cryptocurrency, the savings resulting from the use of
17
cryptocurrency have to be considered and analyzed under risk-neutral measure. Bitcoin transactions do not require deployment of monitoring applications, and therefore lead to dollar savings. More are the number of transactions using Bitcoin rather than credit/ debit/ cash cards or paper checks, more will be savings on transactions. Bitcoin also has value due to ‘convenience yield’, since Bitcoin has much wider use as mode of payment, due to its anonymous and decentralized nature. Like other currencies and commodities, the value of Bitcoin fluctuates wildly based on supply and demand and its perceived value. To give the current value of Bitcoin some context, according to the World Gold Council, there are 187,200 tons of gold that have been mined throughout history, with around two-thirds of that being mined since 1950. Based on a current gold price of $1300/oz. (30-April-2019), the global stock of gold is valued at $7,875 billion. In comparison, at the Bitcoin price of $5,267 (30-April-2019), and the 17.6 million Bitcoin in circulation, Bitcoin’s total value, i.e. market capitalization, is approximately $92.7 billion. At its peak price of $20,000, Bitcoin had a total market capitalization of approximately $332 billion.
Harvey (2016) and Hileman and Rauchs (2017) suggest the following valuation methods to value Bitcoins: 1) First approach is to estimate the Bitcoin transactions as a percentage of total number of transactions across the globe. Multiply that with the total GDP of the world, and divide by number of Bitcoins in circulation. However, estimating total number of Bitcoins in circulation that are used in making transactions is often a challenge.
2) A second approach is to measure savings through Bitcoin transactions, and value Bitcoin accordingly. An estimate suggests that Bitcoin transaction results in savings of ~ $3 over traditional transaction.
3) Another approach could be to ascertain the cost of mining for a particular computing power. The price of Bitcoin should be at least equal to the cost of mining Bitcoin, else there is no use of mining. A general rule will be to pursue Bitcoin mining if the cost of mining is much lesser than the Bitcoin’s ongoing market price.
18
This difficulty in Bitcoin valuation also leads to high volatility in Bitcoin price. The key question regarding Bitcoin volatility is whether high volatility is due to lack of collateral, or due to lack of liquidity. Because of such large volatility, it is difficult to use Bitcoin as store of value, since it carries short-term risk. Bitcoin’s daily exchange rates exhibit virtually zero correlation with widely used currencies and with gold, making Bitcoin not very useful for risk management and difficult for its owners to hedge. However, Bitcoin has liquidity since it is readily convertible into US dollars on Bitcoin exchanges. Also, among the top cryptocurrencies, Bitcoin is least volatile. Table 4 shows the daily and annualized volatility of Bitcoin and other top cryptocurrencies during 2016-18. As shown in this table, Bitcoin’s price volatility nearly doubled in 2017, compared to 2016. In 2018, Bitcoin remained volatile and its general price trend was downward, with volatility during the year just a bit lower as compared to that during 2017. I also find that price volatility of Ethereum, Ripple and Bitcoin is higher significantly as compared to Bitcoin.
[Insert Table 4 here]
The market capitalization of Bitcoin is defined as number of Bitcoin tokens in circulation multiplied with the unit price of Bitcoin. Figure 4 shows the Bitcoin market capitalization trend during 2016-18. I find a sudden spike in Bitcoin’s market capitalization during the last quarter of 2017, after which there was a gradual fall. Similar trend in Bitcoin’s market price and market capitalization (which is the product of market price and number of bitcoin’s outstanding) can be attributed to the fact that the rate of new Bitcoins released in the system through mining, is constant in a block of 4 years. New coin release rate for Bitcoin has been constant since 2016 and shall remain so till 2020, after which this will again halve from the 2016-20 levels.
[Insert Figure 4 here]
Bhambhwani, Delikouras and Korniotis (2019) find a significant long-run relationship between cryptocurrencies’ intrinsic value and blockchain trustworthiness and transaction benefits, as well as computing power and adoption level. This hypothesis is motivated by the fact that miners expend real
19
resources (energy) to generate the computing power required to secure and operate the blockchain. Further, an optimally performing blockchain serves as a medium for transactions and attracts users, developers, and intermediaries, thereby allowing for an increase in the network size of the cryptocurrency. The authors test this hypothesis for Bitcoin, Ethereum, Litecoin, Monero and Dash. Using dynamic least square regressions, the authors find that, on average, there is a positive and statistically significant long-term relationship among the price of each cryptocurrency with its own fundamentals (computing power and network).
2.7 Bitcoin mining and transactions
Bitcoin transactions are verified by network of computer programmers called miners, who are paid for their efforts in form of new Bitcoin issuance. Bitcoin creation is called ‘mining’ because it is akin to mine precious metals. Like precious metals, Bitcoin is valuable because of difficulty of creation (i.e. extraction), and scarcity. When a block is successfully mined on the Bitcoin network, there is a block reward that helps incentivize miners to secure the network (Yermack (2013), Harvey (2016)). The block reward is part of a ‘coinbase’ transaction that may also include transaction fees. The block rewards halves roughly every four years (called ‘halving’). Bitcoins have a finite supply, which makes them scarce. The total amount that will ever be issued is 21 million. Chainalysis, a digital forensics company, estimates that somewhere between three and four million already may have been lost (for example, through irrecoverable passwords or people who accidentally threw away Bitcoin collections back when they weren’t worth very much). Bitcoin’s value stems primarily from its scarcity and public faith in Bitcoin as a store of value, means of payment or hedge against inflation. As Bitcoin supply remains limited, price volatility is bound to increase if demand rises and more investors start trading as the cryptocurrency becomes popular due to its investment returns and the increasing awareness of blockchain applications.
The number of Bitcoins generated per block is halved every four years. The final halving will take place in the year 2140. Bitcoins are divisible to eight decimal places. During 2016-20, new Bitcoins are being
20
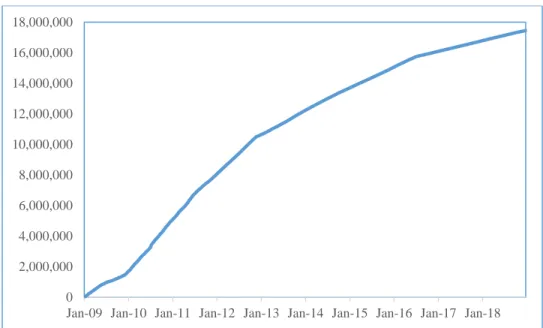
created at the rate of 12.5 Bitcoins every 10 minutes. This will halve to 6.25 every ten minutes after 2020. Ultimately, total supply of Bitcoins will approach (but will never be equal to) 21 million. Figure 5 shows the Bitcoin supply trend. There is a consistent rise in the supply of Bitcoin, as mining becomes a lucrative activity due to Bitcoin price rise, and new Bitcoins consistently being mined after successful verification of transactions.
[Insert Figure 5 here]
The Bitcoin miners also have to invest in expensive computing equipment and the power necessary to find the ‘hash’ that wins the block. The power of the Bitcoin mining network is measured in hashing power, which essentially tantamount to humongous number of operations per second. The Bitcoin mining network has extremely high power capacity that can sustain as high as 9.8 x 10²¹ operations per second (Hileman and Rauchs (2017)). A transaction is when data is sent to and from one Bitcoin address (i.e. wallet) to another. The computer that implements Bitcoin protocol (i.e. Bitcoin client) saves user’s Bitcoins in a file called the wallet, which the user must secure and backup. A Bitcoin wallet is a digital wallet that stores, sends, and receives Bitcoins securely. These Bitcoin wallets connect to one another over the Internet forming peer-to-peer networks, making the system a distributed one resistant to central attack. New Bitcoins are issued to competing “miners” who use their computers to generate solutions to problems that help ensure the integrity and security of the system. As the number of miners in the network changes, the problem difficulty adjusts to ensure that Bitcoins are created at a predetermined rate and not faster or slower. As problem difficulty increases and many miners try to solve concurrently, more powerful systems are required to mine Bitcoins (Hileman and Rauchs (2017)).
2.8 Economics of Bitcoin mining
Bitcoin mining is the process of using computer hardware to do mathematical calculations for the Bitcoin network in order to confirm transactions. Miners collect transaction fees for the transactions they confirm
21
and are awarded Bitcoins for each block they verify. During 2016-20, miners are currently compensated 12.5 BTC per block. Miner’s revenue streams are contingent on 1) the value of Bitcoin, and 2) the reward era’s BTC pay out per block. As the average transactions per block increases, so does the average block size in MB. The proof of work difficulty is adjusted by the system such that blocks are added roughly every 10 minutes. Difficulty is directly related to Bitcoin mining, and how hard it is to verify blocks in the Bitcoin network. Bitcoin adjusts the mining difficulty of verifying blocks every 2016 blocks. Difficulty is automatically adjusted to keep block verification times at ten minutes. The difficulty of mining is rising as more miners join the race to mine Bitcoin. Mishra, Jacob and Radhakrishnan (2017) estimate that every 1% increase in transaction volume leads to 1.015% increase in difficulty of POW (Proof of Work) algorithm for Bitcoin mining. This is because more miners try to verify the transactions as volume increases, and thus level of difficulty increase as Bitcoin issue rate remains constant. Figure 6 shows the difficulty level in last 2 years. Like hash rate, there has been a steady and continuous rise in difficulty level, as more miners attempt Bitcoin mining using higher computing power systems (so that they can solve complex mathematical problem to verify transaction), while Bitcoin award rate remains constant per block.
[Insert Figure 6 here]
Miners verify Bitcoin transactions and are awarded in terms of Bitcoin. The direct cost of Bitcoin transaction has averaged 0.013% of daily transaction volume (Hileman and Rauchs (2017)). These are discretionary fees intended to incentivize miners to include their transaction in the next block. The total fee to miners, i.e. compensation to miners for verifying transactions and running the blockchain is actually c. 1.3% of daily transaction value. In the past, it has been much higher, peaking at 8% in 2012, and 6% in mid-2014. 1.51% of the miners’ revenue is earned through transaction fees (which miners earn after successfully verifying a Bitcoin transaction).
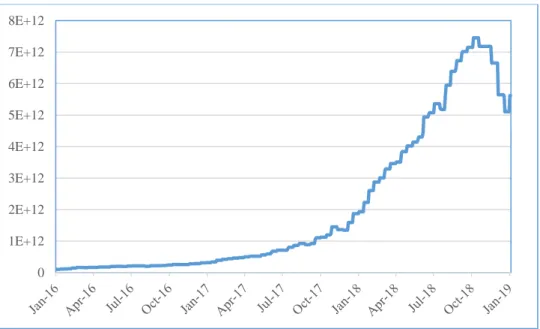
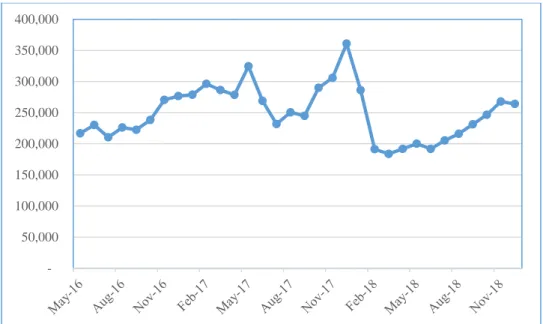
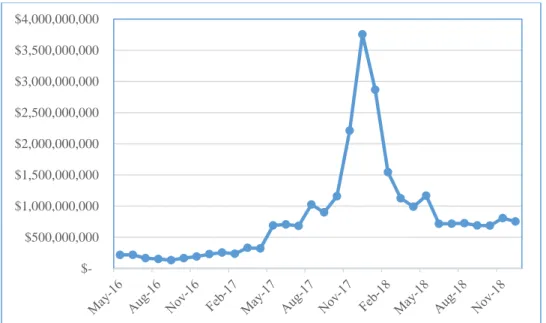
Chinese Yuan (Renminbi) transactions have dominated Bitcoin trading volume. Figure 7 shows the trend of average daily number of transactions during the period 2016-18. Figure 8 shows the average daily Bitcoin
22
transaction value during the same time-period. Figure 9 shows the average transaction volume during the same time-period. The trend of number of transactions and the transaction volume shows that Bitcoin transactions are not increasing with time. The transaction value has increased with Bitcoin price and fallen with the same.
[Insert Figures 7, 8 & 9 here]
Bitcoin transaction cost is due to fee paid to miners, who verify transactions and are thus awarded in form of Bitcoin (Harvey (2016)). With transaction cost still under $150 and Bitcoin price, a few thousand dollars, mining is a profitable activity. Figure 10 shows cost per Bitcoin transaction. As the graph shows, the transaction cost moves in tandem with the Bitcoin price.
[Insert Figure 10 here]
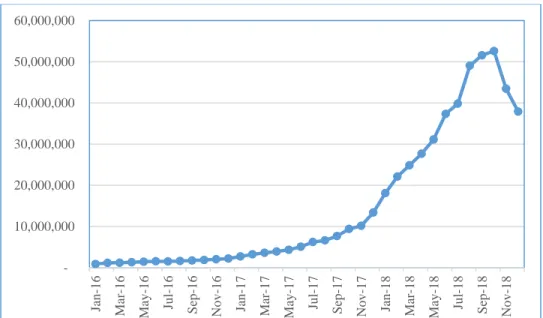
As Bitcoin popularity and acceptance as a payment mechanism grows, the number of Bitcoin wallet users are growing. Figure 11 shows the number of Bitcoin wallet users during 2016-18. There is a consistent growth in number of Bitcoin wallet users, from approximately 5.66 million in Jan-2016 to approximately 31.54 million in Dec-2018.
[Insert Figure 11 here]
With hash rate and difficulty in mining increasing exponentially, miners have to employ extremely powerful computing systems to successfully verify the transactions and thus get awarded in terms of Bitcoin. These systems are highly power intensive. Thus, profitability in Bitcoin mining is contingent upon the cost of power consumption as well. Bitcoin mining remains a profitable activity until the time mining cost (due to power consumption) remains lower than the Bitcoin market price.
Bitcoin is enabled by a network of computers running Bitcoin mining software. This software consists of a copy of all past Bitcoin transactions in the form of a blockchain, and a program that connects to peers in
23
the network and follows a set of rules to authenticate new transactions and add blocks of these to the chain. The Bitcoin blockchain is extremely efficient in terms of data usage. Figure 12 shows the size of the Bitcoin blockchain in recent past (c.150 GB in January 2018).
[Insert Figure 12 here]
2.9 Power Consumption
Bitcoin mining is a very power intensive activity, since very high capacity computing systems are required to verify transactions. Hence, power consumption is a significant component of the Bitcoin mining cost. Miners have incentive to use higher computing power in mining, since it increases their chances of verifying transactions and thus getting reward. Higher computing power leads to higher cost of electricity, hence miners increase computing power they run until their marginal cost of electricity equals their marginal revenue. This has several implications:
■ Energy inefficiency: The total hash rate (the number of brute force calculations the network can achieve) is 1,630,722,753 GH per second. Given a conservative estimate of MW:GH at 0.3, the total network power draw is c.500MW. The sophisticated mining devices are energy hungry and burn 0.8 – 2.0 kWh of electricity (Mishra, Jacob and Radhakrishnan (2017)).
■ Race to the bottom: Electricity prices exhibit a wide regional skew, and miners based in regions with lower electricity costs have a competitive advantage, leading to a high concentration of the hash rate in lower electricity cost locations.
The more lucrative the price of Bitcoin, the more people worldwide who connect to the network to mine the digital currency and earn the rewards. The Bitcoin network regularly needs to increase the difficulty of mining to allow for more mining capacity without overloading the network. Miners must always add more
24
power to compete with other miners for the rewards. Therefore, Bitcoin’s price is directly proportional to the amount of electricity that can profitably be used in the mining process.
Statistics from Digiconomist.com reveals that as Bitcoin broke the $9,000 mark for the first time, the Bitcoin mining network was using more electricity in a year than the whole of Ireland. At these levels, Bitcoin uses around 300 KWh of electricity. As a comparison, one of Visa’s two data centers in the US runs on about 2% of the power that Bitcoin demands. Combined, Visa’s two US data centers process approximately 200m transactions per day. On the other hand, Bitcoin handles less than 350,000 per day. Such comparisons raise serious questions around Bitcoin’s long-term sustainability and environmental impact. At the current growth of power consumption by the Bitcoin miners, it is surmised that if such growth rate sustains, Bitcoin mining may consume more power than many countries in the world do. China dominates the mining market, with 60-85% of all Bitcoin network processing power coming from China mining pools. Cheap electricity and labor – alongside leadership in mining hardware – are the main factors contributing to China’s dominance in the mining market. At its peak, Bitcoin was consuming around 1/300 of total global power supply (Digiconomist.com (2018)). Table 5 shows Bitcoin’s power consumption statistics. Bitcoin mining became less lucrative for Bitcoin miners in 2018 as the Bitcoin price fell consistently. This led to reduction in Bitcoin mining, with annualized mining revenues (during past 12-months) earned by Bitcoin miners also falling from $5.4 billion to $2.4 billion from May-2018 to Dec-2018, and mining cost as a percentage of mining revenue increased from 65.4% to 95.6% during the same time. Total electricity consumption due to Bitcoin mining during this period also decreased by ~31.6%, from estimated 71.12 Tera Watt-hour to 47.65 Tera Watt-hour. By December-2018, Bitcoin mining was still consuming 1/500th of global power supply.
25
2.10 Bitcoin and financial markets
Cryptocurrencies are traded on dedicated exchanges that function 24/7, as opposed to traditional stock exchanges that function mostly on dedicated hours on the weekdays. Some of the top exchanges that trade Bitcoin and other cryptocurrencies are Bitfinex, Bitstamp, Coinbase, HitBTC, itBit, Kraken, Gemini etc.
Table 6 shows top Bitcoin exchanges by volume.
[Insert Table 6 here]
At the onset of the year 2017, Bitcoin essentially was the cryptocurrency market. Since then, over 1600 different cryptocurrencies have been launched (by 2018), thus pushing Bitcoin’s share of the total cryptocurrency down to a minority share at roughly 40%, despite the historic gains of the currency in 2017. The highest trading cryptocurrencies are Bitcoin, Ethereum, Bitcoin Cash and Ripple. Bitcoin remains a dominant cryptocurrency and represents the macro landscape of the cryptocurrency market. Ethereum is the second largest traded cryptocurrency after Bitcoin. Unlike Bitcoin, whose architecture is built on Proof-of-Work algorithm, Ethereum is more robust, and is essentially a platform that can host software applications also. The name of the cryptocurrency on Ethereum platform is called Ether. Table 7 shows the top Ethereum exchanges by volume.
[Insert Table 7 here]
Ripple and Bitcoin Cash are other top traded cryptocurrencies. While Ripple is a separate cryptocurrency,
Bitcoin Cash was forked out of Bitcoin on 1-Aug-2017. Since cryptocurrencies are built on a software platform, it is possible to add new features to them. This process is called forking. After forking, Bitcoin Cash is traded separately on exchanges. Due to their high volatility, cryptocurrencies are often compared to stocks, rather than the traditional currencies. Yermack (2013) argues that Bitcoin does not behave much like a currency according to the criteria widely used by economists. Instead Bitcoin resembles a speculative investment similar to the Internet stocks of the late 1990s.
26
2.11 Bitcoin - Challenges and risks
Bitcoin attempts to overcome the weaknesses of both fiat and gold-based money, by functioning as an algorithmic currency with a deterministic supply and growth rate tied to the rigor of mathematics. No government or other central authority can manipulate the supply of Bitcoins. Instead the currency is governed by cryptographic rules that are enforced by transparent computer code in a decentralized manner. Nonetheless, Bitcoin faces challenges in meeting all three criteria of a successful currency, viz. medium of exchange, unit of account and store of value (Yermack (2013). Comparing with millions of transactions every day on the Visa network, Bitcoin has a mere thousands, due to its mathematical intensity of transaction verification. Moreover, very few merchants are registered with Bitcoin exchanges like
Coinbase. For Bitcoin to establish itself as a bona fide currency, its value will need to become more stable so that it can reliably serve as a store of value and as a unit of account in commercial markets. The high volatility of Bitcoin and other cryptocurrencies is more consistent with the behavior of a speculative investment rather than a currency.
Bitcoin’s future and legitimacy as a currency would also hinge on its integration into the web of international payments and risk management transactions. Even though it is not issued by a sovereign state, Bitcoin imparts risk to any business that accepts it for transactions, just like all other currencies. Major companies that deal in more than one currency, such as multinationals, attempt to hedge themselves against risks related to changes in those currencies’ values. Yermack (2013) states that no effective way exists to hedge Bitcoin against the value of other currencies, and the absence of any swap, forward, or other derivative markets for Bitcoin exacerbates this problem. Bitcoin transactions also are risky due to the absence of basic consumer protection, such as the provision of refunds that result from disputes between merchants and customers. While local laws may provide ground rules for resolving such disputes, because a government has no legal way to foreclose and take possession of Bitcoins, it ultimately has little ability
27
to step in and enforce its laws. Similar problems arise in attempting to secure consumer credit denominated in Bitcoin or to pledge Bitcoins as collateral for a consumer loan. Also, due to its lack of affiliation to any sovereign agency, Bitcoin is ill-suited for use in credit markets because no government can foreclose and seize it in order to recover the loss, in the unfortunate event of a default.
Bitcoin also appears to suffer by being disconnected from the banking and payment systems of the U.S. and other countries. Most currencies are held and transferred through bank accounts, which in turn are protected by layers of regulation, deposit insurance, and international treaties. Without access to this infrastructure, Bitcoin has proven vulnerable to fraud, theft, and subversion by skilled computer hackers. However, Bitcoin bypasses the well-known flaws in standard financial security systems, which have spawned epidemics of identity theft and related problems for ordinary customers of mainstream businesses (Parham (2017)).
28
CHAPTER 3
Financial Bubbles
“….What I am proposing is that we try to identify bubbles in real time, try to develop tools to address those bubbles, try to use those tools when appropriate to limit the size of those bubbles, and therefore try to limit the damage when those bubbles burst.”
- William Dudley, President of the New York Federal Reserve in 2010
3.1 Introduction
‘Financial bubbles’ refers to large, sustained mispricing of financial or real assets, where the mispricing may last for an extended period. Bubbles occur in periods in which the price of an asset consistently exceeds fundamentals because investors believe that they can sell the asset at an even higher price to some other investor in the future. Bubbles are caused and sustained due to investors who buy assets due to their replacement prices rather than their fundamental value. While a mere mispricing does not necessarily mean that an asset is in a bubble, a market price consistently above the fundamental price, with large volume of trading (buying and selling) in the asset, suggests a bubble. Asset valuation in bubble periods is often explosive.
Mathematically, bubble βt at time t is defined as: βt = St – St*
(Protter (2013)) where, St : market price, and St* : fundamental price of the asset
29
Bubble exists if βt >> 0 for a significant period of time. A strong bubble is when market price is much greater than the fundamental price for consistent length of time. The fundamental price is expressed as a conditional expectation of future cash flows at the risk neutral measure. The risk neutral measure is unique in a complete market (where transaction costs are limited, information flow is perfect and there is a price for every asset in every possible state of the world), whereas incomplete markets have infinite number of risk neutral measures. The fundamental value of asset is derived from underlying stream of cash flows that the asset generates. If this stream is volatile, then the underlying risk of the asset increases. The swift rise and fall in the market price of Bitcoin and other cryptocurrencies indicates volatility. The question arises whether this volatility is caused due to high deviation of cryptocurrency’s market price from its fundamental price. If such is the case, then this makes the case for a bubble.
3.2 History of financial bubbles
Through the history, the global economy has seen number of financial bubbles (Protter (2013)):
(a) A bubble known as Tulipmania, which occurred in Amsterdam (circa 1634 – 1637), is the first documented bubble of the modern era. As tulips became a fad, some rare tulip bulbs that were obtained through hybrid and expensive techniques led to massive speculation in the prices of bulbs, which got inflated to extremely high levels, thus creating an economy-wide bubble. When the bubble burst, the investors lost significant part of their investment.
(b) In the eighteenth century, Banque Royale (Paris, circa 1716 – 1720) financed the crown’s war debts by selling off notes, giving investors the rights to the gold that was yet to be discovered in the Louisiana territories (which was part of France then). When no gold was found there, the bubble collapsed and it led to an economic catastrophe. Subsequently, the public distrust of French banks lasted for almost a century after this episode.
30
(c) The South Sea Company of London (circa 1711 – 1720) sold the British investors the rights to the gold of Inca and Aztec civilizations in South America, notwithstanding the fact that Spanish controlled such trade and had command of the high seas at the time. As the British public realized this, the bubble collapsed. This led to British Parliament passing the ‘Bubble Act of 1720’, which among other things, forbade the issuance of stock certificates.
(d) The Japanese housing bubble (circa 1970–1989), which upon collapsing led to Japan’s ‘lost decade’ – a decade characterized with a stagnant economy and ‘zombie’ banks.
(e) The United States has had the most prominent financial bubbles: – The 1816 crash due to real estate speculation.
– Construction of the Erie Canal connecting New York to Chicago through inland waterways created “irrational exuberance” (in words of Alan Greenspan), which culminated in the Crash of 1837.
– A few decades later, another wave of irrational exuberance erupted due to the construction of the railroad system within the U.S. It culminated in the Panic of 1873.
– The Wall Street panic of October 1907 saw market falling by 50%. J.P. Morgan’s prestige and personality helped save the economy and the banking system. Its aftermath created the atmosphere that led to the creation and development of the Federal Reserve in 1913, via the Glass–Owen bill. – The Great Depression of 1929 began with a great bubble built by the Florida land speculation as
people were lured to buy swamp land that was touted as beautiful waterfront property. This seamlessly moved into building a massive stock market bubble, which burst and brought the Great Crash of 1929, and subsequently the economic depression.
– The rise in ‘junk bond financing’ by Michael Milken created a bubble in the 1980s.
– In the late 1990s, the speculation built by the commercial promise of internet (e-commerce) led to swift rise in the stock market and e-commerce stocks in particular, and created a bubble, which
31
when burst, led to the ‘dot-com crash’. The market downturn started from March 2000, and lasted until October 2002. During this period, Nasdaq Composite index lost 78% of its value.
– The housing bubble in the US, which was tied to subprime mortgages, started in early 2000s. It led to creation of many derivative securities like ABS, CDO, CDS etc., which were created by the process of securitization, i.e. pooling of assets (mortgage loans). When the bubble burst in 2008, it created a financial tsunami, which engulfed well-respected investment banks like Lehman Brothers and Bear Stearns. The crisis had immediate cascading effect, and spread far across the world, while resulting in bankruptcy in countries like Iceland and Dubai.
3.3 Causes and stages of financial bubbles
3.3.1 Causes of financial bubbles
The theory of rational markets (Camerer (1989)) states that all assets should trade at their fundamental or fair value, since rational investors and traders should buy an asset if it is undervalued and sell an asset if it is overvalued. This theory eliminates the possibility of a bubble. However, this theory does not hold always, and financial bubbles do occur because of actions of irrational investors. Contrary to the common “rational expectations” framework for bubbles, economists like Hyman Minsky, Charles Kindleberger and Robert Shiller have documented that irrational behavior, ambiguous information or certain limits to arbitrage are essential drivers for bubble phenomena and financial crises (Schatz and Sornette (2019)).
Galbraith (1993) states that bubbles often come into being when there is a sudden euphoria because of a big change. He mentions that speculation on a grand scale occurs when there is a new (or perceived as new), technological breakthrough. It can result in over-enthusiasm and uncontrolled speculation, thus resulting in asset pricing reaching very high an