Marketplaces for Data: An Initial Survey
Fabian Schomm
1Florian Stahl
1Gottfried Vossen
1,21European Research Center for Information Systems (ERCIS)
University of Muenster, Germany
firstname.lastname@uni-muenster.de 2Waikato Management School
The University of Waikato, New Zealand
ABSTRACT
Data is becoming more and more of a commodity, so that it is not surprising that data has reached the status of tradable goods. An increasing number of data providers is recognizing this and is consequently setting up plat-forms for selling, buying, or trading data. We identify several categories and dimensions of data marketplaces and data vendors and provide a snapshot of the situation as of Summer 2012.
1. INTRODUCTION
Today information is one of the crucial driving factors for most businesses. Only if high quality information is available, correct decisions (i. e., de-cisions in the interest of company revenues) can be made on a rational and well-founded basis. De-spite the sheer quantities of data available on the Web, such information is not always easy to find, and data marketplaces, surveyed in this paper, are one of several recent developments to remedy this situation.
Shortly after the arrival of the Web in the early 1990s a new category of professionals emerged who took on the function of information intermediaries. To these intermediaries search task could be given, who would then search the Web correspondingly (for a fee) and return the results found. In 1998 the term data marketplace was probably first used by
ArmstrongandDurfee [1], who modeled trad-ing of information between digital libraries, focustrad-ing on the motivation and behavior of participants and identifying factors that affect cooperations in a net-work.
Thanks to advances in technology, but also to the vast amount of data available nowadays, nu-merous new forms of marketplaces for data have emerged. A modern information intermediary or information marketplace in our understanding is a platform through which data can be purchased or
sold. Commonly, they process, sell, and re-sell data available on the Web. By doing that, these plat-forms can provide added value in numerous ways. First, some data may be hard to find and scattered across numerous websites. A data vendor that ag-gregates these single datasets into a bigger and more refined one performs a service that makes it easier for customers or end-users to access relevant data. Sec-ondly, datasets from different providers often have different access mechanisms and formats. There-fore, offering one single mechanism to access data in a consistent format can save time and money for customers.
This has also been realized by information provi-ders who seek commercialization of their data. In accordance with that, it can be observed that ev-ermore suppliers of data emerge. Aggregating and curating this data into accessible and understand-able datasets is a business opportunity with high potential, driven by the over-supply of data.
While there have been small, not primarily scien-tific surveys of data marketplaces ([7, 10, 11]) and research on specific data marketplaces such as the Windows Azure Marketplace [9] and others (e. g., [12]), there is—to our knowledge—to date no com-prehensive survey and comparison of multiple data marketplaces and data vendors. Therefore, we have conducted such a survey, including a total of 46 sup-pliers of data. The study was conducted from April to July 20121 with the aim of identifying categories and dimensions of data marketplaces as well as ven-dors of data in order to build a taxonomy for data marketplaces.
1The list of companies surveyed can be found
at http://dbis-group.uni-muenster.de/temporary_ downloads/SurveyList.pdf, and we are happy to pro-vide the full data of the survey upon request. However, because data marketplaces are a very vivid field and change fast, it has to be pointed out that Kasabi went out of business since the survey was taken.
Surveying the current state of affairs in this field can be seen as the first step in analyzing and un-derstanding this emerging market. We plan on re-peating this study annually in order to gain further insight about what has changed, which competitors have been successful or not and why, which models and practices have proven themselves, etc. Research-ing the market and its developments can not only help understanding the market dynamics but also can give valuable insights into the emergence or ap-plication of new technologies and, thus, present new research opportunities.
The remainder of this paper is organized as fol-lows: First, the survey approach will be described in Section 2. Then we present our findings, i. e., group-ings and categorizations in Section 3. Section 4 gives an overview of related work that has been conducted in this area. The paper is concluded by summarizing our findings in Section 5.
2. METHODOLOGY AND APPROACH
In this section, we first elaborate on what we consider to be a data market or data vendor. Then we explain how the survey was conducted, using an iterative approach for both collecting data suppliers and deriving categories in Section 2.2. Section 2.3 discusses limitations of the method applied.2.1 Data Marketplaces and Data Vendors
In the context of this work we have analyzed data vendors and data marketplaces. In order to restrict the potentially vast amount of companies, we have focused on companies offering either a platform for trading data (e. g., datamarket.com), raw data in any form (e. g., www.data.gov), or data enrichment tools (e. g., attensity.com). In order to gain a com-parable set of data vendors, we have chosen to focus on vendors that offer online Web services. This im-plies that we have excluded offline products for data cleansing or data fusion and similar tasks.
We define adata marketplace as a platform on which anybody (or at least a great number of po-tentially registered clients) can upload and maintain data sets. Access to and use of the data is regulated through varying licensing models.
A data vendor has data and offers it to others, either for a given fee or free of charge. However, it is not important how vendors obtain this data, and many ways are common, e. g., aggregation from freely available sources, generation using proprietary methods, or buying from other vendors. It is impor-tant to note that a data vendor can offer its data either on its own or through a data marketplace as described above. Conversely, it is also possible
that a data marketplace operator sells data and thus takes on the role of a vendor.
In our understanding, data marketplaces and data vendors have evolved from traditional Web crawlers and search engines as they all provide users with data. That is why we chose to also include crawlers and search engines that were comparable. Addition-ally, we also looked at data enrichment services that take input from the user and enhance it in some way, e. g., by analyzing or tagging it. Seeing how these services face the same data curation challenges as data marketplaces do, we allowed them into this survey.
2.2 Data Acquisition and Approach
The initial set of vendors consisted of well-known suppliers we found in previous research [14]. From this starting point, keywords were derived that were then used for a broader online search, which in turn revealed a more comprehensive set of different prod-ucts and services.We came up with a set of twelve dimensions along which the vendors considered can be categorized. As not all dimensions are measureable, and the di-mensions are grouped into objective and subjective dimensions to clarify where our own opinion has influenced the results. Table 1 shows the dimen-sions that we used, the categories that constitute this dimension as well as the questions we asked to conduct this survey.
The values in our approach are strictly Boolean. An offering either fulfills the criteria for a certain dimension category or it does not. However, cate-gories are not mutually exclusive in most cases. This means that, e. g., one offering can fall into multiple categories, have multiple pricing models, or provide multiple ways for data access. Some dimensions (e. g., maturity), however, are mutually exclusive. Where this is the case, it will be stated explicitly in the dimension description in Section 3.
The facts about the data vendors were gathered by means of a Web search. As every vendor or marketplace has a website, this publicly available information was used to determine how to categorize each vendor. After having done that with the initial set of vendors, it was checked how many entries a category had to justify its existence. When a cat-egory had only few entries, a new Web search for more data suppliers falling into that category was started in order to make sure no important vendors were omitted. If more companies were found, the list was extended iteratively, and the new companies were analyzed regarding the other dimensions.
How-Table 1: Set of dimensions.
Dimension Categories Question to be answered
obj
ective
Type Web Crawler, Customizable Crawler, Search Engine, Pure Data Vendor, Complex Data Vendor, Matching Vendor, Enrichment Tagging,
Enrichment Sentiment, Enrichment Analysis, Data Market Place
What is the type of the core offering?
Time Frame Static/Factual, Up To Date Is the data static or real-time? Domain All, Finance/Economy, Bio Medicine, Social Media,
Geo Data, Address Data
What is the data about? Data Origin Internet, Self-Generated, User, Community,
Government, Authority
Where does the data come from? Who is the author? Pricing Model Free, Freemium, Pay-Per-Use, Flat Rate Is the offer free, pay-per-use or usable with a flat rate? Data Access API, Download, Specialized Software, Web
Interface
What technical means are offered to access the data? Data Output XML, CSV/XLS, JSON, RDF, Report In what way is the data formatted for the user? Language English, German, More What is the language of the website? Does it differ
from the language of the data? Target Audience Business, Customer Towards whom is the product geared?
subj
ective
Trustworthiness Low, Medium, High How trustworthy is the vendor? Can the original data source be tracked or verified?
Size of Vendor Startup, Medium, Big, Global Player How big is the vendor?
Maturity Research Project, Beta, Medium, High Is the product still in beta or already established?
ever, if no more companies were found, the category definitions were reconsidered and updated.
2.3 Limitations
The information we used was taken directly from the website of each vendor. This may limit the accuracy of our findings in some cases, where the description of a product exceeds the actual function-ality. Verifying that every product fulfills its own description is a task that goes beyond the purpose of this survey. Random samples, however, indicate that the descriptions commonly match the services provided. Nevertheless, there are also cases where the information provided on a vendor’s website was not sufficient to categorize all dimensions. This was particularly the case for B2B vendors, which only re-veal their pricing models upon request. We chose to leave these dimensions out than to speculate about their value. As a result, however, the numbers of these dimensions are minimally skewed.
The market of data vendors and data market places is highly active, i. e., new actors emerge and others disappear, and the market as such is growing rapidly. Therefore, it cannot be guaranteed that this study is fully exhaustive with regard to the number of vendors in the market. That said, we are confident that during our observation period from April to July 2012 we have obtained a representative sample that allows for a meaningful analysis. Furthermore, it has to be stated that data trading channels are not necessarily made public. This means that we are aware of the fact that a certain amount of data is traded directly between (large) corporations or
within a certain ecosystem (such as social networks) without the use of intermediaries. It is obvious that it is impossible to investigate those forms of data trading using our Web survey approach.
3. FINDINGS
As stated in the previous section, the following twelve dimensions have been examined: Type, Time Frame, Domain, Data Origin, Pricing Model, Data Access, Data Output, Language, Target Audience, Trustworthiness, Size of Vendor,andMaturity. To structure these dimension we have categorized them into objective and subjective measures, i. e., whether the classification within each dimension can be easily verified or whether the classification is down to the researcher’s judgement.
3.1 Objective Dimensions
3.1.1 Type
The first dimensiontype is used to classify vendors based on what their core product is. In order to form a common understanding of the different categories these are explained below:
• (Focused) Web Crawler: Services that are specif-ically designed to crawl a particular website or set of websites. These are always bound to one domain, e. g., spinn3r is a service that is specialized on indexing the blogosphere.
• Customizable Crawler: General purpose craw-lers that can be set up by the customer to crawl
0 5 10 15 20
Figure 1: Number of vendors for each Type. any website and search for arbitrary content.
For example, 80legs offers such a service, in which customers can define regular expressions to crawl a set of sites.
• Search Engine: Services that offer their con-tent via an interface similar to a search engine. Customers specify combinations of keywords as input and the search engine produces out-put relevant to that inout-put. FactForge is such a search engine that represents an interface to the Linking Open Data cloud.
• Raw Data Vendor: This category comprises vendors that offer raw data, most often in the form of tables or lists. For example, Factual offers lists of restaurants, hotels, and other points of interest.
• Complex Data Vendor: These vendors offer data that is the result of some kind of analysis process. For example, The Stock Sonar pro-vides information about current stock prices as well as indicators on how individual shares might develop in the near future.
• Matching Data Vendor: Vendors that offer the matching of input data against some other data-base. These vendors most often operate in domains where a customer does not want a complete dataset, but rather needs the data they already have corrected or verified, e. g., address data. Companies like AddressDoctor are specialized in this area.
• Enrichment – Tagging: This category describes services that enrich a given input (mostly text, but other forms are also possible) through means of tags. This enables customers to make
more use of their data. Calais for example creates metadata for content submitted using natural language processing.
• Enrichment – Sentiment: With the prolifera-tion of social media websites on the internet, a multitude of vendors has emerged that spe-cialized on what is commonly referred to as sentiment analysis [15]. Given the name of a brand or a product, these services try to capture and analyze the sentiment of people towards that subject. This kind of service is, for example, offered by Salesforce under the name Radian6.
• Enrichment – Analysis: The data offered is enriched with analysis results obtained through various means, like comparisons with historical data or forecasts. Attensity Analyze is one of such services, offering customer analytics across multiple channels.
• Data Market Place: These services allow cus-tomers to both buy and sell data by providing the infrastructure needed for such transactions. A prime example for this type of vendor is Microsoft’s Windows Azure Marketplace. Figure 1 shows how many vendors fall into which category. It has to be kept in mind, though, that these categories are not mutually exclusive and one vendor can fulfill the criteria of multiple categories. Also, it should be noted that this histogram only shows a distribution over our sample and does not represent the entire market. This is owing to the fact that (as stated in the Section 2) we have intentionally excluded offline providers and tools.
3.1.2 Time Frame
The time frame dimension captures the temporal context of the data. We distinguish two categories in this dimension:
• Static/Factual: Data is valid and relevant for a long period of time and does not change abruptly, i. e., population numbers, geographi-cal coordinates, etc.
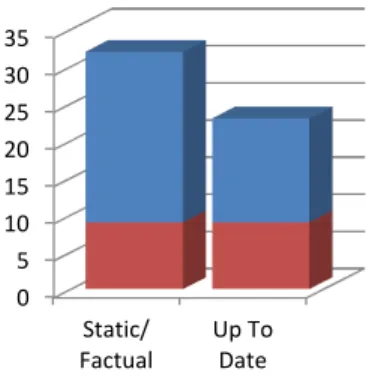
• Up To Date: Data is important shortly after its creation and loses its relevance quickly, i. e., current stock prices, weather data, or social media entries.
As evident from Figure 2, we found that static data (32 offerings) was offered more often than up-to-date data (23 offerings). Some vendors offer data from both these categories. For example, Data.gov offers real-time data about worldwide earthquakes for the past 7 days as well as a dataset containing information on the total calories of commonly eaten foods. However, we found that only less than 20% (9 offerings) of the surveyed vendors offer both static and up to date information. This suggests that generally data vendors tend to specialize in either of the two options.
0 5 10 15 20 25 30 35 Static/ Factual Up To Date
Figure 2: Number of vendors for Time Frame.
3.1.3 Domain
The dimensiondomain describes what the actual data is about. While most domain names are self-explanatory, domainanydeserves clarification. This domain was used to classify vendors whose offers are not restricted and could incorporate arbitrary domains. For example, the Windows Azure Mar-ketplace is not focused on a specific domain, which means that all different kinds of data can be found there. Whilst other domains were not mutually ex-clusive (i. e., a vendor could supply more than one domain), vendors serving any domain did not count
towards explicit domains. The results are shown in Figure 3.
It is obvious that the any domain is by far the biggest group. An explanation for this is that data market places, search engines, and customizable crawlers do indeed serve any domain, depending on what customers choose to upload or search for. Given that they account for more than a fourth of all companies under investigation, the peak in any is not surprising. The other domains have a lower number of vendors, because they are more specialized. Furthermore, we have observed that the geo data (7) and address data (8) domains have a significant overlap (6), which can be explained by their obviously close relationship. Companies like AggData specialize in providing high-quality data about customers and their locations, so they fit into both categories. Address and geo data are, however, not the same, as evidenced for example by CustomLists.net, who offer only address data for marketing purposes.
3.1.4 Data Origin
The origin of data describes where it comes from. We have identified six different categories in this dimension:
• Internet: The data is pulled directly from a publicly and freely available online resource.
• Self-Generated: Vendors have means of gener-ating data on their own, i. e., manual curation of a specific dataset or calculating forecasts based on patented methods.
• User: Users have to provide an input before they can obtain any data, i. e., address data offerings that return the address for a given name.
• Community: Based on a wiki-like principle, these vendors obtain and maintain their data in a very open fashion. The restrictions as to who can participate and contribute are usually rather low.
• Government: Governments capture and pro-cess huge amounts of data and have recently begun to make this data publicly available.
• Authority: Authorities in a domain are enti-ties which are the main provider of data, i. e., the stock market for stock prices or the postal offices for address data.
In our survey the most popular origin category was the Internet. Almost 50% of all vendors receive their data from an online source. Another category
0 5 10 15 20 25 30 Any Finance/ Economy Bio Medicine Social Media
Geo Data Address Data
Figure 3: Number of vendors for each Domain.
0% 5% 10% 15% 20% 25% 30% 35% 40% 45% 50%
Figure 4: Data origin distribution. with a large number of vendors wasauthority: 32%
obtain their data from authoritative sources. For example, Intelligent Search Technology claims that their address verification service is certified by the U.S. Postal Service. The main advantage of these offers is that the data is usually of high correctness, completeness, and credibility. This also holds for thegovernment category, into which fell 15% of ven-dors. The categoriesself-generated andcommunity are matched by 15% and 19%, respectively. The problem with self-generated data is that there is no transparency in the data sourcing process. For ex-ample, CustomLists.net does not reveal where they get their data from, which might raise concerns re-garding credibility or correctness. Lastly, category user with 15% is a special case because it cannot stand on its own, i. e., every vendor classified into this category also gathered data from another source. This is inherent to the definition of this category, according to which users submit their data and re-ceive it back with additional annotations for which a vendor needs additional data sources. These facts are illustrated in Figure 4.
3.1.5 Pricing Model
Pricing models are very important to understand-ing how exactly the different vendors set up their business models. Four main pricing models could be found; the number of vendors for each model is illustrated in Figure 5. A verbal explanation of the pricing models is provided by the following list:
• Free: These services can be used at no charge. Reasons for offering a service for free are, among others, that it is only a beta test or research project, the vendor is a public authority funded by tax money, or simply interested in attract-ing more customers. For example, Data.gov is free as it is a website of the U.S. government. Vendors in this category do not count towards one of the following categories.
• Freemium: As a portmanteau combining free and premium, this pricing model offers a lim-ited access at no cost with the possibility of an update to a fee-based premium access. Free-mium models are always combined with at least one of the following two payment models.
• Pay-Per-Use: Customers are billed based on how much they use the respective service. This manifests mostly in the form of x$ per thousand API calls.
• Flat Rate: After paying a fixed amount of money, customers can make unlimited use of the service for a limited time, mostly a month or a year. 0 2 4 6 8 10 12 14 16
Figure 5: Number of vendors for each Pric-ing Model.
An example for the combination of the Freemium and Pay-Per-Use model is Factual.com. Their API may be called up 10,000 times per day for free. Any additional calls have to be paid for. The CloudMade Data Market Place, on the other hand, combines Freemium with Flat Rates by offering free trials for their datasets and unlimited access for an annual fee.
3.1.6 Data Access
Thedata accessdimension describes through which means end-users receive their data from vendors. The main categories identified and presented in Fig-ure 6 are:
• API: An API (application programming in-terface) is used to provide a language- and platform-independent programmatic access to data over the Internet.
• Download: Traditional download of files is the easiest way to access a data set, because anyone can use such a service with only a Web browser.
• Specialized Software: Some vendors have im-plemented a specialized software client to con-nect with their Web service. While this ap-proach does have downsides (implementation and maintenance expense, dependency issues, etc.), there are some scenarios in which the con-cept is worthwhile, for example, providing the customer with an easy-to-use graphical user in-terface as an out-of-the-box solution that needs
no further customization, or granting access to real-time streams of data.
• Web Interface: In a Web interface, the data is displayed to the customer directly on a website. The flexibility and modularity of APIs have made these the most popular of all access methods. More than 70% of all vendors offer an API. However, less than 30% of all vendors have an API as their only way to access data. Most vendors offer an API next to other methods. For example, Web interfaces or file downloads are used to give previews of the dataset, to make it easier and more accessible for the customer to see what the actual data looks like, e. g., Factual.com has an extensive Web frontend that ren-ders tables or geodata. The concept of specialized software does not seem to stand very well on its own. Out of all investigated vendors, only three use specialized software as the only way of data access. For example, MeaningMine provides the user with a dashboard-like interface that shows graphs and important numbers. However, this approach lacks flexibility, because customers are restricted in the way they can use the data by the functionality of the provided software. Nevertheless, most customers who want data do not want any restrictions on how they can access and process the data. From a theo-retical point of view, it seems to be the best approach for a vendor to offer all the aforementioned means of access to his data, because that allows customers to choose their preferred way of access. However, we have not found a single vendor that does so, which is probably due to the high cost associated with creating such a broad offering.
3.1.7 Data Output
This dimension shows the format in which data can be obtained. To us, the most reasonable set of categories in this dimension is the following:
• XML: Being both human- and machine-read-able, the Extensible Markup Language is a widely established standard for data transfer and representation.
• CSV/XLS: Most structured data is laid out in a tabular way, so it makes sense to wrap it into a table file format. We do not distinguish between CSV and XLS and other table file formats, because the main differences between them, like formatting and embedding, do not apply when you are showing raw data
• JSON: The JavaScript Object Notation is sim-ilar to XML and is also used as a data transfer
0% 10% 20% 30% 40% 50% 60% 70% 80%
API Download Specialized Software
Web Interface
Figure 6: Data Access distribution.
0 5 10 15 20 25 XML CSV/ XLS JSON RDF Report
Figure 7: Number of vendors per Data Output category. format. Data is represented as text in
key-values pairs.
• RDF: The Resource Description Framework is a method to describe and model information. It uses subject-predicate-object triplets to make statements about resources. Due to its graph data model, it is a good choice for data that is inherently graph-shaped.
• Report: When data is preprocessed, aggregated and “prettified” in some way, we declared the output as a report. The main difference in this category is that the customer does not have in-sight into the underlying raw data. Also visual reports in the form of MS Excel spreadsheet classified for this category.
The most popular category in the output dimen-sion shown in Figure 7 is CSV/XLS. With 22 ven-dors, almost half of all vendors considered offer the possibility to receive their data as a raw table. How-ever, only six of those vendors have CSV/XLS as their only output format. Most vendors also of-fer either an XML (10) or a JSON (6) interface, some even both (3). This is consistent with the
observation from the previous dimension, that an API is the most popular way of data access. An API usually produces XML or JSON output. Offer-ing many ways to access data is a key feature of a data marketplace, because it broadens the range of possible users. DataMarket.com therefore supports all aforementioned output categories except RDF. Other competitors, however, do not provide all these different access mechanisms. The Infochimps Data Marketplace favors JSON over XML for their API. It remains to be seen what further implications this technical limitation may have.
3.1.8 Language
We have focused on the English and German lan-guages because of personal language skills. Thus, further differentiations in this dimension were not possible. Therefore, any additional languages we encountered were aggregated into a third category called more. Although English is a dominant lan-guage on the Internet, we would be happy to cooper-ate with other researchers with other language skills in a future edition of the survey.
The analysis of language distinguishes between the language of the website and the language of the
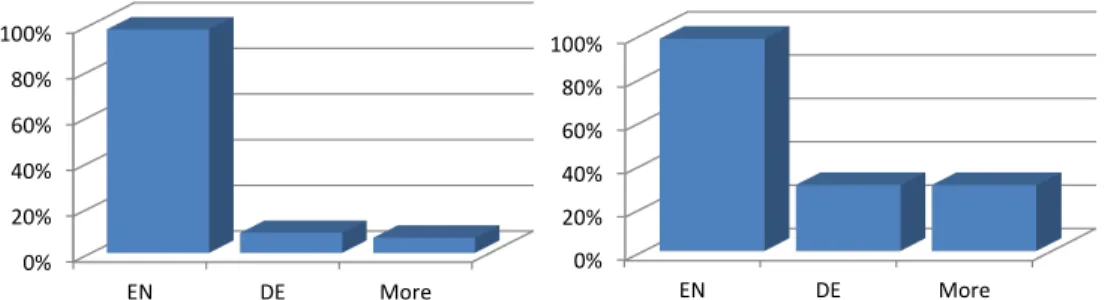
0% 20% 40% 60% 80% 100% EN DE More 0% 20% 40% 60% 80% 100% EN DE More
Figure 8: Language of websites (left) and data (right). data offered. A visual representation of the results
is shown in Figure 8. Nearly all investigated vendors (98%) run an English-language website. For the majority, English is also the only language available (89%). Only some companies run a multilingual
web-site (9% German; 7% More). These tend to be the bigger player with a global strategy, like Microsoft or LexisNexis. This picture changes when looking at the language of the data itself. We observed that again 98% offered English Language Data, but about 30% offered German data and almost 20% of the vendors also offered data in other languages.
We have seen that English is the dominant lan-guage for both websites and data. This is not sur-prising because the market for data has a global scope and English seems to be the best suited lan-guage for that. However, there is also a demand for local data in the corresponding language, which is suggested by the amount of vendors that offer such data.
3.1.9 Target Audience
The last objective dimension is concerned with the target audience. Here, we have investigated to-wards whom offerings are tailored. As is evident from Figure 9, there are only two categories in this dimension,business andcustomer. Providing data for another company in a B2B fashion is the most logical application area of data vending. Specialized vendors focus on their respective domain, e. g., Cus-tomLists.net targets business users while Wolfram Alpha is aimed more at private users. The more general vendors, especially those operating in the any domain like Kasabi or Windows Azure Mar-ketplace, target their offer at all audiences. Out of all vendors in this research, 87% offered data in a business context, 41% sold data relevant for end consumers, and 28% had data that could be of use for both groups.
0% 10% 20% 30% 40% 50% 60% 70% 80% 90% Business Customer
Figure 9: Number of vendors by Target Au-dience.
3.2 Subjective Dimensions
3.2.1 Trustworthiness
This dimension indicates how trustworthy the data of a vendor is, depending on the origin of the data as well as on how it is processed. For instance, data that come from a community could have a lower trustworthiness than data that is sourced from an authority. In other words, data from a postal operator as offered by, e. g., AddressDoctor is more likely to be correct than an aggregation of online sources. However, there are also other cases where a collective of anonymous authors produce data that is verifiably correct and therefore trustworthy, e. g., Wikipedia. Whether more trust is put in a single authority of a domain or in a crowd of people de-pends on the application context and one’s personal attitude. Nevertheless, this dimension is not quan-tifiable and, thus, the results are subjectively biased. As depicted in Figure 10, we have found that 54% of all vendors have a high trustworthiness. Among those are vendors that carefully select the data they offer in a transparent and comprehensible way. Also, authorities and governments as explained in Sec-tion 3.1.4 all exhibit a high trustworthiness. The category medium is populated by around 33% of all examined vendors. The main indicator for their
classification that they seem to be trustworthy is based on the descriptions, but this could not be ver-ified in any way, e. g., because they do not explicitly state their data sources or explain their analytical methods. The lowest degree of trustworthiness ap-plied to only 22% of all vendors. Typical vendors in this category are those that do not even claim to deliver correct or complete data, like web crawlers (e. g., 80legs) or community-supplied websites (e. g.,
Freebase). 0% 10% 20% 30% 40% 50% 60%
Low Medium High
Figure 10: Trustworthiness distribution. Note that the overlap between the three categories stems from the fact that one vendor can offer mul-tiple datasets from different sources, like Kasabi or Infochimps. In such a case, we have assigned all pos-sible levels of trustworthiness. Furthermore, while it is intuitive that high trustworthiness is good, it is not necessarily the case that a low trustworthiness is bad. There are scenarios in which incomplete data is sufficient for a rough estimation, or data with a high trustworthiness is not available (e. g., social media analysis). This leads us to the conclusion that vendors with all levels of trustworthiness are likely to co-exist in the future, because they fulfill different demands.
3.2.2 Size of Vendor
While some might argue that the size of a vendor is quantifiable (e. g., using the number of employees or its revenue), and thus, an objective dimension, it is difficult to find reliable figures that would support such an analysis. We therefore took the presentation of the offering as a foundation for a classification with the following four categories:
• Startup: Companies that are newly created and that have only a small number of people involved are usually referred to as startups; ex-amples include Uberblic or QuantBench. These are often funded by investors, as they do not yet have a positive cash flow from the very beginning.
• Medium: Leaving the beta stage, gaining expe-rience and maturity, and not being dependent on investors anymore are the key character-istics that set medium-sized companies apart from startups. Examples include eXelate or Spinn3r.
• Big: Companies that are well-established and have more than one product in their offering range are considered big, e. g., Infochimps or LexisNexis. While there is no sharp dividing line between medium-sized and big companies, we still felt that separating the two in different groups yields more accuracy for the analysis.
• Global Player: In this category fell only the biggest companies out there, like Yahoo!, Mi-crosoft, IBM, etc.
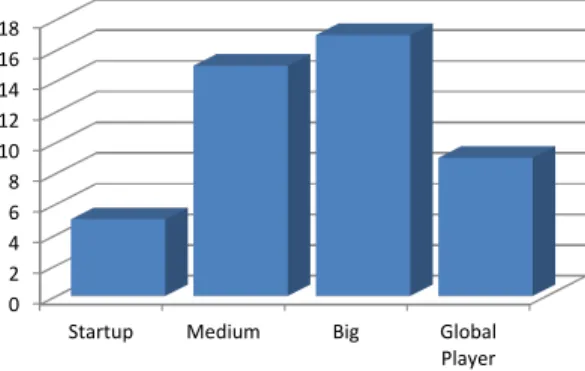
0 2 4 6 8 10 12 14 16 18
Startup Medium Big Global Player Figure 11: Number of vendors by size. Note that in this dimension, the categories are mutually exclusive. Figure 11 shows the number of vendors for each size. It can be seen that the number of startups is the lowest. This could indicate that the market for data is not easy to enter. The number of global players also seems rather low, but it has to be kept in mind that these vendors have the potential to quickly seize huge market shares, because they usually have experienced people and extensive capital. The majority of vendors is either medium-sized or big.
3.2.3 Maturity
The maturity of all offerings has been classified into the following four categories, which are mutually exclusive:
• Research Project: These offerings are usually not for profit and can therefore be used free of charge. They are mainly executed as a proof-of-concept. Examples include Goolap or IBM Cognos Many Eyes.
• Beta: A beta product is still in development and has not been fully launched yet. Neverthe-less, we have also seen offerings in beta phase that already demanded a usage-fee, like Seman-tics3.
• Medium: This category classified products that were already out of beta, but were still not as highly developed as other products, such as BuzzData or CloudMade Data Market Place.
• High: Full-fledged products that implement all intended features and are ready for use in an operational environment. For example, the Windows Azure Marketplace seems to be rela-tively advanced in this sense.
0 5 10 15 20 25 30 35 Research Project
Beta Medium High
Figure 12: Maturity of vendors. Evaluating the numbers presented in Figure 12 shows that only 3 research projects, 6 betas and 6 medium-matured offerings could be identified. The remaining 31 offerings can all be classified as having a high maturity. This observation can also serve as an explanation to the previous finding of a low number of startups. When there are already established vendors with mature projects, the space for new companies to enter the market is relatively small.
4. RELATED WORK
In [6] a general discussion of data services can be found. Starting from a general data service archi-tecture, the authors examine concepts and example products forservice-enabling data stores, integrated data services,andcloud data services. Further, they highlight technical challenges, such as transactions an updates to data structures underlying the ser-vice, as well as predict emerging trends, such as convergence and cloud integration.
Geet al. [8] studied electronic marketplaces but restricted themselves to Web sites where users can ask questions (e. g., Askjeeves.com), which are then answered by other users or experts. Furthermore, they only described five websites and focused rather
on business models than on surveying marketplace properties.
Regarding data markets as we defined them in Section 2.1 surveys have only been done on a (much) smaller scale, not disclosing any methodology, and only in textual form. For instance, Strata [7] describe characteristics of the four (according to them) most mature data markets Factual, Infochimps, DataMar-ket, and Windows Azure Data Marketplace, which we also examined in this study.
Similarly,Millerinterviewed 10 providers of data marketplaces or data related services in a series of Podcasts [10]. However, he only provides the inter-views in a rather unprocessed form, i. e., as audio files, which makes it difficult to access and aggregate the contained information. Later, he published a report [11] on data marketplaces and their business models, in which he identified common function-alities that data marketplaces offer, elaborated on potential business models and makes some rather general predictions such as increasing competition and a wider choice of data and sources.
Furthermore, there have been investigations into particular market places, for instance on Kasabi [12], which went out of business in the meantime. It was described as a ”web-based information market-place” and stored data using the Resource Descrip-tion Framework (RDF) with the goal of bridging the gap between data publishers and application developers by providing a platform that allows host-ing of and searchhost-ing for data. It was designed after the linked data paradigm originally outlined by Tim Berners-Lee. The basic idea of linked data is to publish data in a structured way that allows for linkage to data sets. An overview of this concept, the technical principles and its applications can be found in [4]. A survey about the current usage of these dataset is given by [13] and actual trends are outlined in [3].
In the course of the Linked Open Data (LOD) movement, FactForge emerged as a publicly available service that is meant to ”provide an easy point of entry for would-be consumers of Linked Data” [2]. It was built with the intention to facilitate access to the LOD cloud of data by integrating the major datasets into one view.
A different approach is pursued by the developers of Freebase. They try to create what they call a ”collaboratively created graph database for structur-ing human knowledge” [5]. The collaboration aspect is inspired by Wikipedia and based on the idea that data quality improves when lots of people refine datasets. They employ a graph database, because it depends less on a rigid schema and is more flexible.
The authors state explicitly that they want to allow conflicting and contradictory types and properties to exist simultaneously in order to ”reflect users’ differing opinions and understanding” [5].
DBPedia is a different project that shares many similarities with Freebase. They both aim at ex-tracting structured data and making it available in RDF. However, DBPedia focuses on Wikipedia as its only source, and also does not allow direct editing of data.
Microsoft’s contribution to the market is Windows Azure Marketplace [9] and has been launched in 2010. It is designed to make the sharing of data as well as applications an easy process for both consumers and providers of data. The key features are global reach through a central platform, unified billing and access mechanism, high data quality, and easy integration with other Microsoft products. Unique to Windows Azure Marketplace is the way in which datasets and applications are combined. Providers of data can go beyond selling their raw data, and bundle it with applications that are designed specifically for this dataset. Customers can purchase these bundles directly and have a working out-of-the-box solution without any additional implementation effort.
That said, there is—to our knowledge—no sur-vey that investigates data marketplaces in such a comprehensive manner as we have done.
5. CONCLUSION & FUTURE WORK
In this study we have presented an initial overview of data vendors and marketplaces for data. Utilizing an iterative approach we have derived dimensions along which data providers can be classified and grouped. We have then presented a survey drawing a preliminary picture of the current data vendor landscape. Our survey gives an overview of the cur-rent market situation and shows which categories are currently underrepresented and which ones can be particularly interesting for practitioners. However, it is too early to make reliable statements about where data marketplaces are heading. That is why we plan on repeating this survey on an annual basis to re-evaluate the individual vendors and extending the study with a development section. We believe that a comparison over time will allow for assessing which models and practices stand the test of time. Also, technical trends can then be deduced from market observations and give valuable insights to researchers.This study has focused on the provider view of data marketplaces, which have emerged because it has by now been recognized that and how data can be monetized. It will also be interesting to
observebuyers of data and analyze their perception of these new offerings, where a distinction between private and professional customers is likely to be appropriate. Here, it will over time be possible to determine who is spending money for what kind of data, and we expect that certain domains will be more attractive than others. For example, a variety of current activities in the healthcare domain (e.g., taltioni.fi, ensembl.org, patientslikeme.com, or cancerresearchuk.org) indicates a high attractiveness for data markets. This will be a subject of future research.
Acknowledgment
We like to thank the anonymous reviewers of the ACM SIGMOD Record for their helpful comments.
6. REFERENCES
[1] A.A. Armstrong and E.H. Durfee. Mixing and memory: emergent cooperation in an information marketplace. In Multi Agent Systems, 1998. Proceedings. International Conference on, pages 34 –41, jul 1998.
[2] B. Bishop, A. Kiryakov, D. Ognyanov, I. Peikov, Z. Tashev, and R. Velkov. FactForge: a fast track to the web of data.Semantic Web, 2(2):157–166, April 2011. [3] C. Bizer. The Emerging Web of Linked Data.IEEE
Intelligent Systems, 24(5):87–92, 2009.
[4] C. Bizer, T. Heath, and T. BernersLee. Linked Data -The Story So Far.International Journal on Semantic Web and Information Systems (IJSWIS), 5(3):1–2, 2009.
[5] K. Bollacker, C. Evans, P. Paritosh, T. Sturge, and J. Taylor. Freebase: a collaboratively created graph database for structuring human knowledge. InSIGMOD ’08: Proceedings of the 2008 ACM SIGMOD
international conference on Management of data, pages 1247–1250, New York, NY, USA, 2008. ACM.
[6] Michael J. Carey, Nicola Onose, and Michalis Petropoulos. Data services.Commun. ACM, 55(6):86–97, June 2012.
[7] Edd Dumbill, 2012.http://strata.oreilly.com/2012/ 03/data-markets-survey.html.
[8] W. Ge, M. Rothenberger, and E. Chen. A Model for an Electronic Information Marketplace.Australasian Journal of Information Systems, 13(1), 2005. [9] Microsoft White Paper. Windows Azure Marketplace,
2011.http://go.microsoft.com/fwlink/ ?LinkID=201129&clcid=0x409.
[10] Paul Miller, 2012.http://cloudofdata.com/category/ podcast/data-market-chat/.
[11] Paul Miller, 2012.http://pro.gigaom.com/2012/08/ data-markets-in-search-of-new-business-models/. [12] K. M¨oller and L. Dodds. The Kasabi Information
Marketplace. In21nd World Wide Web Conference, Lyon, France, 2012.
[13] K. M¨oller, M. Hausenblas, R. Cyganiak, and
S. Handschuh. Learning from Linked Open Data Usage: Patterns & Metrics. InWeb Science Conference, 2010. [14] A. Muschalle, F. Stahl, L¨oser, and G. Vossen. Pricing
Approaches for Data Markets. Into appear in 6th International Workshop on Business Intelligence for the Real Time Enterprise (BIRTE), 2012.
[15] B. Pang and L. Lee. Opinion Mining and Sentiment Analysis.Found. Trends Inf. Retr., 2(1-2):1–135, January 2008.