DOI: 10.12928/TELKOMNIKA.v15i2.6142 912
Estimation of pH and MLSS using Neural Network
Nur Sakinah Ahmad Yasmin1, Muhammad Sani Gaya2, Norhaliza Abdul Wahab*3, Yahaya Md Sam4
1,3,4
Control & Mechatronics Engineering, Faculty of Electrical Engineering, Universiti Teknologi Malaysia, 81310 Skudai, Johor Bahru, Malaysia
2
Department of Civil Engineering, Kano University of Science & Technology, Wudil *Corresponding author, e-mail corresponding author: aliza@fke.utm.my
Abstract
The main challenges to achieving a reliable model which can predict well the process are the nonlinearities associated with many biological and biochemical processes in the system. Artificial intelligent approaches revolved as better alternative in predicting the system. Typical measured variables for effluent quality of wastewater treatment plant are pH, and mixed liquor suspended solids (MLSS). This paper presents an adaptive neuro-fuzzy inference system (ANFIS) and feed-forward neural network (FFNN) modeling applied to the domestic plant of the Bunus regional sewage treatment plant. ANFIS and feed- forward neural network techniques as nonlinear function approximators have demonstrated the capability of predicting nonlinear behaviour of the system. The data for the period of two years and nine months sampled weekly (140 week samples) were collected and used for this study. Simulation studies showed that the prediction capability of the ANFIS model is somehow better than that of the FFNN model. The ANFIS model may serves as a valuable prediction tool for the plant.
Keywords: fuzzy inference system, neural network, activated sludge process, prediction
Copyright © 2017 Universitas Ahmad Dahlan. All rights reserved.
1. Introduction
Due to efficiency and cost-effectiveness, activated sludge system becomes the most widely used technology for removal of organic nutrients from wastewater. The system main concerns are reduction of the pollutants' concentrations to the level nature can handle and rejection of disturbances for smooth operation at minimal cost. To achieve these conveniently, a reliable model is essential for better removal of pollutant. Suitable model is absolutely crucial not only for control design but also for optimal and trouble-free operation of the system.
The existing mathematical models developed by the international association of the water quality (IAWQ) task group such as activated sludge model no.1 (ASM1) for organic carbon and nitrogen removal, it's updated version ASM2, which includes phosphorus removal, the ASM2d, an extension of ASM2 and ASM3 the new version of ASM1, have greatly contributed immensely in describing the complex biological activities of the microorganisms responsible for degrading the pollutants in the wastewater and interactions occurring in the system [1]. ASM1 was designed for domestic wastewater treatment describing nitrification and de-nitrification processes which involved the microorganism activities. It is important to provide favourable conditions for the microorganisms so that the wastewater can be properly treated because pollutants in high concentration can pose a threat to the receiving waters [2]. Arguably, these models are structurally complex to use, difficult to solve analytically and do not captured some essential parameters such as pH and mixed liquor suspended solids (MLSS) which are crucial in revealing the condition of an activated sludge system [3, 4]. Therefore, there is an urgent need for a straightforward and reliable model of pH and MLSS.
Surveying the literature reveals that several simplified models using different plant configurations either through simulations or practically were implemented particularly based on the concept of the reference model (ASM1). Linearize models in [5] demonstrated effectiveness in tracking the responses of ASM1 and maintaining the states biological interpretations. Analytical model performed remarkably in predicting the process and conserved the nonlinear nature of the reference model [6]. Artificial intelligent methods such as fuzzy logic, neural network and hybrid system emerged as an alternative and exhibited high level of accuracy in
predicting the process [7, 8]. However, most of these suggestions were applied either to a completely mixed tank and industrial wastewater.
Therefore, it is the objective of this paper to investigate the feasibility and effectiveness in predicting a pH and MLSS parameters in the step-feed activated sludge wastewater treatment plant. Neural network techniques were used in several real-world applications and have proven to be effective in handling of a complex noisy data, uncertainty and nonlinearity. The success of neural network is as the result of fast learning ability and adaptation. The integration of neural network and fuzzy system yielded an efficient system referred as neuro-fuzzy system. One of most commonly used neuro-neuro-fuzzy system is ANFIS. Similar to neural network, adaptability and ability to deal with uncertainty makes ANFIS gained preference. The prediction performances of the models were evaluated in terms of root mean square error (RMSE), mean absolute deviation (MAD), mean absolute percentage deviation (MAPD) and correlation coefficient (R). MAPD often referred as mean absolute percentage error (MAPE), a low value of MAPE indicate accurate prediction [9]. Using this criterion, the model that produces effective prediction regarding the considered variables could be obtained. The model obtained would serve as a foundation for implementation of the control algorithm and can result in smooth and efficient operation.
2. Research Method
2.1. Bunus Regional Sewage Treatment Plant
The Bunus regional sewage treatment plant (RSTP) is located on the North/Eastern of Kuala Lumpur, Malaysia. The plant has daily average capacity of 87,000m3/d, utilizes advance step-feed activated sludge process for biological oxygen demand (BOD), chemical oxygen demand (COD), suspended solids (SS), oil and grease (O&G) and nitrogen removal. The influent wastewater enters to the primary settler in which the wastewater is retained to allow the settle-able organics and floatable solids to settle at the bottom of the clarifier by gravity sedimentation. The effluent from the primary settler flows to the biological reactor unit consisting of two anoxic tanks and two aerobic tanks as shown in Figure 1.
Figure 1.Bunus RSTP plant layout
2.2. Data Collection
The recorded data from SCADA system of Bunus RSTP for the period of two years and nine months sampled weekly (140 week samples) were collected and used for this study. The main measured variables in the wastewater treatment plant are parameters such as BOD, COD and SS, which reveal the efficiency of the treatment plant while pH and MLSS are vital for effluent quality and dissolved oxygen (DO), MLSS, nitrate and ammonium can be used in optimizing the plant. In this study, only pH and MLSS were considered for predicting the effluent quality.
2.3. ANFIS Model Implementation
The full scale data sampled weekly of 140 samples of the Bunus RSTP were utilized to develop the models. The measured data are normalized using the expression given in equation (1), so that all the data values are between zero (0) and one (1).
min max min
i ix
X
(1) Anoxic Tank 1 Anoxic Tank 1 Anoxic Tank 1 Anoxic Tank 1 Influent wastewater Primary settler Secondary settler Effluent Primary sludge Returned sludge Aeration Unit Excess sludge Anoxic Tank 1where
X
iis the normalized data point,x
i is the data sample,
min is the minimum value among the data samples and
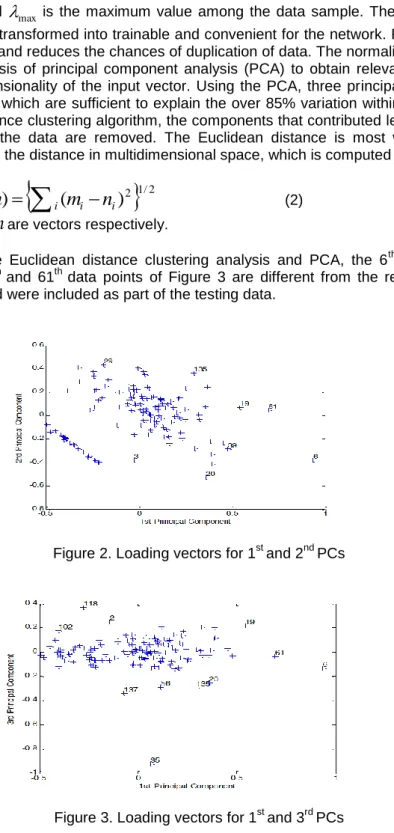
max is the maximum value among the data sample. The normalization allows the data to be transformed into trainable and convenient for the network. Furthermore, it makes training faster and reduces the chances of duplication of data. The normalized data were subdued to the analysis of principal component analysis (PCA) to obtain relevant information and reduce the dimensionality of the input vector. Using the PCA, three principal components (PCs) were extracted which are sufficient to explain the over 85% variation within the data set. Using Euclidean distance clustering algorithm, the components that contributed less 10% to the total variation within the data are removed. The Euclidean distance is most widely chosen distance and simply is the distance in multidimensional space, which is computed as:distance
(
m
,
n
)
i(
m
i
n
i)
2
1/2 (2)where
m
andn
are vectors respectively.Based on the Euclidean distance clustering analysis and PCA, the 6th data point of Figure 2 and 6th, 35thand 61th data points of Figure 3 are different from the remaining data. These are outliers and were included as part of the testing data.
Figure 2.Loading vectors for 1st and 2nd PCs
Figure 3.Loading vectors for 1st and 3rd PCs
The normalized data are divided into 126 samples for training and 14 samples for testing of the model. A large percentage of the data set should be used during the training stage since ANFIS is quite adapted nonlinear functional dependency between the influent and effluent variables [10]. This could also result in avoiding the problem of over fitting, which led to large testing error. The selection of training and testing data can be done statistically or arbitrarily as suggested in [11]. However, in this study, the selection was done arbitrarily. To determine the
structure of the fuzzy inference system (FIS), the function ‘‘genfis1’’ (fis=genfis1 (data, 2, ‘gaussmf’, ‘linear’)) was utilized to generate a first-order Sugeno FIS using grid partition on the data. The grid partition splits the data space based on the number of membership functions.
Each of the input variables was fuzzified with two Gaussian membership functions which resulted into 32 (25) fuzzy rules and each rule generates one rule output. The aggregate of the rule outputs yielded the final single output.
As the FIS structure is now made available, ANFIS utilizes the hybrid learning algorithm to tune (optimize) the premise (nonlinear) and consequent (linear) parameters of the FIS via learning from the training data set and minimizing the error in order to realize the desired ANFIS model through 100 training epoch and error tolerance of zero. The training stage stopped, and the realized ANFIS model is supplied with the testing data to evaluate its generalization capability, since the testing error is the real performance measure of the model. The prediction performance of the ANFIS model is evaluated based on the RMSE, MAD, MAPD and R.
2.4. Feed-Forward Neural Network
The same refined data used in building ANFIS models were utilized for the feed-forward neural network models. The structure of the network was selected having three layers with input layer containing the five input variables joined to hidden layer of ten neurons followed by the output layer as illustrated in Figure 4.
Figure 4.pH FFNN structure
The tan-sigmoid and purelin transfer functions were employed for the hidden and the output layer, respectively. The network is trained using back propagation algorithm for the range of 100 training epochs. The model prediction accuracy was evaluated using the performance measures. The same procedure was adapted to build the model for MLSS variable.
3. Results and Analysis
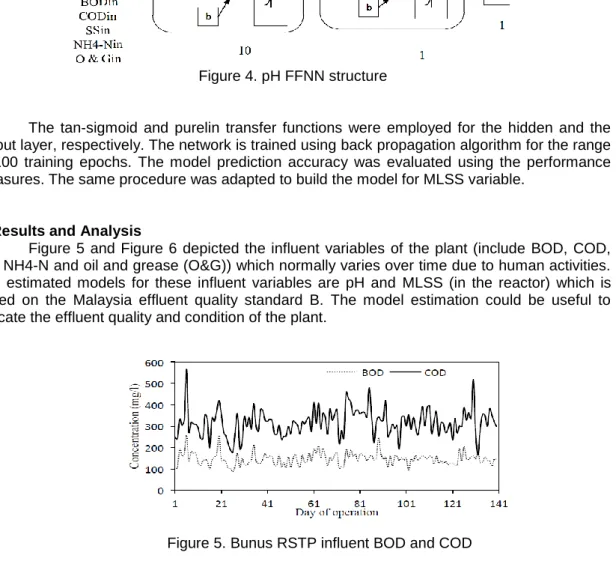
Figure 5 and Figure 6 depicted the influent variables of the plant (include BOD, COD, SS, NH4-N and oil and grease (O&G)) which normally varies over time due to human activities. The estimated models for these influent variables are pH and MLSS (in the reactor) which is based on the Malaysia effluent quality standard B. The model estimation could be useful to indicate the effluent quality and condition of the plant.
Figure 6.Bunus RSTP influent SS, NH4-N and O&G
In the training phase, the predictions of the ANFIS and FFNN models are in good agreement with the measured values of the pH as illustrated in Figure 7 and Table 1. The values of the error of the ANFIS model were very low and the correlation is quite strong, which are slightly better to what were obtained with the FFNN model. In testing phase as shown in Figure 8, the ANFIS model shows strong correlation with the measured pH as compared to that of FFNN model. Despite the prediction errors having negative values in both the ANFIS and FFNN model as can be seen from the Figure 8, accurate predictions could be achieved with both the ANFIS and FFNN model.
Figure 7.Training pattern for pH variable
Figure 8.Testing pattern for pH variable
Figure 9 illustrates the predictions of the models during training phase for the MLSS variable. The models were able to follow well the measured values of the MLSS. The correlation between the predicted values of the models and the observed values of the MLSS are strong as shown in Table 1. From the illustration depicted in Figure 10 during testing phase, the prediction
errors were having positive and negative values. The performance of ANFIS is better than FFNN as there are many drifts in FFNN model. The performances index of the ANFIS and FFNN models during training and testing were illustrated in Table 1.
Table 1.Prediction performances of the models
Variable Model Training phase Testing phase
RMSE MAD MAPD
(%)
R RMSE MAD MAPD
(%) R pH ANFIS 0.00111 0.00061 0.12 0.99998 0.15709 0.03631 7.14 0.70868 FFNN 0.05623 0.03814 7.43 0.93931 0.29243 0.07335 14.44 0.39698 MLSS ANFIS 0.00198 0.00116 0.17 0.99996 0.20737 0.05308 8.03 0.69906 FFNN 0.12440 0.06847 10.10 0.83021 0.24029 0.10539 15.93 0.50030
Figure 9.Training pattern for MLSS variable
Figure 10.Testing pattern for MLSS variable
4. Conclusion
In this paper, comparison between ANFIS and FFNN model for predicting pH and MLSS in domestic wastewater treatment plant has been presented. Although both the ANFIS and FFNN models have demonstrated a great capability of effectively predicting the variables, however, the results obtained with ANFIS approach are better compared to that of the FFNN. Perhaps providing enough training time could increase the performance of the FFNN to achieve the results as close as that of ANFIS. The proposed ANFIS model may serves as a versatile and useful prediction tool for the activated sludge wastewater treatment plant.
Acknowledgements
The authors would like to thank the Research University Grant (GUP) vote 13H70, Universiti Teknologi Malaysia for the financial support.
References
[1] Henze M, Gujer W, Mino T, van-Loosedrecht M. 2000 Activated sludge models ASM1, ASM2, ASM2d and ASM3, IWA Scientific and Technical Report No. 9, London, UK: IWA Publishing.
[2] AO Hussein, S Shahid, KN Basim, Chelliapan. Modelling of Sewage Quality during Rainy Season. Asian Jr. of Microbiol. Biotech. Env. Sc. 2015l; 17 (3): 593-601
[3] Tay J, Zhang X. A fast predicting neural fuzzy model for high-rate anaerobic wastewater treatment systems. Water Research. 2000; 34(11): 2849–2860.
[4] Goldar A, Revollar S, Lamanna R, Vega P. Neural-MPC for N- removal in activated sludge plants. 2014 European Control Conference (ECC), 2014 Strasbourg, France. 2014; 808-813.
[5] Benhalla A, Houssou M, Charif M. Linearization of the full activated sludge model No 1 for interaction analysis. Bioprocess and Biosystems Engineering. 2010; 33(6): 759–71
[6] Nagy A, Mourot G, Marx B. Systematic multimodeling methodology applied to an activated sludge reactor model. Industrial and Engineering Chemistry Resaerch. 2010;49(6): 2790–2799.
[7] Huang M, Ma Y, Wan J, Zhang H, Wang Y. Modeling a paper-making wastewater treatment process by means of an adaptive network-based fuzzy inference system and principal component analysis. Industrial and Engineering Chemistry Research. 2012; 51(17): 6166–6174.
[8] Nasr M, Moustafa M, Seif H, El-Kobrosy G. Application of fuzzy logic control for Benchmark simulation model. 1. Sustain. Environ. Res. 2014; 24: 235-243.
[9] Lewis C. Industrial and business forecasting methods: A practical guide to exponential smoothing and curve fitting. California: Butterworth-Scientific. 1982.
[10] Cakmakci M. Adaptive neuro-fuzzy modelling of anaerobic digestion of primary sedimentation sludge. Bioprocess and Biosystems Engineering. 2007; 30(5): 349–57.
[11] El-Mansi M, Bryce C. Fermentation microbiology and biotechnology 1st ed., Taylor & Francis Inc., Philadelphia, U.S.A. 1999.