RECOGNIZING CARDIOVASCULAR DISEASE PATTERNS WITH MACHINE LEARNING USING NHANES ACCELEROMETER DETERMINED PHYSICAL ACTIVITY
DATA
BY
ELENA BOIARSKAIA
DISSERTATION
Submitted in partial fulfillment of the requirements for the degree of Doctor of Philosophy in Kinesiology
in the Graduate College of the
University of Illinois at Urbana-Champaign, 2016
Urbana, Illinois
Doctoral Committee:
Professor Weimo Zhu, Chair Professor David Buchner Professor Feng Liang Professor Kenneth Wilund
ii ABSTRACT
The relationship between physical activity (PA) and cardiovascular disease (CVD) is well established; however, questions about the appropriate dose of PA to reduce CVD risk still remain (Blair, LaMonte, & Nichaman, 2004; Pate et al., 1995). The optimal dose and the effects of intensity, duration, and frequency of PA are not fully understood (Haskell et al., 2007). This study connects objectively measured PA with a cross-sectional measure of CVD risk for an in-depth analysis of PA patterns that contribute to higher risk of CVD. Specifically, this study applied machine learning algorithms to NHANES accelerometer data from the 2003-2006 cohorts with the Reynolds cardiovascular risk score as the outcome.
Using accelerometer data as a proxy for the Reynold’s risk score to study cardiovascular
disease risk allows the use of cross-sectional data when the longitudinal outcome is not known. A major benefit of using accelerometers to objectively measure of PA is that the data is easy and inexpensive to obtain. Furthermore, most locomotive activities are measured with a high degree of accuracy. Accelerometers can gather highly detailed information about an individual’s PA pattern over extended periods of time. This produces a large amount of data that requires specialized techniques to analyze. The analysis for this study was conducted using a variety of machine learning techniques to identify individual patterns in the data and evaluate what contributes most to high CVD risk.
Comparison of machine learning algorithms shows that all classifiers perform well when given appropriate features. Using predefined intensity thresholds to compute average time spent in a PA category yielded good classification results in identifying study participants at high and low risk for CVD (Troiano et al., 2008). Adding PA pattern-related features to the model did not appear to improve classification. Features derived using k-means and the Hidden Markov Model
iii (HMM) performed on the level of using predefined intensity thresholds, indicating that data driven methods may be used for feature extraction without relying on prior knowledge of the data.
In general, the lasso regression, support vector machines (SVM) and random forest (RF) classifiers all performed well on large sets of data-driven features, achieving greater than 82% classification accuracy when time spent in PA intensity categories was combined with k-means and HMM-derived inputs. Neural networks performed well on smaller uncorrelated feature sets, and decision trees produced consistent results with the most transparency and interpretability.
With respect to physical activity recommendations, the findings indicate that gender and time spent in lifestyle minutes (760-2019 intensity counts) play a key role in classifying CVD risk. Thus, a greater emphasis on gender specific recommendations focusing on lifestyle minutes in addition to moderate and vigorous activity may be necessary. Furthermore, time spent in the activity categories, not how PA is spread throughout the day and week appear to be most important for classification of CVD risk.
iv
v AKNOWLEDGEMENTS
I would like to thank my committee members: Dr. David Buchner, Dr. Feng Liang and Dr. Kenneth Wilund. Thank you for broadening my horizons, sharing your expertise, and providing guidance and advice on this project. A special thank you to my adviser, Dr. Weimo Zhu. I have learned so much from you over the years. Thank you for inspiring me to do my best work, for shaping me as a researcher, and for mentoring me as a professional in the field.
Thank you to my friends and colleagues: John Kalohn, David Scrams, Ray Yan, Farai Munyari Madison, and my editor, Elizabeth Deanna Morris Lakes. Your words of
encouragement and support helped me see this project through to the end.
My family: my parents Alla Boiarskaia and Alexandre Boiarski and my grandmother, Albina Boiarskaia. Without you, this journey would have been impossible. Thank you for your enthusiasm and support. Finally, I am deeply grateful to my husband, Bradley Paul Uban. Thank you for your patience and for always being there for me.
vi TABLE OF CONTENTS
CHAPTER 1 INTRODUCTION ... 1
CHAPTER 2 LITERATURE REVIEW ... 9
CHAPTER 3 METHODS ... 48
CHAPTER 4 RESULTS ... 56
CHAPTER 5 DISCUSSION ... 93
REFERENCES ... 106
APPENDIX A: PRINCIPAL COMPONENT LOADINGS ... 122
APPENDIX B: CLASSIFICATION RESULTS ... 127
1 CHAPTER 1 INTRODUCTION
The connection between physical activity (PA) and health outcomes is a central theme in kinesiology and public health research. This relationship is well documented with studies
showing that physical inactivity leads to increased risk of all-cause mortality, is associated with coronary heart disease, osteoporosis, diabetes and some cancers (Pate et al., 1995; NIH
Consensus Development Panel on Physical Activity and Cardiovascular Health., 1996). PA offers a wide range of health benefits that include weight control, longevity, reduced risk of various diseases, and improved mental health (Hebebrand & Hinney, 2015). Furthermore, PA has been shown to improve cardiovascular function and reduce the risk of cardiovascular disease, the number one killer of Americans (Go et al., 2014). Given the numerous preventive benefits of engaging in PA, physicians are recommending PA to their patients (Blair et al., 2004).
However, in order to recommend PA as a way of improving cardiovascular health and preventing risk of chronic diseases, appropriate dosage for different populations must be
established. Currently, to enjoy the benefits of PA, the US Federal Physical Activity Guidelines recommend at least 150 minutes of moderate intensity or 75 minutes of vigorous intensity PA, along with biweekly strength training for adults (United States Department of Health and Human Services., 2008). Nevertheless, unanswered questions remain about the appropriate length of continuous PA bouts, optimal intensity, and the effects of light PA (Haskell et al., 2007). The dose-response relationship between PA and various health outcomes is less understood and requires further investigation (Kesaniemi et al., 2001).
Measuring Cardiovascular Health Status
A particular interest in studying the benefits of PA is disease prevention. Examining the impact of PA on cardiovascular health status as an outcome is a challenge since there is no single
2 criterion measure of cardiovascular health. Longitudinal studies using mortality rates due to cardiovascular disease as outcomes have established a number of modifiable and non-modifiable risk factors that may lead to cardiovascular disease (Blair et al., 1989; Pate et al., 1995). While age, gender, and family history cannot be changed, regular exercise has been shown to have the potential to reduce a number of modifiable risk factors that include high blood pressure, poor glucose tolerance, high cholesterol, and obesity (D’Agostino et al., 2008).
Therefore, cross-sectional and intervention studies measuring cardiovascular health status as an outcome may focus on specific risk factors such as blood pressure and cholesterol levels. However, to study a more general representation of cardiovascular health status, it may be of interest to account for several known risk factors simultaneously by using a composite risk score. Several cardiovascular risk scores have been developed beginning with the Framingham Heart Study 10 year cardiovascular risk score (D’Agostino et al., 2008). These risk scores aim to represent the percent risk that an individual will have a cardiovascular event in the next 10 years and offer a possible solution for representing cardiovascular health status in cross-sectional data and intervention studies.
Measuring Physical Activity
Accurate and objective measures of PA are also imperative for establishing
recommendations for cardiovascular health improvement (Strath et al., 2013). However, these measures may be difficult to obtain. PA takes on various forms and can include exercise with the intention of improving fitness, playing sports, engaging in leisure activity, and performing household chores. The choice of PA varies greatly amongst individuals and may be difficult to monitor. Multiple methods including questionnaires and direct observation exist to estimate PA;
3 however there is a tradeoff between accuracy and cost effectiveness (Ainsworth & Coleman, 2006).
Recent technological advances may offer a solution to some of these challenges.
Electronic devices such as accelerometers, heart rate monitors, and GPS trackers provide insight into when and at what intensity, frequency, and duration the activity was performed at every preset interval. These devices provide a very large amount of detailed data with frequent
readings for each individual. Furthermore, accelerometers, heart rate monitors, and GPS trackers have become fairly inexpensive and readily available, making these useful for a wide range of studies (Chen, Janz, Zhu, & Brychta, 2012).
For example, accelerometers have become increasingly popular in PA and health research (Troiano, 2006) . Studies have used accelerometers to establish the connection between PA and breast cancer, cardiometabolic syndrome, kidney disease, insomnia, and depression (Chasens & Yang, 2012; Hawkins et al., 2011; Healy, Matthews, Dunstan, Winkler, & Owen, 2011; Lynch et al., 2011; Vallance et al., 2011). These findings indicate that the use of these electronic devices is appropriate in a variety of settings, offering objective and fairly accurate ways of assessing PA with possible insights into optimal dosage on an individual basis.
At the same time, data collection using electronic devices creates a new set of problems. While a large volume of detailed data is inexpensive and relatively easy to obtain, special analytic techniques are required to derive useful information from the data while retaining its richness. Each individual has a pattern to his or her daily PA based on daily habits, occupation, and health status. Identifying the complex individual’s PA patterns derived by electronic devices in conjunction with health outcomes may be very helpful for establishing PA guidelines and
4 recognizing at risk populations. This type of research requires a way of accurately classifying health outcomes based on the individual’s PA patterns.
Machine Learning
Machine learning techniques are useful for analyzing large volumes of data, recognizing patterns, and classifying outcomes with existing applications in a broad range of topics. Machine learning is a subset of artificial intelligence that utilizes a collection of algorithms that help computers learn from the data, predicting a set of outcomes or recognizing patterns, where the prediction gets better with experience. These techniques allow for individualized analysis, and while it takes more time, it also yields more accurate results. Furthermore, advances in
computational technology help make this process fast.
Applications of machine learning algorithms include speech and handwriting recognition, DNA sequencing, stock market analysis and robotics (Hastie, Tibshirani, & Friedman, 2009). Machine learning and data mining techniques have been used in various disciplines to find patterns in accelerometer data but have yet to be used to their full potential in the field of PA and health research. So far, the main objective of accelerometer data analyzed using machine learning has been to recognize the individual’s mode of PA (Ermes, Pärkka, Mantyjarvi, & Korhonen, 2008; Freedson, Lyden, Kozey-Keadle, & Staudenmayer, 2011; Mannini & Sabatini, 2010). These studies are typically conducted in a controlled environment, such as a laboratory, where the study participants are asked to perform a choreographed routine while wearing an accelerometer. Prediction of PA type is used to estimate energy expenditure. The goal is to accurately predict energy expenditure from accelerometer data for applications in heath related research or in engineering to provide feedback to users tracking their PA using electronic devices (Bouten, Koekkoek, Verduin, Kodde, & Janssen, 1997; Long, Yin, & Aarts,
5 2009; Rothney, Neumann, Béziat, & Chen, 2007; Rothney, Schaefer, Neumann, Choi, & Chen, 2008). Few studies have attempted to classify health outcomes directly from accelerometer data. NHANES Accelerometer Data
Health monitoring and research into chronic disease prevention that will further inform public health policy, prevention strategies, and medical treatment options is of national
importance according to the Center of Disease Control’s (CDC) mission. The National Health and Nutrition Examination Survey (NHANES) collected for the years 2003–2004 and 2005– 2006 by the CDC offers objective measures of PA of a representative sample of the U.S. population using ActiGraph accelerometers. Step counts are available for each minute of the week the participants wore the PA monitors. The NHANES data also provides an extensive number of health related outcome variables and is ideal for establishing a connection between health status and objectively measured PA.
The accelerometers used in the NHANES are an example of how electronic devices are able to provide highly detailed data for each individual and thus have tremendous potential in numerous research settings. Though the NHANES data has many advantages, the large volume of readings provided by the accelerometers and individual variation of the participants is also problematic as discussed above. So far, studies using the NHANES accelerometer data have shown connections between objectively derived PA and various health outcomes measured by the NHANES (Healy et al., 2011; Luke, Dugas, Durazo-Arvizu, Cao, & Cooper, 2011). However, these studies compress the detailed accelerometer data into a few data points using standardized thresholds (Atienza et al., 2011; Camhi, Sisson, Johnson, Katzmarzyk, & Tudor-Locke, 2011b; Evenson & Wen, 2011). Machine learning techniques have yet to be used to classify individual health status via PA patterns in this data.
6 Statement of Problem
Electronic devices such as accelerometers provide large volumes of readings that offer rich information about PA patterns. However, this data requires special pattern recognition, data reduction and classification techniques to arrive at meaningful conclusions about the relationship between PA and health outcomes and consequently provide PA recommendations.
Solutions
Utilize machine learning algorithms to analyze PA data collected using electronic devices. These techniques may prove to be useful not only for categorizing the type of PA but also for classifying health outcomes based on PA patterns.
Purpose
This study is dedicated to selecting features and applying machine learning algorithms to find associations and patterns in accelerometer-derived free-living daily PA that can help predict the participant’s cardiovascular health status based on cardiovascular risk scores using several
machine learning techniques using the 2003–2004 and 2005–2006 NHANES data. More specifically, this study will attempt to:
connect intensity readings from accelerometer data recoded over the course of a week to a cardiovascular risk score;
extract, compare and select appropriate features from accelerometer data to use with machine learning algorithms;
predict cardiovascular health status of an individual based on accelerometer-derived PA using machine learning approaches;
compare machine learning algorithms for classification of accelerometer-derived PA by cardiovascular health status.
7 Significance of Study
So far, machine learning techniques have been applied to accelerometer-derived PA data that were collected in controlled, clinical conditions with a main focus on classifying activity type, not predicting health status. The NHANES data offers accelerometer-derived, free-living PA collected over the course of one week. Previous analysis of this data was either descriptive in nature or established connections between various health markers and objectively measured PA by condensing a week’s worth of step counts recorded every minute into a single data point.
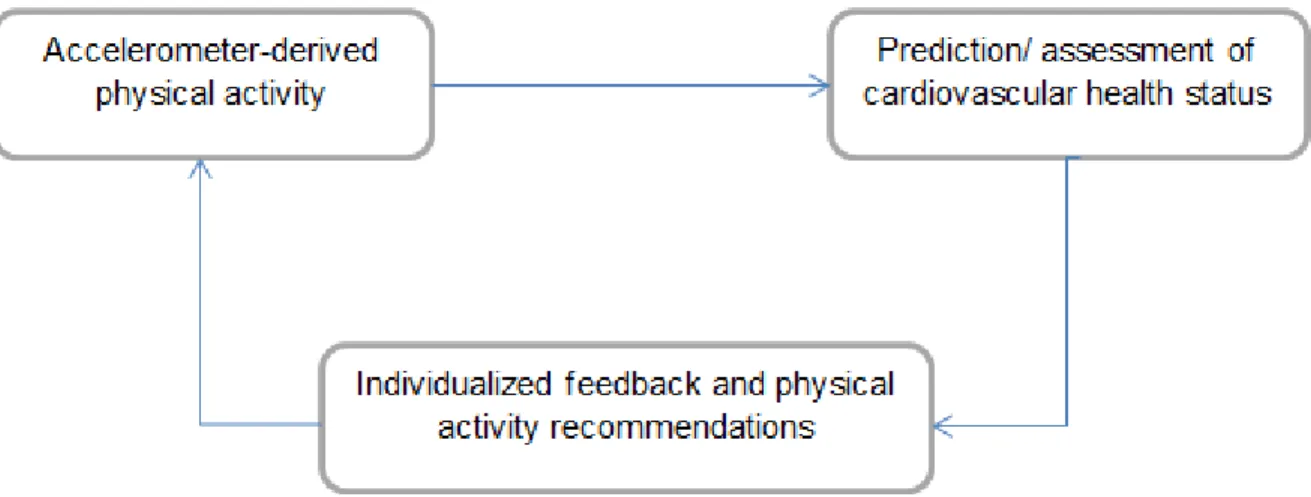
The analysis of the rich information offered by the NAHNES PA monitor data has tremendous potential in providing valuable feedback on an individual basis. As Figure 1 shows, machine learning algorithms could help classify cardiovascular health status based on
accelerometer-derived PA. Subsequently, these findings will help develop individualized interventions and prevention programs. Additionally, these methods may be successful in detecting unknown and future health problems, allowing the development of PA
recommendations based on health status. Furthermore, the NHANES 2011–2012 study will have PA data using waterproof accelerometers for seven consecutive days without breaks for
swimming, bathing or sleeping. Innovative methods to analyze this data are needed and will be proposed in this study.
8
Figure 1. The potential of using objectively measured PA for prediction of cardiovascular health status, which will in turn lead to individualized recommendation for PA.
9 CHAPTER 2 LITERATURE REVIEW
This chapter reviews potential measures of PA and cardiovascular health status, and how accelerometer data has been used to further research in PA and health. The challenges and possible solutions associated with analyzing large volumes of accelerometer data are discussed. Specifically, studies utilizing the NHANES accelerometer data are examined in detail, and machine learning techniques for recognizing PA patterns are introduced.
Prevalence of Cardiovascular Disease
Although death rates due to heart disease have declined from 2000 to 2010 by 31%, cardiovascular disease is still the leading cause of death in the U.S., killing nearly one in three Americans (Go et al., 2014). Increased public awareness, better preventive measures, improved treatment options, and quicker response times have all contributed to the decrease in
cardiovascular disease death rate; however, known risk factors remain poorly controlled. Although fewer American adults smoke, few adults meet the recommendations for body composition, PA, cholesterol, and glucose levels (Go et al., 2014). At the same time, the
financial burden of cardiovascular disease is extremely high, estimated to be $445 billion in 2010 in the U.S. (Heidenreich et al., 2011).
Forms of Cardiovascular Disease
Cardiovascular disease refers to any disease that affects the cardiovascular system. Although heart disease manifests itself in many forms, coronary heart disease kills the greatest number of Americans by far, causing 1 in 6 deaths (Go et al., 2014). The next leading killer is stroke, causing 1 in 19 deaths in the U.S., though death from stroke decreased by 35.8% from 2000 to 2010 (Go et al., 2014). Hypertension affects 29.6% of Americans, while 48.0% are successfully controlling the disease (Gillespie & Hurvitz, 2013). Other types of heart disease
10 affecting the U.S. population are heart failure, arterial disease, and congenital heart disease (Kenney, Wilmore, & Costill, 2012). The prevalent types of heart disease with controllable risk factors are discussed below.
Coronary heart disease. As described by Kenney et al. (2012), coronary heart disease is
characterized by narrowing of the arteries, a process known as atherosclerosis. Damage to the innermost lining of the arterial wall leads to an inflammatory response, with platelets, smooth muscle cells and connective tissue attaching to the affected site and beginning the formation of plaque. Low-density lipoprotein (LDL) cholesterol attaches itself to the area, contributing to the size of the plaque. Overtime, the plaque grows and leads to restricted blood flow, or ischemia, to the heart. The plaque may become unstable and rupture, forming a blood clot or thrombus and eventually blocking the artery. Myocardial infarction, or a heart attack, occurs when the heart muscle is deprived of oxygen due to the impeded blood flow (p. 524).
Stroke. Kenney et al. (2012) characterize stroke is the disease of the cerebral arteries.
Ischemic stroke occurs when blood flow to the brain is restricted. This type of stroke may be the result of thrombosis, where an artery in the brain is obstructed due to atherosclerosis, or an embolism, where a thrombus or fat globule have become dislodged and traveled to a cerebral artery, causing blockage. Stroke may also result from a hemorrhage in the brain due to a ruptured artery. An artery may rupture due to atherosclerotic damage to its walls. Both types of stroke lead to brain tissue damage (p. 525).
Hypertension. As explained by Kenney et al. (2012), blood pressure is the pressure
exerted on the arterial walls by the circulation of blood. High blood pressure, or hypertension, means the blood is circulating with greater pressure on the arterial walls that what is considered normal for the individual’s size and age. Hypertension signals that the heart has to pump harder
11 to circulate the same amount of blood due to the increased resistance in the arteries. Overtime, the heart muscle becomes strained and enlarged, and the arteries become less elastic and
damaged. This mechanism eventually leads to atherosclerosis and other cardiovascular diseases (p.525).
Heart failure. According to Kenney et al. (2012), when the heart muscle is too weak to
adequately circulate the blood due to hypertension and atherosclerosis, the condition is referred to as heart failure. The disease is characterized by reduced force of contraction, an enlarged heart muscle, and increased heart rate. Heart failure results in poor circulation and fluid accumulation, or edema. When the lungs are affected, heart failure causes shortness of breath and exercise intolerance (p.526).
Risk Factors of Cardiovascular Disease
Although cardiovascular disease usually presents itself in late adulthood, changes that signal the beginning of atherosclerosis have been shown to occur in the early stages of life with some infants exhibiting early formation of plaque in the aorta (Kannel & Dawber, 1972). Of the 300 autopsied American soldiers with average age of 22.1 killed in the Korean war, 77.3% exhibited some signs of atherosclerosis in the aorta (Enos, Holmes, & Beyer, 1953). The progress of the decease is determined by genetics, lifestyle, and environmental factors and is largely asymptomatic until later in life. While some factors like genetics, age, and gender could not be changed, risk of developing heart disease may be significantly reduced by modifying lifestyle factors (Go et al., 2014).
Obesity and overweight.Obesity and overweight describe the degree of excess
accumulation of body fat that poses a risk to one’s health. Due to the relative difficulty and cost of measuring body fat directly, to classify individuals as overweight or obese on a population
12 level, the body mass index (BMI), popularized by Ancel Keys in 1972, is used. BMI is an index of the relationship between the weight and height of an individual, calculated by dividing the weight in kilograms by the height in meters squared (Keys, Fidanza, Karvonen, Kimura, & Taylor, 1972). Overweight is defined by a BMI greater than 25 but less than 30, and obesity is defined by a BMI of 30 and greater (Hebebrand & Hinney, 2015).
Obesity affects more than a third of the U.S. population with levels rising from 30.3% in 2000 to 35.9% in 2010 according to the CDC (Ogden, Lamb, Carroll, & Flegal, 2010). The adverse health effects associated with excess weight are well documented and mortality rates increase exponentially with increases in BMI (Bray, 1985). It has been shown that excess body fat leads to impaired bodily functions and has been linked to various forms of cardiovascular disease, diabetes, cancer, and respiratory problems. Specifically, obesity leads to decreased oxygenation of the blood, causing hypertension, enlargement of the heart and thrombosis
(Kenney et al., 2012). To lower the risk of cardiovascular disease it is recommended that BMI be kept between 18 and 25 through weight control (Hebebrand & Hinney, 2015).
Inflammation. Inflammation is a natural immune response of the body to injury.
Characterized by increase blood flow that causes redness, heat, swelling and pain at the site of the injury, inflammation prevents the spread of infection, removes damaged tissue, and assists healing (Kenney et al., 2012). Infections or tissue injuries such as a cut on the hand or a sprained ankle are all types of acute inflammation that is elicited by an external stimulus and is necessary to promote the healing process. However, inflammation may also be chronic in response to stress, smoking, poor diet, and environmental factors. Chronic inflammation contributes to heart disease by hardening the arterial wall and increasing its permeability, leading to the formation of plaque (Danesh, 2000; Kaptoge et al., 2010; Medzhitov, 2008).
13 C-reactive protein (CRP) is released by the liver in response to inflammation and is considered to be a relatively new indicator of cardiovascular disease risk (Danesh et al., 2007). CRP levels are measured by a blood test where < 1.0 mg/L is considered normal. CRP levels between 1.0 and 3.0 mg/L are indicators of chronic inflammation, while 3.0 mg/L and greater indicates a high risk of heart attack (Go et al., 2014; G. L. Myers et al., 2004).
Abnormal lipoprotein levels. As described by Kenney et al. (2012), cholesterol is a type
of lipid molecule, a sterol that carries out a number of vital functions in the body. Cholesterol is produced by the liver but may also be obtained from foods from animal sources. Cholesterol is essential for building cell membranes and determining cell membrane permeability. Furthermore, it helps in the production of various hormones including sex hormones and those released by the adrenal gland. Additionally, cholesterol is used for the producing bile, insulating nerve fibers, converting sunlight exposure to vitamin D, and metabolizing fat soluble vitamins (p. 530).
While cholesterol is essential for numerous mechanisms in the body, it also plays a role in atherogenesis, or plaque formation (D’Agostino et al., 2008; National Cholesterol Education Program (NCEP) Expert Panel, 2002). Because cholesterol is a fat-like substance, it is
transported through the water-based bloodstream by lipoproteins. While low-density lipoproteins (LDL) help transport cholesterol molecules to the cells, high-density lipoproteins (HDL)
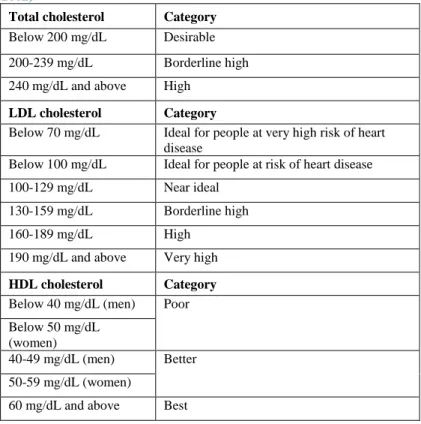
transport cholesterol back to the liver. When the blood vessels are inflamed, LDL containing cholesterol molecules may permeate and get deposited in the arterial wall thus contributing to plaque formation and further inflammation (Kenney et al., 2012). The optimal ranges for total cholesterol, LDL, and HDL are described in Table 1below.
14
Table 1. Optimal levels of cholesterol from ATP III (National Cholesterol Education Program (NCEP) Expert Panel, 2002)
Total cholesterol Category
Below 200 mg/dL Desirable
200-239 mg/dL Borderline high
240 mg/dL and above High
LDL cholesterol Category
Below 70 mg/dL Ideal for people at very high risk of heart disease
Below 100 mg/dL Ideal for people at risk of heart disease
100-129 mg/dL Near ideal
130-159 mg/dL Borderline high
160-189 mg/dL High
190 mg/dL and above Very high
HDL cholesterol Category
Below 40 mg/dL (men) Poor Below 50 mg/dL
(women)
40-49 mg/dL (men) Better 50-59 mg/dL (women)
60 mg/dL and above Best
Hypertension. Hypertension is a form of cardiovascular disease when the arterial blood
pressure is chronically high, placing additional stress on the arterial walls and the heart (Kenney et al., 2012). Therefore, not only is high blood pressure a form of cardiovascular disease, but it is also an important risk factor for coronary heart disease, stroke, and heart failure.
According to Kenney et al. (2012), blood pressure is characterized by systolic and diastolic blood pressure. Systolic blood pressure refers to the maximum force that occurs when blood is driven out of the heart due to the contraction of the left ventricle. Diastolic blood
pressure occurs when the heart is filling with blood, and the ventricle is relaxing. Although blood pressure depends on body size, for the average adult, the normal ranges of systolic blood
pressure are shown in Table 2 below. Individuals with blood pressure above these ranges are considered at risk and treatments for lowering and controlling blood pressure are recommended (p. 525).
15
Table 2. Optimal blood pressure levels (Chobanian et al., 2003)
Blood Pressure Category Systolic mmHg Diastolic mmHg
Normal less than 120 and less than 80
Prehypertension 120 – 139 or 80 – 89
High Blood Pressure Stage 1 140 – 159 or 90 – 99
High Blood Pressure Stage 2 160 or higher or 100 or higher
Hypertensive Crisis higher than 180 or higher than 110
Diabetes and insulin resistance. Diabetes mellitus (DM) is a health condition
characterized by elevated blood sugar due to either a lack of insulin production (Type I DM) or insulin resistance (Type II DM). Insulin is a hormone released by the pancreas that helps regulate carbohydrate metabolism. While a disease in itself, Type II diabetes is a major cardiovascular disease risk and is also strongly associated with obesity (Bray, 1985). High levels of sugar or glucose in the blood lead to damage of the arterial walls contributing to atherogenesis (Kenney et al., 2012).
Blood glucose and glycated hemoglobin (HbA1c) levelsare used to diagnose diabetes. The glucose tolerance test measures the baseline blood sugar level after an overnight fast, and the blood sugar level 2 hours after drinking a glucose solution. Glycated hemoglobin (HbA1c) measures the plasma glucose levels over the past three months (the half-life of red blood cells) (Q. Yang et al., 2012). The optimal ranges of these indicators of diabetes are presented in the Table 3 below.
Table 3. Optimal Blood glucose and glycated hemoglobin (HbA1c) levels (American Diabetes Association, 2010)
Condition 2 hour glucose Fasting glucose HbA1c
Unit mmol/l(mg/dl) mmol/l(mg/dl) mmol/mol DCCT %
Normal <7.8 (<140) <6.1 (<110) <42 <6.0
Impaired fasting glycaemia <7.8 (<140) ≥6.1 (≥110) &
<7.0 (<126) 42-46 6.0–6.4 Impaired glucose tolerance ≥7.8 (≥140) <7.0 (<126) 42-46 6.0–6.4
Diabetes mellitus ≥11.1 (≥200) ≥7.0 (≥126) ≥48 ≥6.5
Smoking. Smoking has been shown to increase the risk of heart disease nearly twofold
16 body, contributing to the calcification of the arterial walls and atherosclerosis (Ambrose & Barua, 2004). While smoking history may be assessed via a questionnaire, recent exposure to nicotine may be measured by blood cotinine levels (Caraballo, R. S., Giovino, G. A., Pechacek, T. F., & Mowery, 2001). Cotinine is a byproduct of metabolizing nicotine and may be detected days after nicotine exposure. Thus, even exposure to second hand smoke may be detected by a cotinine test. Levels of ≥ 10 ng/mL are indicative of some smoking or exposure, while active smokers will have cotinine levels of 100 ng/mL or greater (Wall & Johnson, 1988).
Non-modifiable risk factors. Certain indicators of cardiovascular disease risk cannot be
changed. Age and gender are strongly associated with cardiovascular disease risk where the majority of heart disease related deaths occur in people over 65 and males are at a higher risk of a cardiovascular event (Wilson et al., 1998). Having a close relative who had cardiovascular disease before the age of 60 increases one’s risk of heart disease as well (D’Agostino et al.,
2008). Race has also been shown to be a factor in cardiovascular disease risk with African Americans at a higher risk than white Americans (Hozawa, Folsom, Sharrett, & Chambless, 2007).
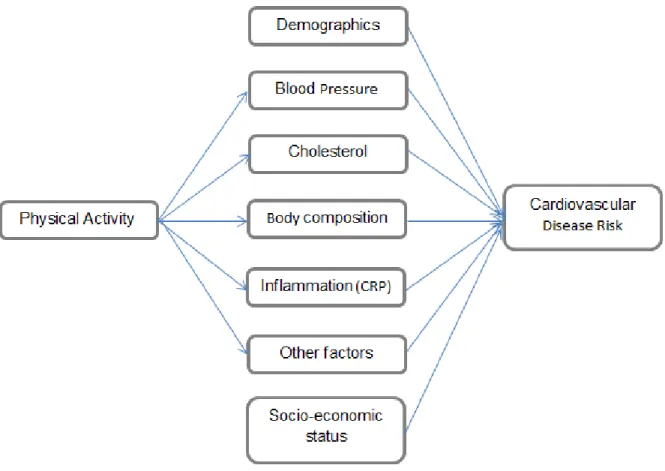
Thus, recommendations for cardiovascular disease prevention focus on modifiable risk factors that may be influenced by drugs, diet, and exercise (Lloyd-Jones, Hong, et al., 2010). Figure 2 shows the factors that influence cardiovascular disease risk and which of these may be modified by PA.
Reducing Cardiovascular Disease Risk with Physical Activity
Research shows that PA effects cardiovascular health through a variety of pathways. Numerous studies have demonstrated that engaging in regular exercise has to the potential to reduce cholesterol and inflammation, lower blood pressure, improve glucose tolerance, and
17 change body composition by increasing bone density and muscle mass while reducing body fat. These benefits, in turn, contribute to the reduction of cardiovascular disease risk (Lloyd-Jones, Adams, et al., 2010).
Epidemiological evidence. Following World War II, the development of penicillin as a
mass-produced drug contributed to a reduction in the prevalence of infectious diseases in the U.S. and Europe. Non-communicable, chronic diseases, specifically cardiovascular disease, emerged as the leading cause of death (Mahmood, Levy, Vasan, & Wang, 2014). Several landmark epidemiological studies around this time led to the identification of risk factors of cardiovascular disease, establishing a connection between PA and various health outcomes.
To promote better understanding and prevention of heart disease, President Harry Truman signed the National Heart Act of 1948, thus establishing the National Heart Institute, now known as the National Heart, Lung, and Blood Institute. The Framingham heart study was initiated in 1948 by the Institute as an ongoing longitudinal study of risk factors of
cardiovascular disease (Chapman, 1958). This landmark study initially recruited 5,209 participants from Framingham, MA aged 30 to 62 with a follow up every two years. In 1971, children of the original participants and spouses were recruited by the study. The third generation consisting of grandchildren of the original participants was recruited in 2002. To reflect a more diverse population, an Omni cohort was recruited in 1994, and a second cohort in 2003
(Mahmood et al., 2014).
After six years of follow up, an inverse relationship between levels of PA and cardiovascular disease mortality was noted (Kannel, Dawber, Kagan, Revotskie, & Stokes, 1961). Since PA data in the study was collected by a 24-hour history and the study population was generally sedentary, effects of PA were difficult to establish (Kannel & Sorlie, 1979). The
18 investigators noted that after 24 years of follow up, the participants increased their PA levels and a stronger relationship between PA and reduced cardiovascular disease risk was observed
(Kannel et al., 1986).
Research into heart disease in Europe was initiated by Jeremy Morris who conducted one of the first large scale epidemiological studies linking PA and cardiovascular health
(Paffenbarger, Blair, & Lee, 2001). Morris led the London Transport workers study comparing the incidence of cardiovascular disease in 31,000 men employed by the London Transport Executive from 1949 to 1952. The study found that a higher proportion of drivers experienced coronary heart disease than conductors. The investigators attributed this difference to the amount of PA (total energy expenditure) performed by the two jobs, with conductors being more active than the sedentary drivers (Morris, Heady, Raffle, Roberts, & Parks, 1953).
To further study the effects of PA on cardiovascular disease, Morris et al. controlled for PA demands in a professional setting by studying British civil servants with sedentary office jobs only. The study compared reported weekend leisure time activity in 16,882 male participants between the ages of 40 and 64. The study revealed that the intensity of the PA, not the total energy expenditure had the strongest effect on cardiovascular disease (Chave, Morris, Moss, & Semmence, 1978; Morris et al., 1973).
Numerous large-scale longitudinal studies followed, confirming the positive health benefits of PA. The Harvard Alumni study that was started in 1962 focused specifically on the effects of PA on cardiovascular disease risk. The data was collected via a simple questionnaire from 16,936 male Harvard graduates, and the researchers found that PA lowered the risk of heart disease even when controlling for the effects of age, BMI, family history and smoking
19 longitudinal study, the Nurses’ Health Study, started in 1976, recruited 121,700 female nurses
with the aim of identifying chronic disease risk factors specific to women (Belanger, Hennekens, Rosner, & Speizer, 1978). The study found that PA not only reduces risk of coronary heart disease and stroke but also various types of cancer (Colditz, Manson, & Hankinson, 1997; Holmes, Chen, Feskanich, Kroenke, & Colditz, 2005).
The Cooper Center Longitudinal study is an ongoing and comprehensive assessment of the effects of PA on various health outcomes. Founded in 1970 by Kenneth Cooper, the “father of aerobics” and a strong believer in the importance of physical fitness, the study recruited 10,224 male and 3,120 female participants with an average eight-year follow up (Blair et al., 1989). Similar to the Harvard study and the Nurses’ Health Study findings, the researchers found that participants with higher baseline PA levels had lower all-cause mortality, cardiovascular disease and cancer rates even after adjusting for age, smoking status and various heart disease risk factors (Blair et al., 1989).
Exercise training adaptations. While epidemiological studies suggest a relationship
between PA and cardiovascular disease risk, intervention studies shed light on the pathways through which PA affects cardiovascular fitness. Studies have shown that a dose-response relationship exists between PA and cardiovascular fitness in children, adults, and the elderly (Haskell et al., 2007; Lloyd-Jones, Hong, et al., 2010). Furthermore, evidence suggests that PA offers benefits to fit and unfit populations and has potential of reversing the effects of aging on the cardiovascular system (Blair et al., 1995). It appears that beginning an exercise program has potential of reducing cardiovascular disease risk even in high-risk populations (Chamnan, Simmons, Sharp, Griffin, & Wareham, 2009; Chobanian et al., 2003; Hawkins et al., 2011; Holmes et al., 2005; Smith, Nolan, Robison, Hudson, & Ness, 2011).
20 Engaging in PA has been shown to lead to various cardiovascular adaptations such as increased maximal oxygen uptake, maximal cardiac output and stroke volume and a decreased heart rate (Blomqvist & Saltin, 1983). While improving indicators of cardiorespiratory fitness, PA has also been shown to directly improve specific risk factors of cardiovascular disease. Regular PA has been shown to reduce cholesterol, cRP levels, risk of type II diabetes, and obesity (Dunn et al., 1999).
The numerous benefits of PA have been noted in various training protocols. While steady endurance aerobic activity has often been recommended for optimal health, in recent years, high intensity interval training has been shown to produce similar cardiovascular adaptations and health benefits (NIH Consensus Development Panel on Physical Activity and Cardiovascular Health., 1996). Engaging in short bursts of vigorous PA has been shown to improve
cardiorespiratory fitness measured by VO2max as much as regular endurance aerobic activity (Tabata et al., 1996). Furthermore, high intensity interval training has been shown to improve cardiovascular disease risk factors to a greater degree than moderate intensity steady state exercise (Wisløff et al., 2007). These findings are in line with the British Civil Servant Study conclusion that the intensity of leisure time PA, not total energy expenditure contributes to a greater reduction in mortality risk (Morris et al., 1973).
Physical activity recommendations. It has been well established that PA carries positive
health benefits (Blair et al., 1989), while physical inactivity may lead to numerous health
problems that include diabetes and cardiovascular disease (D’Agostino et al., 2008; Healy et al., 2011). Medical professionals are beginning to recognize the importance of recommending PA for overall health improvement and prevention of chronic disease to patients (Blair et al., 2004). Consequently, a main focus of kinesiology and public health research includes establishing a
21 dose-response relationship between PA and various health outcomes to eventually establish PA recommendations for different populations and health conditions.
Although numerous studies successfully showed positive health effects of PA in various populations, questions in PA and health-related research remain. Establishing recommendations for health improvement and disease risk reduction via PA is a challenge. The current guidelines are based on existing findings from longitudinal data and intervention studies establishing a dose-response relationship between PA and health outcomes. However, the optimal dose and the effects of intensity, duration, and frequency of PA remain unclear (Haskell et al., 2007).
Attempts to establish a set of recommendations for PA were initiated by the American College of Sports Medicine (ACSM) in 1978. Three to five days a week of aerobic exercise at 15–60 minutes per session and an intensity between 50% and 85% of the maximum heart rate were advised. The guidelines were geared toward improving and maintaining cardiorespiratory fitness and were therefore perceived as highly structured. Revised versions of the guidelines were released in 1990 and again in 1998 to emphasize health rather than performance-oriented fitness. The 1998 guidelines were less rigid, suggesting at least 20 minutes of aerobic activity three to five times a week (Blair et al., 2004).
The shift toward prescribing exercise as a way to improve health related outcomes led to more simplified guidelines. The CDC and ACSM released a joint recommendation for the general public to accumulate at least 30 minutes of moderate-intensity PA on most days of the week (Pate et al., 1995). This suggestion was based on epidemiologic studies showing an inverse dose-response relationship between PA and disease risk. To make the guidelines accessible to the general population, the researchers focused on the minimum amount of activity necessary to achieve the greatest health benefit (Blair et al., 2004).
22 Next, a set of PA guidelines were issued by the U.S. Department of Health and Human Services in 2008. These guidelines target several populations that include children, older adults, pregnant and post-partum women and provide more individualized recommendations. For the general adult population, at least 150 minutes of moderate or 75 minutes of vigorous-intensity aerobic activity spread throughout the week are recommended for important health benefits, however the idea that more activity leads to greater benefits is emphasized. Additionally, the guidelines stress that accumulating 10 minute bouts of sustained moderate to vigorous activity are sufficient to benefit from the activity (United States Department of Health and Human Services., 2008).
Since PA recommendations are geared toward the general population, focusing on the least amount of exercise for the greatest benefit for most people, individual activity patterns are still overlooked. Further studies to examine different patterns of PA throughout the day and week, the effects of light and highly vigorous intensity activity, and continuous bout length of exercise are needed.
Measuring Cardiovascular Disease Risk
Since numerous mechanisms through which PA impacts cardiovascular health have been identified, summary outcome measures that combine several risk factors have become popular in PA and health research. Cardiometabolic risk scores that combine risk factors for both
cardiovascular disease and type II diabetes have been used in cross-sectional and intervention studies as measures of general health outcomes (Camhi et al., 2011b; Holman, Carson, & Janssen, 2011; Sisson et al., 2010). However, for explicit study of cardiovascular health outcomes, a summary score that combines several know risk factors for cardiovascular disease
23 may provide an interesting solution for representing cardiovascular health outcomes in cross-sectional data.
Figure 2. The relationship between PA and cardiovascular risk as mediated by other variables.
Cardiovascular risk scores. Several cardiovascular risk scores that estimate the risk of
having a cardiovascular event in the next 10 years have been developed and are compared below. The goal for this study is to choose the most appropriate risk score to represent cardiovascular health of the U.S. adult population using NHANES data.
Framingham risk scores (FRS) consist of several models with slightly different outcomes. The Coronary Heart Disease (CHD) Risk Score controls for gender, age, smoking status, total cholesterol (TC), HDL cholesterol, systolic blood pressure (SBP), whether the patient is
24 is applicable for patients 30 to 74 years old and without overt CHD at the baseline examination. The hard CHD (myocardial infarction or coronary death) risk score controls for gender, age, smoking status, TC, HDL, SBP and BP treatment and is appropriate for individuals free of CHD, intermittent claudication and diabetes, 30–79 years of age (National Cholesterol Education Program (NCEP) Expert Panel, 2002). The General Heart Disease Risk Score controls for gender, age, diabetes, smoking, BP, TC, LDL cholesterol and is also applicable to patients 30 to 74 years old and without overt CHD at the baseline examination (D’Agostino et al., 2008). Comparison of the FRS with metabolic syndrome (MetSyn) classification showed that MetSyn is better at predicting diabetes while FRS is more successful at predicting cardiovascular events (Wannamethee, Shaper, Lennon, & Morris, 2005).
The Reynolds Risk Score was developed to improve prediction of CVD risk in women and is based on an initially healthy cohort of 24,558 U.S. women age 45 and over followed for a median of 10.2 years (Ridker, Buring, Rifai, & Cook, 2007). A model for men was later
developed based on 10,724 men with a median follow up of 10.8 years (Ridker, Paynter, Rifai, Gaziano, & Cook, 2008). The Reynolds risk score controls for the same variables as FRS with the addition of C-reactive protein (CRP) levels and family history of mother or father having a heart attack under the age of 60. Reynolds performed better than FRS when applied to data form NIH’s multiethnic Women's Health Initiative Observational Cohort with the latter model tending
to overestimate CVD risk (Cook et al., 2012).
There are many other 10-year cardiovascular risk scores that were developed following the FRS to better fit a specific population. The SCORE (Systematic COronary Risk Evaluation)
project focused on development of a risk score based on 12 European cohort studies for Europeans. Calibrated by country, it controls for gender, age, SBP, smoking status and
25 cholesterol ratio (TC/HDL) (Conroy et al., 2003). QRisk2 was developed specifically for
England and Wales, controlling for gender, age, ethnicity, SBP, BMI, smoke status, BP
treatment, type 2 diabetes, rheumatoid arthritis, renal disease, arterial fibrillation, TC/HDL, and Townsend deprivation score that describes material deprivation based on census data and family history of CHD (Hippisley-Cox et al., 2008). The SCORE risk score utilizes similar variables as FRS, but is specifically calibrated for the European population, while QRisk2 includes many more variables including a measure of socioeconomic status that is particular to the region the model was calibrated on.
Gaziano et al. (2008) developed laboratory and non-laboratory based CVD risk assessment models using NAHNES I follow up study cohort. The laboratory model uses age, gender, SBP, smoking status, TC, reported diabetes status and treatment for high BP for prediction while the non-laboratory model replaces TC with BMI yielding similar results. This model is very interesting in practice as the non-laboratory version does not require a blood draw; however, the goal of this study is to use the most accurate representation of cardiovascular risk, not the most practical.
Mora et al. (2007) found that the relationship between PA (assessed via questionnaire) and cardiovascular risk is mediated in large part by inflammatory/hemostatic factors, BP, cholesterol, and BMI and less so diabetes based on the Women’s Health Study data. The
mediation effect of homocysteine and creatinine levels was almost negligible. The only inflammatory/hemostatic biomarker available in the NHANES is CRP, a variable used in the Reynolds risk score. Additionally, studies show that risk scores such as the FRS and Reynolds developed on the general population do well in predicting CVD risk in diabetics (Chamnan et al.,
26 2009). Thus, it appears that the Reynolds risk score is a good candidate for the outcome variable for this study without the need for a separate model for diabetics.
Measuring Physical Activity
PA is bodily movement produced by contracting skeletal muscle that in turn increases energy expenditure. This broad definition leads to much confusion and consequent difficulty in measuring PA. Many forms of PA exist and may be classified by purpose, mode, or intensity. Methods of measuring PA strive to assign a number to the PA an individual has performed for comparative purposes.
To better study the dose-response relationship between PA and cardiovascular health, accurate and objective measures of PA are needed. Frequency, intensity and duration of the PA are often studied to identify the optimal dose of PA needed to elicit a positive health benefit and reduce disease risk. Currently, several methods of measuring PA are used in practice. Since there is no gold standard measure of PA, indirect and direct measures are used as estimates. All
methods have advantages and disadvantages and are chosen based on the target population, study costs and administrative burden (Ainsworth & Coleman, 2006; Strath et al., 2013).
Indirect measures. These measures are retrospective and are based on PA that has
already occurred. Some examples of indirect measures include surveys and questionnaires that ask study participants to recall the amount and type of PA performed over a period of time in the past. These methods are by far the easiest and least expensive to administer to a large number of participants and are therefore most often used in large-scale longitudinal studies.
The main disadvantages of indirect measures are their low accuracy and potential bias on the part of both researchers and participants. Because questionnaires rely on memory, study participants tend to either overestimate or inadequately recall the amount of PA performed.
27 Numerous studies have documented the low correlation of self-report PA questionnaires and actual activity performed (Atienza et al., 2011; Clark et al., 2011; Lynch et al., 2011; Troiano et al., 2008). At the same time, questionnaires may be constructed such that a major part of
someone’s PA is overlooked. An example may be a compendium of activities that does not
include household chores and gardening. A study participant may be physically active, but not according to the categories provided by the researchers.
Additionally, the intent of PA questionnaires is to obtain a general picture of an individual’s PA in a large-scale study. Thus, these approaches focus on aggregate measures,
likely ignoring individual PA patterns and specifics regarding frequency, duration and time. An avid exerciser who has a sedentary job versus someone who does no exercise at all, but walks all day due to his occupation have very different PA patterns. These patterns of PA are highly individual and lifestyle dependent and may not be adequately captured via am indirect measure such as a questionnaire.
Direct measures. These measures are collected as the PA is happening. Methods of
direct measures include diary entries, where the participant records all PA preformed, and direct observation, where all PA performed by the participant is observed and recorded by the
researcher. Direct measures yield objective and fairly accurate assessments of PA performed. Additionally, the measures provide information about the pattern of PA that includes the frequency, duration, and intensity. Data obtained with direct measures allows to further study bout length of the activity. However, the numerous advantages of direct measures carry a much greater burden than indirect measures.
First, these methods are only accurate for a specified time frame of the study; however, participants may alter their behavior in response to having to record their actions or to being
28 observed. Thus, findings may not be representative of the typical PA of an individual. Next, to obtain detailed direct measures of PA, careful planning, monitoring and training are often required. Additionally, the recorded qualitative data is time consuming to code and difficult to score and analyze, making these approaches inefficient for large scale studies. Thus, likely applications of direct measures are for smaller scale interventions and exercise training studies.
Recent technological advances offer a solution to some of the challenges associated with diary and observation methods. Electronic devices such as accelerometers measure when and at what intensity, frequency and duration the PA was performed and are continuously becoming more accurate and less expensive. Furthermore, wearing an accelerometer for a study solves issues with recall or overestimation while being unobtrusive for the participants. Thus, these devices offer objective and fairly accurate measures that are appropriate for large-scale studies and carry little administrative burden.
Accelerometers contain a small mass on a spring that is displaced by the movement of the case and presses on either a crystal (piezoelectric) or a capacitor (capacitative) to convert the motion into an electric signal. This configuration is only able to measure acceleration in one plane of motion, so the basic accelerometers are uniaxial. Triaxial accelerometers consist of three uniaxial accelerometers measuring acceleration in three different planes of motion. These types of accelerometers are included in many cell phones and fitness devices.
However, these devices are somewhat limited in detection of certain activities. Due to their construction, accelerometers are most appropriate for detecting ambulatory activities such as walking and running. Activities that do not involve undulating motion such as swimming or rowing may not be detected by certain types of accelerometers. Also, accelerometer accuracy varies depending on placement of the device on the body. It has been shown that hip placement
29 is more accurate for detection of most ambulatory activities, while wrist or ankle placement works better for finer movements (Cleland et al., 2013). It also appears that using two accelerometers on different locations on the body works better for detection of finer grained activities (Cleland et al., 2013).
Finally, a major issue in research using accelerometer-derived PA data is usability and interpretability of the findings. Raw accelerometer results are provided as step counts for a preset interval. Thus, the number of raw readings is usually very large. To render the data useful, the counts must be summarized in a meaningful way. Often, accelerometer data is reduced using predetermined intensity thresholds for light, moderate, and vigorous activity or converted to energy expenditure using existing models (Alhassan & Robinson, 2010; Bouten et al., 1997; Crouter, Clowers, & Bassett, 2006; Rothney et al., 2008; Troiano, 2006; Tudor-Locke, Johnson, & Katzmarzyk, 2009; Vanhelst, Béghin, Turck, & Gottrand, 2011; Wong, Colley, Connor Gorber, & Tremblay, 2011). The use of cutoffs, however, is a “crude categorization of activity status” and overlooks the unique pattern of PA on the individual level (Ainsworth & Coleman,
2006). Approaches to extracting useful findings from accelerometer data are still in development with noteworthy methods discussed below.
Accelerometers in health research. The use of accelerometers has become popular in
health research (Troiano, 2006). Accelerometer data has been used to assess the adherence to PA recommendations in population-based studies and to examine the relationship between PA and a variety of health outcomes such as cancer, diabetes, kidney disease, and cardiometabolic risk factors (Camhi et al., 2011b; Gerber et al., 2012; Hawkins et al., 2011; Lynch et al., 2010, 2011; Smith et al., 2011; Tudor-Locke, Brashear, Johnson, & Katzmarzyk, 2010; Tudor-Locke et al., 2009; Wong et al., 2011). Additionally, the popularity of accelerometers in various handheld
30 devices such as smart phones and wristbands has sparked interest in providing real-time
feedback to users tracking their own PA for fitness purposes (Cleland et al., 2013; Pärkkä, Cluitmans, & Ermes, 2010; Tapia et al., 2007). Finally, accelerometers have been used to assess PA in nonhuman subjects, notably cattle, with growing interest in assessment of pets (Guo et al., 2009; Michel & Brown, 2011; O’Connell, Tøgersen, Friggens, Løvendahl, & Højsgaard, 2010; Robert, White, Renter, & Larson, 2009).
NHANES Accelerometer Data
The National Health Survey Act of 1956, signed by President Eisenhower, commenced an on-going, cross-sectional survey representative of the American people, focusing on disease, injury, impairment, and disability (“NHIS - About the National Health Interview Survey,” 2015). Conducted by the National Center for Health Statistics, initial surveys in the 1960’s concentrated on chronic diseases in the adult population. In 1970, a new component focusing on nutrition and its relationship to health outcomes was introduced. In the 1980’s the survey expanded to include a major focus on representing minority ethnic groups in the U.S. The current NHANES survey began in 1999, collecting numerous health related variables using questionnaires, examinations and laboratory based tests from 7,000 randomly chosen American residents every year
(“NHANES - History,” 2011).
In 2003, the NHANES introduced accelerometers to the examination. As described earlier, gathering free-living PA data is a challenge and a survey may not capture true activity patterns accurately. Including accelerometers in a large-scale study aimed at gathering an
objective view of free-living PA patterns of a representative sample of US residents (“NHANES 2003–2004: Physical Activity Monitor Data Documentation, Codebook, and Frequencies,” 2007). The NHANES 2003–2004 and 2005–2006 cycles used uniaxial accelerometers to gather a
31 week of PA readings. Thus, the data offers a unique opportunity to objectively study PA patterns of a representative sample of the U.S. population in conjunction with a variety of health
outcomes.
Studies using NHANES accelerometer data. One of the goals of studies using the
NHANES accelerometer data is to compare self-reported PA measures to those derived by the ActiGraph PA monitor. Atienza et al. (2011) show a large discrepancy between self-reported and objectively measured PA and the relationship of the two measures to various biomarkers. Studies also use the NHANES accelerometer data to look at PA patterns of the general U.S. adult
population, as well as special populations including children, pregnant women, and cancer survivors (Belcher et al., 2010; Camhi, Sisson, Johnson, Katzmarzyk, & Tudor-Locke, 2011a; Clark et al., 2011; Evenson & Wen, 2011; Smith et al., 2011; Troiano et al., 2008; Tudor-Locke, Brashear, et al., 2010; Tudor-Locke et al., 2009; Tudor-Locke, Johnson, & Katzmarzyk, 2010, 2011).
Since the NHANES data also offers a variety of health-related outcomes derived both by questionnaire and laboratory testing, numerous studies strive to establish a relationship between accelerometer-derived PA and various health outcomes. These include breast cancer, kidney disease, non-alcoholic fatty liver disease, depression, and insomnia (Chasens & Yang, 2012; Gerber et al., 2012; Hawkins et al., 2011; Lynch et al., 2010, 2011; Vallance et al., 2011).
Several approaches were used to study cardiovascular health outcomes. Some studies focused on metabolic syndrome defined as having three or more cardiometabolic risk factors that include large waist circumference, high levels of triglycerides, low HDL, high blood pressure and elevated fasting glucose while others concentrated on the risk factors individually adding high BMI as an outcome (Camhi et al., 2011a; Holman et al., 2011; Luke et al., 2011; Sisson et
32 al., 2010). Healy et al. (2011) considered the effects of sedentary time on cardiometabolic and inflammatory markers using CRP in addition to the outcomes listed above. Atienza et al. (2011) also used skinfold measures, glycohemoglobin, C-peptide and homocysteine levels as outcomes to compare self-reported and accelerometer derived PA. No studies using NHANES
accelerometer data used 10-year cardiovascular risk scores as outcomes.
Reduction of NHANES accelerometer data. The NHANES PA monitor data provides
readings for every consecutive minute of the week the subject wore the accelerometer. Thus, 10,080 intensity readings are available for every individual included in the study, provided that the data is complete. Techniques are needed to extract useful information from such a large volume of data for further analysis. The majority of the studies using the NHANES
accelerometer data rely on a SAS macro provided by the National Cancer Institute (NCI) to summarize the data and render it usable.
The approach suggested by NCI involves dividing the week’s data into days and classifying the data into intensity categories defined by predetermined thresholds of intensity counts (Troiano et al., 2008; Trost, Pate, Freedson, Sallis, & Taylor, 2000). Once categorized, the amount of time spent in each category during the day is averaged for each person over the course of the week. This way, the average time per day spent in low, moderate, and vigorous intensity activity is calculated and the continuous nature of the data is discretized (Tudor-Locke et al., 2009). For example, every minute of an adult’s intensity reading above 2,020 would be categorized as vigorous activity. Total or average time spent in vigorous activity over the week would be used for the analysis.
This approach successfully reduces the large volume of data to just one reading for the three intensity categories per person rendering it possible to use regression models to establish
33 the connection between PA and health status. Some studies used slightly different approaches to categorization such as analyzing cadence instead of intensity or using different thresholds for a closer look at lifestyle activity instead of the low, moderate and vigorous intensity categories (Camhi et al., 2011a; Tudor-Locke, Camhi, et al., 2011). Nevertheless, the use of thresholds to separate accelerometer data into PA categories may be masking some individual differences that may be of interest with respect to predicting health outcomes of the participants.
The rich details the data may offer are lost due to the data reduction via averaging the intensity readings using thresholds. Each individual has a unique pattern to his daily PA based on daily habits, occupation, and health status. Important clues to an individual’s health status may be averaged out with this technique and remain unnoticed. Additionally, Tudor-Locke et al. (2011) suggest that the population estimates are distorted due to non-wear time at the end of the day. Furthermore, the use of thresholds may distort the results since these cutoff points are the same for everyone while moderate intensity for one person may be vigorous intensity for another who is less fit. Loprinzi et al. (2012) compare different thresholds for PA and show that changes in cut points for PA in both children and adults influenced the resulting adherence to PA
guidelines and relationship to health outcomes. Analysis of the NHANES accelerometer data may be improved by using a more individualized approach to data reduction rather than the use of cutoff scores.
Analysis of NHANES accelerometer data. Following the data reduction described
above, studies analyzing the NHANES accelerometer data utilized linear or logistic regression models to study the relationship between PA and health outcomes. Logistic regression is a type of regression model where the dependent variable is categorical. This approach was used when the outcome was coded as a binary variable dependent on average accelerometer-derived PA
34 (Belcher et al., 2010; Camhi et al., 2011b; Sisson et al., 2010; Smith et al., 2011). Linear
regression models were used when continuous variables such as triglycerides or blood glucose levels were studied as outcomes (Atienza et al., 2011; Chasens & Yang, 2012; Clark et al., 2011; Gerber et al., 2012; Hawkins et al., 2011; Healy et al., 2011; Lynch et al., 2010, 2011; Tudor-Locke, Johnson, et al., 2011). Correlations, coefficients, and analysis of variance (ANOVA) were also used to study differences in PA levels in various groups (Chasens & Yang, 2012; Hawkins et al., 2011; Luke et al., 2011; Tudor-Locke, Camhi, et al., 2011; Van Domelen et al., 2011).
Studies analyzing NHANES accelerometer data focused on either the adherence to PA recommendations or establishing the relationship between PA and various health outcomes. These approaches to NHANES accelerometer data used standard statistical procedures for analysis and did not take advantage of machine learning methodology that would allow for a more tailored approach to recognizing patterns in the data. Although prior studies of the
accelerometer-derived PA data show a clear relationship with health-related outcomes measured by the NHANES, analysis of the data with the help of machine learning techniques may
potentially augment the findings. Machine learning techniques may be helpful for extracting useful information while retaining the individualized and highly detailed nature of the NHANES accelerometer data.
Analysis of Accelerometer Data in Other Settings
Studies that use machine learning algorithms for analysis of accelerometer-derived PA largely focus on predicting the mode of PA performed in clinical settings (Baek, Lee, Park, & Yun, 2004; Bao & Intille, 2004; Gaura, Rider, Steele, & Naguib, 2001; Mannini & Sabatini, 2010; Pärkkä et al., 2006; Pober, Staudenmayer, Raphael, & Freedson, 2006; Sprager & Zazula,
35 2009; Staudenmayer, Pober, Crouter, Bassett, & Freedson, 2009). Some studies aim to connect PA patterns to posture recognition and fall detection but are also conducted in a controlled
environment with known activities (Giansanti, 2006; Gjoreski, Lustrek, & Gams, 2011; S.-H. Liu & Chang, 2009).
Some accelerometer studies also focusing on activity recognition have been conducted in realistic conditions outside of a clinical environment (Bao & Intille, 2004; Ermes et al., 2008; Pärkkä et al., 2006). Accelerometer-derived PA patterns in cattle, data that was collected in a free-living environment, have also been studied using machine learning algorithms with the main focus of classifying cattle movements into lying, standing, grazing etc. (Guo et al., 2009;
Martiskainen et al., 2009; Robert et al., 2009).
One study did aim to connect cattle behavior monitored by accelerometers with reproductive status based on progesterone levels (O’Connell et al., 2010). That application suggests that machine learning methods may successfully be applied not only for classifying accelerometer-derived PA into activity types but also for recognizing patterns in movement that help predict health status.
Machine learning algorithms have also been applied to accelerometers data for diagnosis of tremor related disease such as Parkinson’s, the classification and assessment of severity of
Levodopa-Induced Dyskinesia, and recognition of involuntary gestures in babies with cerebral palsy (Gaura et al., 2001; Keijsers, Horstink, & Gielen, 2003; Keijsers, Horstink, van Hilten, Hoff, & Gielen, 2000; Singh & Patterson, 2010; Tsipouras et al., 2010). Thus, machine learning methods show promise in recognizing abnormal movement patterns for classification of disease status.
36 The NHANES accelerometer data offers a look at a week of PA in a natural setting connected with a variety of health-related biomarkers of the participants. No known studies have attempted to connect accelerometer-derived PA in a free-living environment and health status in human participants using machine learning.
Classification of Health Status Using Machine Learning
Machine learning algorithms have been successfully used for classification of health outcomes using other types of data in the medical field. Machine learning applications include detection of breast cancer from biopsied tissue, prediction of functional health status of
HIV/AIDS patients, genetic research using mass spectrometry for detection of various types of cancers, and detection of pulmonary disease from breath data (Hauschild & Baumbach, 2012; Kwak & Lee, 1997; Shipp et al., 2002; Wolberg, Street, & Mangasarian, 1995; Wu et al., 2003).
Studies have shown that machine learning algorithms show greater accuracy for classification of at-risk populations in public health settings when compared with more
traditional methods such as the logistic regression (Lemon, Roy, Clark, Friedmann, & Rakowski, 2003). Furthermore, Song, Mitnitski, Cox, and Rockwood (2004) show that machine learning algorithms are superior to traditional methods for predicting health outcomes, particularly when nonlinear relationships between the inputs and outcome variables are present. It appears that health status may successfully be classified by machine learning, but the method has yet to be applied to the NHANES accelerometer data.
Machine Learning Methods
There are two major types of problems that machine learning algorithms help solve: supervised and unsupervised. Supervised learning occurs when the outcomes are known and the machine learns to predict outcomes given new cases. A set of training data, where both inputs
37 and outcome variables are known, is used to build a model. The model is then applied to a set of new test data where the input variables are classified and compared to actual outcome variables. Supervised learning algorithms include regression (for continuous variables) and classification (for discrete variables) problems. Unsupervised learning problems do not assume a set of specific outcome variables and the algorithms used are aimed at finding patterns and clusters in the input variables. In this scenario the machine learns by itself (Hastie et al., 2009). Given a set of
accelerometer-derived PA data from the NHANES, the purpose of this study is to classify the cardiovascular health status of the participant, a known outcome, thus supervised learning algorithms are of particular interest.
As described by Hastie et al