STATE OF CALIFORNIA Edmund G. Brown Jr., Governor PUBLIC UTILITIES COMMISSION
505 VAN NESS AVENUE
SAN FRANCISCO, CA 94102‐3298
Commission
Staff Report
Lessons
Learned
From
Summer
2012
Southern
California
Investor
Owned
Utilities’
Demand
Response
Programs
May
1,
2013
Performance of 2012 Demand Response programs of San Diego Gas and Electric Company and Southern California Edison Company: report on lessons learned, staff analysis, and recommendations for 2013‐2014 program revisions in compliance with Ordering Paragraph 31 of Decision 13‐04‐017.
ACKNOWLEDGEMENT
The following Commission staff contributed to this report:
Bruce Kaneshiro
Scarlett Liang‐Uejio
Tim Drew Rajan Mutialu Dorris Chow Paula Gruendling Taaru Chawla Jennifer Caron Alan Meck
TABLE OF CONTENTS
EXECUTIVE SUMMARY ... 1
Chapter 1: Introduction ... 5
I. 2012 Summer Reliability and Demand Response Programs ... 5
II. Energy Division November 16, 2012 Letter and the Staff Report ... 6
Chapter 2: Demand Response Program Load Impact ... 8
I. Summary of Staff Analysis and Recommendations ... 8
II. Different DR Load Impact Estimates ... 9
III. Comparison of DR Daily Forecast and Ex‐Post Results ... 9
IV. Comparison of the 2012 Ex‐Post to the 2012 Resource Adequacy (RA) ... 26
Chapter 3: Demand Response Program Operations ... 32
I. Summary of Staff Analysis and Recommendations ... 32
II. 2012 DR Program Trigger Criteria and Event Triggers ... 32
III. DR Events Vs. Peaker Plant Service Hours ... 33
IV. Peaker Plant Comparison ... 34
V. Conclusions ... 35
Chapter 4: Residential Demand Response Programs ... 36
I. Summary of Staff Analysis and Recommendations ... 36
II. Residential Peak Time Rebate (PTR) ... 36
III. Residential Air Conditioning (AC) Cycling ... 51
Chapter 5: Non‐Residential Demand Response Programs ... 57
I. Summary of Staff Analysis and Recommendations ... 57
II. Background and Summary of Utility Data ... 57
III. Commercial Air Conditioning (AC) Cycling ... 59
IV. SCE’s Auto‐DR ... 63
V. SDG&E’s Demand Bidding Program (DBP) ... 65
Chapter 6: Flex Alert Effectiveness ... 67
I. Summary of Staff Analysis and Recommendations ... 67
II. Background ... 67
III. Utility Experience with Flex Alert ... 69
IV. Customer Experience ... 69
V. The Future of Flex Alert ... 71
VI. DR Program Ex‐Post Load Impact Results on the Flex Alert Days ... 71
I. Summary of Staff Analysis and Recommendations ... 73
II. Definition of Price Spikes ... 73
III. DR Programs and Price Spikes ... 73
IV. Conclusion ... 74
Chapter 8: Coordination with the CAISO ... 75
I. Staff Recommendations ... 75
II. DR Reporting Requirements in Summer 2012 ... 75
III. DR Reporting Requirements for 2013‐2014 ... 76
Appendix A: Highlight of 2012 Summer Weather & Load Conditions ... 77
Appendix B: Energy Division November 16, 2012 Letter ... 78
Appendix C: Descriptions of DR Load Impact Estimates ... 79
Appendix D: SCE 2012 Monthly Average DR Program Load Impact (MW) ... 85
Appendix E: SCE 2012 DR Program Load Impact by Event (MW) ... 87
Appendix F: SDG&E 2012 Monthly Average DR Program Load Impact (MW) ... 91
Appendix G: SDG&E 2012 DR Program Load Impact by Event (MW) ... 92
Appendix H: SCE 2012 DR Program Overview ... 93
Appendix I: SDG&E DR Program Overview ... 96
Appendix J: SCE Historical DR Event Hours ... 98
Appendix K: SCE Historical Number of DR Events ... 99
Appendix L: Summary of SCE’s Reasons for the 2012 DR Triggers ... 100
Appendix M: SDG&E Historical DR Event Hours ... 101
Appendix N: SDG&E Historical Number of DR Events ... 102
Appendix O: Utilities’ Peaker Plant Total Permissible vs. Actual Service Hours ... 103
Appendix P: Ex‐Post Demand Response Load Impact on Flex Alert Days ... 104
Appendix Q: CAISO Energy Price Spikes... 105
Appendix R: Utilities’ Demand Response Reporting Requirements ... 111
Appendix S: Additional Information ... 113
1
EXECUTIVE SUMMARY
This report is prepared by Energy Division in compliance with Ordering Paragraph 31 of
D.13‐04‐017. The purpose of this report is to provide the lessons learned from the 2012
Demand Response (DR) programs operated by San Diego Gas and Electric Company (SDG&E)
and Southern California Edison Company (SCE) (Utilities), and to recommend program or
operational revisions, including continuing, adding, or eliminating DR programs. Below are
highlighted conclusions and recommendations in the report. To see all recommendations,
please go to each chapter in the report.
In summary, Energy Division makes the following overarching conclusions about the
Utilities’ DR programs:
Forecast vs. Ex‐Post: While a few DR programs met or even exceeded their daily
forecast when triggered, on average the ex‐post results for all program events
diverge from the daily forecast by a considerable degree. The majority of programs
either provided a ‘mixed’ performance (the program both over‐ and under‐
performed relative to its forecast) or were poor performers (consistently coming up
short relative to its forecast). Of particular note are the Utilities’ Peak Time Rebate
program1 and SCE’s Summer Discount Plan.2 (Chapter 2)
The divergence between the ex‐post results and the daily forecasts can be traced to
a variety of causes, such as inadequate forecasting methods employed by the
Utilities, program design flaws, non‐performance by program participants and/or
program operations. A complete explanation of the reasons for divergence across
all programs however, was not possible within the scope and timing of this report.
(Chapter 2)
2012 RA vs. Ex‐Post: Comparing the ex‐post results to the 2012 Resource Adequacy
(RA) forecast is not a good indicator as to how well a DR program performs. RA
forecasts are intended for resource planning needs. Ex‐post load impacts reflect
demand reductions obtained in response to operational needs at the time the
program is triggered. Resource planning and operational planning have different
conditions and serve different purposes. (Chapter 2)
DR vs. Peaker Plants: The Utilities used their DR programs fewer times and hours
than the programs’ limits (each program is limited to a certain number of hours or
events). In contrast, the Utilities dispatched their peaker power plants far more
frequently in 2012 in comparison to 2006 – 2011 historical averages. (Chapter 3)
Energy Price Spikes: DR programs are not currently designed to effectively mitigate
price spikes in the CAISO’s energy market. On many days a DR event was called and
1
SCE’s marketing name for Peak Time Rebate is “Save Power Day” , SDG&E calls it “Reduce Your Use”.
no price spikes occurred, and conversely there were days where price spikes
occurred and DR events were not called. The timing and scope of this report did not
permit a quantification of the cost of unmitigated price spikes to ratepayers, but in
theory, avoidance of these spikes would benefit ratepayers. (Chapter 7)
Energy Division also makes the following program‐specific conclusions about the Utilities’
DR programs:
SCE’s AC Cycling Program Forecasting: SCE’s 2012 forecasting methodology for its
air conditioning (AC) Cycling program (the DR program that SCE triggered the most
in 2012) cannot be relied upon to effectively predict actual program load reductions.
(Chapter 2)
SCE’s AC Cycling Dispatch Strategy: SCE’s sub‐group dispatch strategy for its AC
Cycling Program (also called Summer Discount Plan) created adverse ‘rebound’
effects, thereby reducing the effectiveness of the program during critical hot
weather days, e.g. 1‐in‐10 weather. (Chapter 2)
SDG&E’s Demand Bidding Program: SDG&E Demand Bidding Program produced on
average 5 MW of load reduction when triggered, although the US Navy did not
participate. The US Navy claimed certain program terms and conditions precluded
it from participating in the 2012 program. The Commission’s decision to modify the
program to a 30‐minute trigger may further limit the US Navy’s ability to participate.
(Chapter 5)
Peak Time Rebate Awareness: SCE and SDG&E customers who received utility
notification of Peak Time Rebate (PTR) events had higher awareness of the program
when compared to customers who were not notified by the utility. More
importantly, customers who opted into receiving PTR alerts significantly reduced
load. All other customers in the program provided minimal load reduction. (Chapter
4)
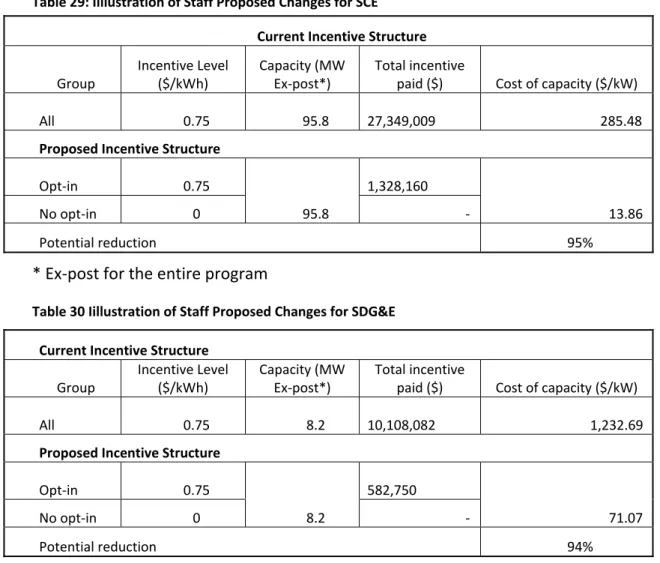
Peak Time Rebate Free Ridership: The Utilities’ PTR program has a potentially large
‘free ridership’ problem, where customers receive incentives without significantly
reducing load. SCE paid $22 million (85% of total PTR incentives in 2012) in PTR bill
credits to customers whose load impact was not considered for forecast or ex‐post
purposes. 94% of SDG&E’s 2012 PTR incentives ($10 million) were paid to
customers who did not provide significant load reduction. The inaccuracy of
settlement methodology (in comparison to the ex‐post results) is the main reason
for the ‘free‐ridership’ problem. The default nature of the program (everyone is
automatically eligible for the incentives) aggravates the problem. (Chapter 4).
Flex Alert: There is a lack of data to evaluate the effectiveness and value of the Flex
Alert campaign. Attribution of savings from Flex Alert is complicated by the fact
triggered in 2012 contributed to reduced system peak load. A load impact
evaluation of Flex Alert is planned for 2013. (Chapter 6)
DR Reports: The Utilities’ DR daily and weekly reports were useful to the CAISO and
the Commission for purposes of up‐to‐date monitoring of DR resources throughout
the summer. (Chapter 8)
In light of above findings, Energy Division recommends the following:
DR Evaluation: The Commission should require further evaluation of Utility DR
program operations in comparison to Utility operation of peaker plants for the
purpose of ensuring Utility compliance with the Loading Order. (Chapter 3)
Forecast Methods Generally: The Utilities’ daily forecasting methods for all DR
programs (especially AC cycling and other poor performers) should undergo
meaningful and immediate improvements so that the day‐ahead forecasting
becomes an effective and reliable tool for grid operators and scheduling
coordinators. (Chapter 2)
Forecasting for SCE’s AC Cycling Program: SCE should improve forecasting methods
for its residential AC Cycling Program with input from agencies and stakeholders.
SCE should also pilot more than one forecasting method for the program in 2013.
(Chapter 2)
Forecasting for SDG&E Programs: SDG&E’s forecasting methods for its AC Cycling
Program (Summer Saver) could be improved doing the following: running a test
event and including a correlation variable that accounts for customer fatigue.
SDG&E’s Capacity Bidding Program forecasting could be improved by including a
weather variable. (Chapter 2)
SCE’s Outreach for Commercial AC Cycling: Through its outreach and marketing
efforts, SCE should clearly communicate the new features of its commercial AC
cycling program to avoid customer dissatisfaction and dropout. (Chapter 5)
Auto DR: Future studies are necessary to explore the load impacts of Auto‐DR.
(Chapter 5)
SDG&E’s Demand Bidding Program: SDG&E should work collaboratively with the US
Navy to design a program to meet the unique needs of the Navy. Key attributes to
consider are a day‐ahead trigger, aggregation of 8 billable meters and a minimum
bid requirement of 3 megawatts (MW). (Chapter 5)
Peak Time Rebate Design Changes: The Utilities’ residential PTR program should be
changed from a default program to an opt‐in program, so that bill credits are paid
only to customers who opt‐in. (Chapter 4)
SCE’s AC Cycling Dispatch Strategy: SCE should reconsider its current strategy of
calling groups of residential AC cycling customers in sequential one‐hour cycling
program’s incentive structure so that customers who are willing to have their AC
units cycled for an entire event (as opposed to just one hour) are compensated
more than those who can tolerate only one hour of cycling. (Chapter 4)
DR Reports: The Utilities (and Pacific Gas & Electric) should submit daily and weekly
DR reports to the CAISO and the Commission for the summers of 2013 and 2014.
They should follow the same format and data requirements in the 2012 reports,
unless otherwise directed by the Commission or Commission staff. (Chapter 8)
5
Chapter 1: Introduction
I. 2012 Summer Reliability and Demand Response Programs
San Onofre Nuclear Generating Station (SONGS) Units 2 and 3 were taken out of service in
January 2012. By March 2012, the Commission determined that the outage of SONGS’ two
units could extend through summer 2012. Working closely with the Governor’s Office, the
California Independent System Operator (CAISO), and the California Energy Commission (CEC),
the Commission took immediate mitigation actions to ensure that lights stay on in California
with the loss of 2,200 MW of capacity provided by SONGS.3
When considering adding new generation resources,4 an important action was to further
incorporate the Utilities’ Demand Response (DR) programs into the CAISO’s contingency
planning and daily grid operations during the summer. This included mapping the Utilities’ DR
programs to grid contingency plans and developing new daily and weekly DR reporting
requirements. In addition, the Commission also moved swiftly to approve three new DR
programs for summer 2012: SDG&E’s Peak Time Rebate (PTR) for commercial customers and
Demand Bidding Program (DBP); and SCE’s 10 for 10 conservation program for non‐residential
customers.5
Because of the intensive interagency mitigation effort and relatively cool weather,
California grid reliability was not compromised in spite of the SONGS outage. Nevertheless,
southern California experienced several heat waves in August and September with the highest
temperature reaching 109°F in SDG&E’s service area and 100°F for SCE on September 14.6 The
CAISO issued two Flex Alerts: on August 10 and 14. The Utilities triggered all of their DR
programs at least once and some on multiple occasions.
Throughout the summer, Energy Division (ED) staff monitored the Utilities’ DR program
events on a daily basis and provided weekly briefings to the Governor’s Office, the CAISO, and
the CEC. Staff observed that, for many event days, the load impact forecasts provided by the
Utilities to the CAISO and the Commission in their daily DR reports were inconsistent with the
results submitted seven days after each event (referred as the “7‐Day report”). In some cases,
the Utilities reported much lower load reduction results than they originally forecasted. In
addition, load impact forecasts provided by the Utilities throughout the summer were lower
than the capacity counted for the 2012 Resource Adequacy (RA) Requirement. This raised a
question as to whether the Commission might have overestimated DR load impact for RA
purposes or, rather, if the Utilities might have under‐utilized their DR programs.
Sometime in mid‐summer, the Utilities began to experience price spikes in CAISO’s
wholesale energy market. Questions were raised on whether the DR programs could be used
to mitigate price spikes, and if so, should they be. 3 http://www.songscommunity.com/value.asp 4 Retired Huntington Beach Units 3 and 4 were brought back on‐line temporarily. 5 Resolutions E‐4502 and E‐4511 6 A 1‐in‐10 (or 10% probability) weather condition in any given years.
Some of the Utilities’ DR programs were triggered on as many as 23 events over the five
summer months, and many were triggered on two or three consecutive days. Appendix A
highlights the DR program load impact on the three hottest days and the three days when
SDG&E and SCE experienced highest system peak load. Staff observed that SDG&E’s system
peak correlate to temperature and biggest DR load reduction happened on the hottest day.
On the other hand, SCE’s system peak load did not consistently correlate to weather. In
contrast, SCE’s system load reached its annual peak at 90°F temperature, 10°F cooler than the
hottest day in its service territory. Counter intuitively, DR program load impact on a cooler day
was actually higher than the amount delivered on the hottest day. This led to questions how
the Utilities make decisions to trigger DR programs and whether aspects of the customers’
experience, such as expectations and fatigue have an effect.
In August, CAISO issued two Flex Alerts when it determined a reliability risk due to
insufficient supply to meet demand. As expected, the Utilities triggered relatively large
amounts of DR programs on both days. CAISO reported that the actual peak load was
significantly lower than its hours‐ahead forecasts and attributed the load drop to Flex Alert
events. This parallel dispatch situation raises important questions regarding the effectiveness
of the Flex Alert when overlapped with the Utilities’ DR program events and how customers
perceived with these statewide alerts versus local utility DR notifications.
Based on the above experience, the Commission concluded that staff should evaluate DR
program performance and other lessons learned in order to seek answers to these and other
questions. Such lessons could help the Commission to determine the extent of DR program
reliability and usefulness and in turn, to the extent to which DR resources can be counted on in
CAISO markets and operations.
II. Energy Division November 16, 2012 Letter and the Staff Report
On November 16, 2012, the Energy Division sent a letter (Energy Division Letter) to the
Utilities directing the Utilities to 1) file an application proposing DR program improvements for
2013 and 2014 to mitigate the SONGS outage and 2) provide data and responses to a set of
questions on lessons learned from 2012 DR programs. The questions were developed based on
the Utilities’ 2012 demand response experience and fell into six categories:
1. DR Program Performance, which include load impact and program
operations,
2. CAISO Market, covering price spikes and market analysis
3. Customer Experience,
4. Coordination with the CAISO and Utility Operations
5. Emergency DR Program Dispatch Order, and
6. Flex Alert Effectiveness
On December 21, 2012, the Utilities filed separate applications for the approval of the DR
program revisions for 2013 and 2014.7 The Utilities submitted data and responses to the
questions attached to the Energy Division Letter and subsequent Assigned Administrative Law
(ALJ) rulings for developing the record.8 Decision (D.)13‐04‐017 approved certain DR program
improvements for 2013‐2014 and directed the Commission staff to develop a report on the
lessons learned from the DR programs in 2012.
This report is based on a snapshot of data and studies available at the time (i.e. ex‐post load
impact data, utility responses to Energy Division data requests, etc.) On‐going and future (e.g.
Flex Alert load impact analysis per D.13‐04‐021) evaluations will shed further light on the issues
raised in this report.
One point of emphasis in this report is the extent to which the current DR programs
delivered their forecasted savings when they were triggered by the utilities. It is important to
understand that there are a range of factors that can affect whether a program delivers its
forecasted savings targets. Some of these factors can be controlled through good program
design, operation and forecasting methodologies. Other factors that can impact program
performance are exogenous or outside the utilities’ control such as temperature, participant
enrollment fluctuations, and behavioral or technological changes by the participants.
While this report contains certain findings and recommendations for DR programs, we
caution against sweeping conclusions or generalizations about DR programs based on this
report. The point of this report is to find ways to improve existing DR programs so that they
are more useful to grid operators, utilities, ratepayers and participants.
7 A.12‐12‐016 (SDG&E) and A.12‐12‐017 (SCE). 8
8
Chapter 2: Demand Response Program Load Impact
I. Summary of Staff Analysis and Recommendations
SCE
Most of the program event ex‐post results diverge from the daily forecast by a considerable
degree. The daily forecast should be more consistent with the ex‐post results in order for the
day‐ahead forecasting to be valid and useful for grid operators. Staff recommends that the
daily forecasting methods for all programs undergo meaningful and substantial improvements,
including more thorough and transparent documentation and vetting through relevant agencies
and stakeholders.
The Summer Discount Plan (Residential AC Cycling) program forecasting methods in
particular requires an audience with a broad panel of agencies and stakeholders. Staff also
recommends that SCE pilot more than one forecasting method and conduct interim protocol‐
based load impact evaluations to identify the most reliable forecasting methods throughout the
2013 summer season.
SCE should also be required to address Summer Discount Plan program operation issues
before the 2013 summer peak season begins, if possible. Specifically, the strategy of calling
groups of customers for sequential one hour cycling events, rather than calling all the
customers for the duration of the full event (or other potential strategies), needs to be
reconsidered before the program is further deployed. As discussed in detail later in this
chapter, this strategy resulted in load increases during the latter hours of events, thereby
reducing the overall effectiveness of the program.
SDG&E
Similar to SCE, many of SDG&E’s program event ex‐post results also diverge from the daily
forecast by a considerable degree. The Demand Bidding Program daily forecast was accurate
and reliable in predicting ex‐post results, while the Summer Saver and Capacity Bidding Day
Ahead and Day Of program daily forecasts did not accurately nor reliably predict ex‐post results.
The Peak Time Rebate Residential daily forecast was not accurate in predicting ex‐post results,
but consistently underestimated ex‐post results by approximately 80%. The Critical Peak
Pricing and Base Interruptible program did not accurately or reliably predict ex‐post results, but
consistently under predicted ex‐post load impacts. Due to a weak price signal and inelastic
customer demand, the PTR commercial program ex‐post results were not significant. The CPP‐E
was discontinued as of December 31, 2012.
Staff recommends (1) including only customers that opt‐in to receive e‐mail or text alerts in
the PTR residential daily forecast model (2) running a test event to measure % load impact per
customer in order to improve CPP daily forecast estimates (3) including a correlation variable in
the Summer Saver daily forecast model to account for customer fatigue during successive event
days (4) including a weather variable in the CBP daily forecast model in order to have parity
II. Different DR Load Impact Estimates
DR programs load impact are forecasted or estimated at different times for different
purposes. The following table summarizes the five different DR load impact estimates that are
discussed in this chapter. Detail descriptions and methodologies for each DR program
measurement are provided in Appendix C. Table 1: DR Load Impact Estimates
DR Load Impact Estimates General Description Purpose
Ex Ante for RA (e.g., 2012 RA) A year‐ahead monthly ex ante load
impact potential attributed by
individual program under a 1‐in‐2
weather condition.
To determine the RA counting against
the Load Serving Entity’s system and
local capacity requirements.
Daily Forecast The Utilities’ daily estimate of hourly
load impact from DR programs during
an event period.
To provide the CAISO, CPUC, and CEC the
hourly MW provided by DR programs on
each event day.
7‐Day Report The Utilities’ preliminary estimate of
hourly load reduction results from
each triggered DR program
To report to the CAISO the load
reduction data from the triggered DR
programs seven days after each DR
event.
Ex‐Post Results The Utilities’ most accurate
measurement of the load impact
results from all of the DR programs
triggered in a year. The ex‐post
results are calculated using
comprehensive regression models.
To report to the CPUC the actual results
of the DR events
Settlement A measurement of customers’ load
reduction from their specific reference
load using a baseline method.
To calculate customers’ incentive
payments for billing purpose.
In this proceeding, the Utilities provided the above DR load impact estimates for their DR
programs, which are shown in Appendices D to G.
III. Comparison of DR Daily Forecast and Ex‐Post Results A. Overall Program Performance
The following section draws on data provided by the Utilities on March 4, 20139 in response
to the Feb 21, 2013 ALJ ruling, which compares event day forecasts (daily forecast or day‐ahead
forecast) to the event day ex‐post load reduction estimates. Detailed data and methodological
descriptions relevant to this chapter are provided in Appendices C and G. Subsequent to its
March 4 filing, SCE updated its ex‐post results for some of the DR program events in its April 2
Load Impact Report but did not update its March 4 filing accordingly. However, in most cases,
the April 2, 2013 updated ex‐post results are even lower than the March 4 preliminary data, e.g.,
the AC cycling. Therefore, if the updated data was used, it would further support staff’s
findings.
9 SCE‐03 and SGE‐03.
On average, the ex‐post results for all program events diverge from the daily forecast by a
considerable degree. While some program events were forecasted more accurately and
consistently than others, Energy Division staff’s overall conclusion is that the daily forecasting
methods for all programs requires meaningful and immediate improvements in order for the
day‐ahead forecasting can become an effective and reliable tool for grid operators.
Some of the divergence between the ex‐post results and the daily forecast estimates can
possibly be explained by inadequate program design and program operations. This section
focuses on the observed differences between the ex‐post and the daily forecast with an eye
towards identifying improvements for day ahead forecasting, and thus does not cover all
potential program improvements. Furthermore, many program design and operational
improvements that could lead to better ex‐post results may not be evident by simply inspecting
the daily forecast and ex‐post data.
The ex‐post analysis methods are guided by Commission adopted load impact protocols10
and the study results are carefully documented in reports prepared by independent consultants
managed by SCE staff. However, there are currently no comparable standards and processes
guiding the methods for daily forecasting. Indeed, during the course of preparing this report,
Energy Division staff became aware that the day‐ahead forecasting methods are far from
transparent, and in some cases lack the robust analysis that is expected of the Utilities. These
problems may be somewhat understandable, however, since the daily reports were only
formally instituted in 2012.
While this report is highly critical of the implementation of the day‐ahead forecasting, it is
important to recognize that the 2012 DR events as a whole did indeed reduce participants loads,
and some of the program load reductions were consistent with or better than the day‐ahead
forecast. To that end, staff has categorized the demand response programs into three
categories (good, mixed, and poor performance) based on how well the program events
performed relative to the day‐ahead forecasts. SCE
Programs that performed well yielded load impacts that were consistent with or better than
the day‐ahead forecast. The Base Interruptible Program (BIP) and the Day‐of Capacity Bidding
Program events produced load reductions that were on par with the forecasts. It is worth
noting that BIP, the single largest program, was triggered on only one occasion in 2012 however,
and this was test event.
Program events with mixed performance were not consistent with the day‐ahead
forecast, but sometimes exceeded the forecast. Staff includes the Day‐ahead Capacity Bidding,
Demand Bidding, and the Residential Summer Discount Plan program events in this category
because these program events did indeed occasionally exceed the day‐ahead forecasts by a
significant margin. These programs are discussed in greater detail elsewhere in this section and
report. While considered to be mid‐performing programs, they do have many important issues
that deserve attention.
10 Decision 08‐04‐050
Program events that were consistently below the forecast are considered to be poor
performing programs. All of the Critical Peak Pricing, Peak Time Rebate, Demand Response
Contracts, Commercial Summer Discount Plan, and Agricultural Pumping Interruptible program
events triggered during 2012 produced load reductions that were lower than forecasted. Table 2: SCE’s DR Overall Performance
Programs
No. of DR Events
Daily Forecast Ex‐Post Difference %
Good Performance:
Capacity Bidding Program – Day of 14 12 16 >2 >17%
Base Interruptible Program 1 514 573 59 12%
Mixed Performance:
Capacity Bidding Program – Day Ahead 12 0.08 0.03 ‐0.29 to 0.08 ‐315% to 86%
Demand Bidding Program 8 84 76 ‐33 to 16 ‐40% to 21%
Summer Discount Plan (AC Cycling) ‐ Res. 23 280 184 ‐603 to 92 ‐100% to 58%
Poor Performance:
Critical Peak Pricing 12 50 37 < ‐5 < ‐11%
Peak Time Rebate 7 108 20 < ‐11 < ‐11%
Demand Response Contracts 3 230 148 < ‐70 < ‐34%
Summer Discount Plan (AC Cycling) ‐ Com. 2 5 3 ‐2 ‐35%
Agricultural Pumping Interruptible 2 48 21 < ‐19 < ‐52%
(Averaged MW over All Events) (Range from Low to High)
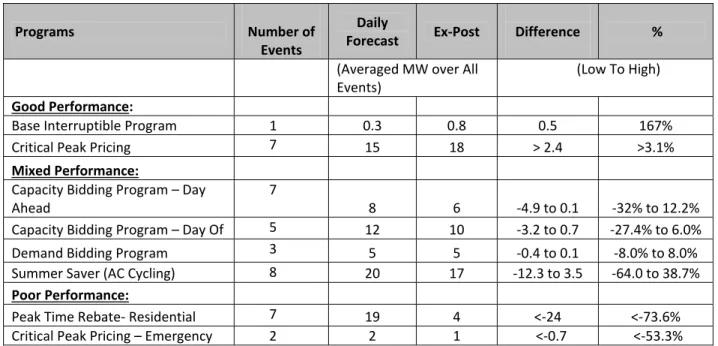
SDG&E
Utilizing the same criteria for evaluating SCE DR programs, The Base Interruptible Program
and the Critical Peak Pricing Program were categorized as good performers, the Capacity
Bidding Day‐Ahead, Capacity Bidding Day‐Of, Demand Bidding, and Summer Saver (AC Cycling)
were categorized as mixed performers, and the Critical Peak Pricing‐Emergency and residential
Peak Time Rebate programs were categorized as poor performers. As stated above, DR
program design and operation characteristics also need to be taken into account for a complete
Table 3: SDG&E’s DR Overall Performance
B. Program Performance During Critical Event Days
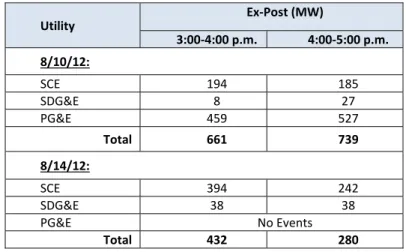
The critical event days of August 10th, 13th, 14th, and September 14th were selected as a
focus because they occurred on Flex Alert days, the service area system peak day, or the
hottest days of the year. These are all conditions when demand response resources are most
critical.
August 10, 2012
SCE
Two SCE programs were called on August 10th, a Flex Alert day. The programs triggered
during that event were the Demand Bidding Program and the Save Power Day (also known as
the Peak Time Rebate program). The load reductions achieved during the Demand Bidding
Program event surpassed the forecast by 12%, while the Save Power Day event was below the
forecast by 11%.
Table 4: SCE’s August 10, 2012 Demand Response Events
Program Name Daily Forecast MW Ex‐Post MW Difference Forecast & Ex‐Post MW % Difference Forecast & Ex‐Post A B C=B‐A D=C/A
Demand Bidding Program 85.59 95.82 10.23 11.95%
Save Power Day 107.2411 95.85 ‐11.39 ‐10.62%
Total 192.83 191.67 ‐1.16 11 SCE did not provide a daily forecast for this event, so the comparison for this event is done with the 7‐day report rather than the daily forecast. Programs Number of Events Daily Forecast Ex‐Post Difference % (Averaged MW over All Events) (Low To High) Good Performance: Base Interruptible Program 1 0.3 0.8 0.5 167% Critical Peak Pricing 7 15 18 > 2.4 >3.1% Mixed Performance: Capacity Bidding Program – Day Ahead 7 8 6 ‐4.9 to 0.1 ‐32% to 12.2%
Capacity Bidding Program – Day Of 5 12 10 ‐3.2 to 0.7 ‐27.4% to 6.0% Demand Bidding Program 3 5 5 ‐0.4 to 0.1 ‐8.0% to 8.0% Summer Saver (AC Cycling) 8 20 17 ‐12.3 to 3.5 ‐64.0 to 38.7%
Poor Performance:
Peak Time Rebate‐ Residential 7 19 4 <‐24 <‐73.6% Critical Peak Pricing – Emergency 2 2 1 <‐0.7 <‐53.3%
SDG&E
Three DR programs were called on August 10th. The Capacity Bidding Day Ahead program
load reduction exceeded the forecast by 1%. Conversely, the Summer Saver and residential
Peak Time Rebate forecasts under predicted the forecast by 32% and 75%. Table 5: SDG&E August 10, 2012 Demand Response Events
Program Name Daily Forecast MW Ex‐Post MW Difference Forecast & Ex‐ Post MW % Difference Forecast & Ex‐Post A B C = B‐A D=C/A
Capacity Bidding ‐ Day Ahead 7.50 7.60 0.10 1.33%
Summer Saver (AC Cycling) 27.20 18.50 ‐8.70 ‐32.00%
Residential Peak Time Rebate 12.60 3.20 ‐9.40 ‐74.60%
Total 47.30 29.30 ‐18.00
August 13, 2012
SCE
August 13, 2012 was the system peak day for the SCE service area, with a peak load of
22,428 MW. As shown in Table 6 below, the Critical Peak Pricing program, a dynamic pricing
program for commercial and industrial customers over 200 kW, and the Day‐Of Capacity
Bidding Program were triggered during this day. Again, the Capacity Bidding Programs
exceeded the forecast by a few MW. The Critical Peak Pricing program event had satisfactory
performance, falling short of the forecast by 15%. Table 6: SCE’s August 13, 2012 Demand Response Events
Program Name Daily Forecast MW Ex‐Post MW Difference Forecast & Ex‐Post MW % Difference Forecast & Ex‐Post A B C=B‐A D=C/A
Critical Peak Pricing 50.54 42.96 ‐7.58 ‐15.00%
Capacity Bidding Program (Day Of) 12.30 15.70 3.40 27.60%
Total 62.84 58.66 ‐4.18
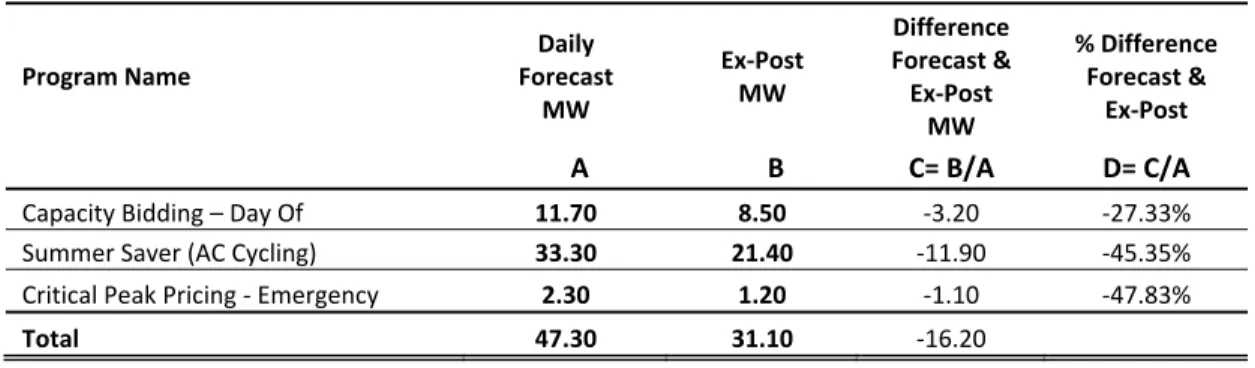
SDG&E
All three DR programs that were triggered on August 13th, Capacity Bidding Day Of,
Summer Saver (AC Cycling), and Critical Peak Pricing, had ex‐post load impacts that were
respectively below daily forecast predictions by 27%, 45%, and 48%.
Table 7: SDG&E’s August 13, 2012 Demand Response Events Program Name Daily Forecast MW Ex‐Post MW Difference Forecast & Ex‐Post MW % Difference Forecast & Ex‐Post A B C= B/A D= C/A
Capacity Bidding – Day Of 11.70 8.50 ‐3.20 ‐27.33%
Summer Saver (AC Cycling) 33.30 21.40 ‐11.90 ‐45.35%
Critical Peak Pricing ‐ Emergency 2.30 1.20 ‐1.10 ‐47.83%
Total 47.30 31.10 ‐16.20
August 14, 2012
SCE
August 14, 2012 was another Flex Alert day, during which seven events were called, using a
variety of DR programs. As shown in Table 8 below, all the events combined were forecasted to
reduce loads by 570 MW. However, the ex‐post load impact evaluations found that the actual
load reductions were short of the total forecast by 155 MW. 60% of the 155 MW shortfall is
attributed to the Demand Response Contract program. The Agriculture Pumping Interruptible
program event was short of the event forecast by 52%. Only the Capacity Bidding Program
exceeded the forecasted load reduction, but this only made up 4% of the Demand Response
Contract program forecast, and thus was insufficient to cover the overall event‐day shortfall. It
is worth noting that the Demand Response Contract and Capacity Bidding Programs share
something in common in that they are both commercial aggregator programs. The reason for
the difference in performance between these programs requires further study. It should be
noted that SCE’s Demand Response Contracts expired on December 31, 2012 and have since
been replaced by new contracts that that expire at the end of 2014.12 Table 8: SCE’s August 14, 2012 Demand Response Events
Program Name Daily Forecast MW Ex‐Post MW Difference Forecast & Ex‐Post MW % Difference Forecast & Ex‐Post A B C=B‐A D=C/A
Demand Response Contracts 275.00 182.05 ‐92.95 ‐33.80%
Demand Bidding Program 94.09 61.76 ‐32.33 ‐34.36%
Agriculture Pumping Interruptible 36.00 17.29 ‐18.72 ‐51.99%
Summer Discount Plan (Res) Group 1 130.40 119.40 ‐11.00 ‐8.44%
Capacity Bidding Program (Day Of) 12.30 17.82 5.52 44.86%
Summer Discount Plan (Res) Reliability 17.42 13.50 ‐3.92 ‐22.49%
Summer Discount Plan (Com) 4.77 3.10 ‐1.67 ‐35.04%
Total 569.98 414.91 ‐155.07
SDG&E
Four DR programs, Demand Bidding, Critical Peak Pricing, Capacity Bidding Day Ahead,
and residential Peak Time Rebate, were called on August 14th. While the Demand Bidding and
Capacity Bidding Program ex‐post load impacts closely matched the daily forecast, the Critical
Peak Pricing and residential Peak Time Rebate did not. Since the Critical Peak Pricing and
residential Peak Time Rebate programs are large scale residential programs it is possible that
the difference between the forecast and ex‐post load impacts reflect widely varying customer
behavior during DR events.
Table 9: SDG&E’s August 14, 2012 Demand Response Events
Program Name Daily Forecast MW Ex‐Post MW Difference Forecast & Ex‐Post MW % Difference Forecast & Ex‐Post A B C=B‐A D=C/A
Demand Bidding Program 5.00 5.10 0.10 2.00%
Critical Peak Pricing 14.30 25.90 11.60 81.12%
Capacity Bidding Program (Day Ahead) 7.50 7.50 0.00 0.00%
Residential Peak Time Rebate 12.50 1.10 ‐11.40 ‐91.20%
Total 39.30 39.60 0.30
September 14, 2012
SCE
September 14, 2012 was the hottest day of the year in both the SCE and SDG&E service
areas (see Table 10 below). Understandably, SCE triggered their Summer Discount Plan
(residential AC Cycling Programs) during this day. The Capacity Bidding Program was also
triggered, with performance comparable to the other Capacity Bidding Program events on
critical days discussed above.
The September 14 residential Summer Discount Plan events consisted of three separate
customer groups sequentially triggered for one hour events. All three one‐hour events fell
considerably short of the forecasted load reductions. Table 10: SCE’s September 14, 2012 Demand Response Events
Program Name Daily Forecast MW Ex‐Post MW Difference Forecast & Ex‐Post MW % Difference Forecast & Ex‐Post A B C=B‐A D=C/A
Summer Discount Plan (Residential)
Groups 5 and 6 135.61 20.70 ‐114.91 ‐84.74%
Summer Discount Plan (Residential) Groups 1 and 2 110.89 37.80 ‐73.09 ‐65.91%
Capacity Bidding Program (Day Of) 11.90 16.21 4.31 36.18%
Summer Discount Plan (Residential) Groups 3 and 4 99.32 17.80 ‐81.52 ‐82.08%
SDG&E
On September 14, 2012, the peak temperature in SDG&E’s service territory was 109
degrees. The Demand Bidding, Summer Saver, and Base Interruptible Programs ex‐post load
impacts were above the daily forecast in a range between 8% and 167%. Since the absolute
value of the Base Interruptible Program load impact is ~ 1 MW, a small increase or decrease in
the daily forecast prediction can result in high variability in the percent difference between
these two figures. Conversely, the Capacity Bidding Day‐Of and Day‐Ahead Programs and the
Critical Peak Pricing Emergency Program daily forecasts were below the daily forecast in a range
between 12% and 44%.
Table 11: SDG&E’s September 14, 2012 Demand Response Events
C. Detailed Program Analysis
The following section discusses programs and events that produced load reductions
forecasted by the daily reports, as well as programs that failed to produce the forecasted load
reductions. For this purpose, all programs and events that came within 10% (+/‐) of the
forecasted load reductions are considered to be consistent with the daily forecast and all
programs and events that were more or less than 50% of the forecasted load reductions are
considered to have failed to produce the forecasted load reductions. SCE
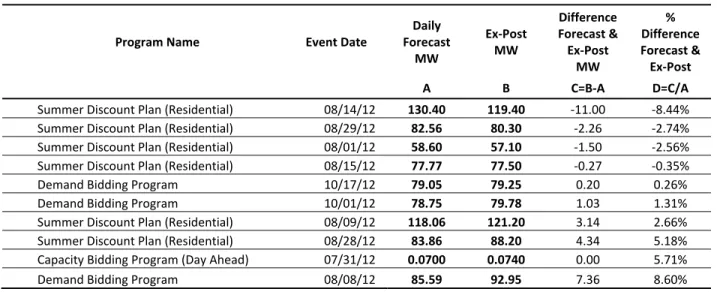
There were a total of 104 separate events in the SCE service area in 2012. Only ten of these
events produced the load reductions consistent with those forecasted in the daily reports. As
shown in Table 12 below, all of these events produced fairly sizable load reductions, ranging
from 59 to 130 MW, with the exception of one Capacity Bidding Program event, which
produced a very small load reduction. Program Name Daily Forecast MW Ex‐Post MW Difference Forecast & Ex‐Post MW % Difference Forecast & Ex‐Post A B C=B‐A D=C/A
Capacity Bidding Program (Day Of) 9.00 5.70 ‐3.30 ‐36.67%
Capacity Bidding Program (Day Ahead) 12.10 10.60 ‐1.50 ‐12.40%
Demand Bidding Program 5.00 5.40 0.40 8.00%
Summer Saver (AC Cycling) 15.50 22.50 7.00 45.16%
Base Interruptible Program 0.30 0.80 0.50 166.70%
Critical Peak Pricing ‐ Emergency 1.60 0.90 ‐0.70 ‐43.75%
Table 12: SCE’s DR Events with Ex‐Post Results within 10% of the Daily Forecast
Program Name Event Date
Daily Forecast MW Ex‐Post MW Difference Forecast & Ex‐Post MW % Difference Forecast & Ex‐Post A B C=B‐A D=C/A
Summer Discount Plan (Residential) 08/14/12 130.40 119.40 ‐11.00 ‐8.44%
Summer Discount Plan (Residential) 08/29/12 82.56 80.30 ‐2.26 ‐2.74%
Summer Discount Plan (Residential) 08/01/12 58.60 57.10 ‐1.50 ‐2.56%
Summer Discount Plan (Residential) 08/15/12 77.77 77.50 ‐0.27 ‐0.35%
Demand Bidding Program 10/17/12 79.05 79.25 0.20 0.26%
Demand Bidding Program 10/01/12 78.75 79.78 1.03 1.31%
Summer Discount Plan (Residential) 08/09/12 118.06 121.20 3.14 2.66%
Summer Discount Plan (Residential) 08/28/12 83.86 88.20 4.34 5.18%
Capacity Bidding Program (Day Ahead) 07/31/12 0.0700 0.0740 0.00 5.71%
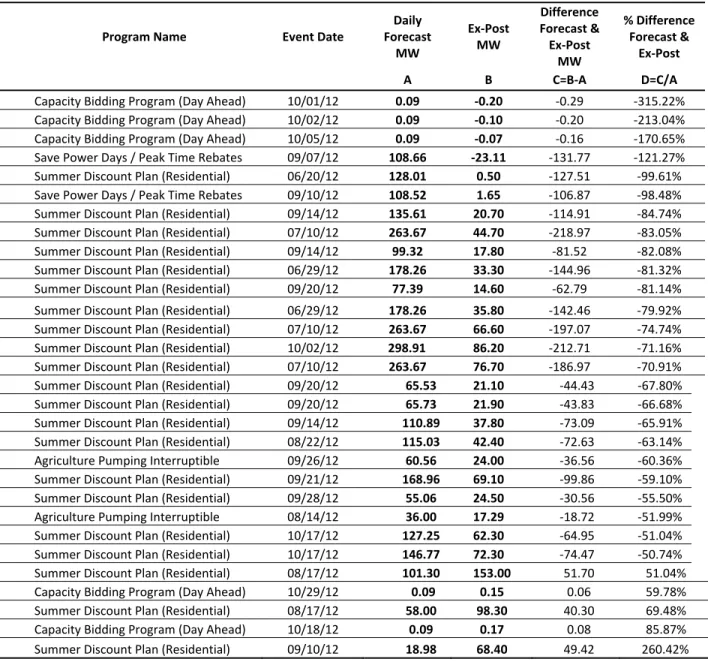
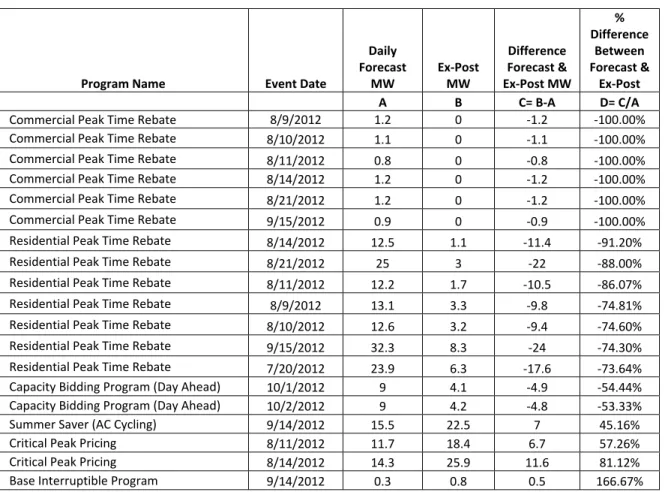
Demand Bidding Program 08/08/12 85.59 92.95 7.36 8.60% Of the 104 events in 2012, thirty (or about 29%) of the events were more than 50% off of
the day‐ahead forecast. Five of these events produced load reductions that were greater than
the forecast, while the remaining 25 were lower than the forecast. The three events with the
highest percentage difference below the forecast were very small Day‐Ahead Capacity Bidding
Program events, and thus are not considered the most critical problem. Twenty‐one of the
remaining events were Summer Discount Plan (AC Cycling) events, and these varied markedly
Table 13: SCE’s DR Events with Ex‐Post Results greater than + 50% of the Daily Forecast
Program Name Event Date
Daily Forecast MW Ex‐Post MW Difference Forecast & Ex‐Post MW % Difference Forecast & Ex‐Post A B C=B‐A D=C/A
Capacity Bidding Program (Day Ahead) 10/01/12 0.09 ‐0.20 ‐0.29 ‐315.22%
Capacity Bidding Program (Day Ahead) 10/02/12 0.09 ‐0.10 ‐0.20 ‐213.04%
Capacity Bidding Program (Day Ahead) 10/05/12 0.09 ‐0.07 ‐0.16 ‐170.65%
Save Power Days / Peak Time Rebates 09/07/12 108.66 ‐23.11 ‐131.77 ‐121.27%
Summer Discount Plan (Residential) 06/20/12 128.01 0.50 ‐127.51 ‐99.61%
Save Power Days / Peak Time Rebates 09/10/12 108.52 1.65 ‐106.87 ‐98.48%
Summer Discount Plan (Residential) 09/14/12 135.61 20.70 ‐114.91 ‐84.74%
Summer Discount Plan (Residential) 07/10/12 263.67 44.70 ‐218.97 ‐83.05%
Summer Discount Plan (Residential) 09/14/12 99.32 17.80 ‐81.52 ‐82.08%
Summer Discount Plan (Residential) 06/29/12 178.26 33.30 ‐144.96 ‐81.32%
Summer Discount Plan (Residential) 09/20/12 77.39 14.60 ‐62.79 ‐81.14%
Summer Discount Plan (Residential) 06/29/12 178.26 35.80 ‐142.46 ‐79.92%
Summer Discount Plan (Residential) 07/10/12 263.67 66.60 ‐197.07 ‐74.74%
Summer Discount Plan (Residential) 10/02/12 298.91 86.20 ‐212.71 ‐71.16%
Summer Discount Plan (Residential) 07/10/12 263.67 76.70 ‐186.97 ‐70.91%
Summer Discount Plan (Residential) 09/20/12 65.53 21.10 ‐44.43 ‐67.80%
Summer Discount Plan (Residential) 09/20/12 65.73 21.90 ‐43.83 ‐66.68%
Summer Discount Plan (Residential) 09/14/12 110.89 37.80 ‐73.09 ‐65.91%
Summer Discount Plan (Residential) 08/22/12 115.03 42.40 ‐72.63 ‐63.14%
Agriculture Pumping Interruptible 09/26/12 60.56 24.00 ‐36.56 ‐60.36%
Summer Discount Plan (Residential) 09/21/12 168.96 69.10 ‐99.86 ‐59.10%
Summer Discount Plan (Residential) 09/28/12 55.06 24.50 ‐30.56 ‐55.50%
Agriculture Pumping Interruptible 08/14/12 36.00 17.29 ‐18.72 ‐51.99%
Summer Discount Plan (Residential) 10/17/12 127.25 62.30 ‐64.95 ‐51.04%
Summer Discount Plan (Residential) 10/17/12 146.77 72.30 ‐74.47 ‐50.74%
Summer Discount Plan (Residential) 08/17/12 101.30 153.00 51.70 51.04%
Capacity Bidding Program (Day Ahead) 10/29/12 0.09 0.15 0.06 59.78%
Summer Discount Plan (Residential) 08/17/12 58.00 98.30 40.30 69.48%
Capacity Bidding Program (Day Ahead) 10/18/12 0.09 0.17 0.08 85.87%
Summer Discount Plan (Residential) 09/10/12 18.98 68.40 49.42 260.42% Summer Discount Plan
The Summer Discount Plan event variability ranges from 121% below the forecast (with a
load increase rather than a load reduction) to 260% above the forecast. Overall, the AC Cycling
program represents the most variance13
of all the SCE DR programs. When all of the variances
for individual events are aggregated, the AC Cycling program represents 49% of the total
variance. The Pearson Product‐Moment Correlation between the daily forecast and the ex‐post
load impacts is 0.21, representing a very weak positive correlation.
13 Variance in this context specifically refers to the absolute difference between the daily forecast and the event
The Pearson correlation between the average event temperature14 and the event level
variance (difference between the daily forecast and the event day ex‐post load reductions) is
0.37, representing a moderately weak correlation. In everyday language this means that SCE’s
2012 Summer Discount Plan forecast method cannot be relied upon to effectively predict the
actual program load reductions. In addition, there appears to be little relationship between the
event day temperature and the difference between the daily forecast and the event day ex‐
post load reductions, potentially ruling out temperature as an explanatory factor for the
difference.
The Summer Discount Plan was (by far) the most often triggered program in SCE’s 2012 DR
portfolio. There were 23 separate events, including two early test events15. Most of the 23
events were split into 3 customer segments such that each group of customers was triggered
for only a portion (i.e. one hour) of each event (typically lasting three hours). Three events on
9/14, 9/20, and 9/28 deployed 6 customer segmentations. SCE operated the program in this
manner to avoid cycling their customers’ air‐conditioners for more than one hour at a time16.
The purpose of this strategy is so customers will be minimally impacted by the loss of one hour
of AC services, compared to multiple continuous hours, and in theory the utility would still be
able to reduce load when needed.
As shown in Table 14 below, the implementation of this strategy, however, resulted in a
rebound effect from the groups curtailed in event hours 1 & 2 that added load in hours 2 & 3 as
AC units ran at above normal capacity to return the participants’ buildings to the original
temperature set points17. The net effect was to dampen the average hourly load impact for the
entire event period, as illustrated in Table 14. It is possible that the daily forecasts were
prepared assuming that all customers would be curtailed at the same time over the entire
duration of the event. In such a case, the average hourly load reductions would likely have
been larger because all customers would be simultaneously curtailed and the rebound effect
would be delayed until after the event was over. This issue is further illustrated in Chapter 2,
Section IV “Comparison of the 2012 Ex‐Post to the 2012 Resource Adequacy (RA)”. Table 14: SCE’s Hourly Load Impact from a Sept 14 Summer Discount Plan event
Event Hour
Ending:
Event Hours w/ Rebound Post Event Rebound Event Hour Average 16 17 18 19 20 15 39.6 ‐25.1 ‐17.0 16 27.1 ‐27.0 ‐39.6 17 21.3 ‐49.6 ‐37.8 Hour Total 39.6 2.0 ‐22.7 ‐89.2 ‐37.8 6.3 14 SCE Final 2012 Ex Post Ex Ante Load Impacts for SCEs SDP filed in R.07‐01‐041 on April 2, 2013. 15 The last two events in late October were not included in the ex‐post analysis. 16 SCE‐01 Testimony at 11. 17 SCE Final 2012 Ex Post Ex Ante Load Impacts for SCEs SDP filed in R.07‐01‐041 on April 2, 2013.
Another potential explanation for the suboptimal performance could be customers
exercising the override option in their enrollment contracts with SCE. However, SCE’s A.12‐12‐
016 testimony18 indicates that the proportion of customers with an override option is fairly
small (consisting of about 1% of the customers enrolled in SDP) and that these customers rarely
exercise the override option. Finally, it is possible that transitioning Summer Discount Plan
from an emergency program to a price‐responsive program could have introduced some
additional uncertainties that aren’t adequately captured by the current forecasting methods.
Regardless of the explanation for the unexpectedly low load reductions during these events, it
is critical that SCE improve the day‐ahead forecast for the SDP program as a whole.
Energy Division staff reviewed SCE’s method for forecasting the Summer Discount Plan
program.19 The methodology, provided in Appendix C, is described in a 1986 internal SCE
memorandum and consists of a simple algorithm which estimates the load reduction per ton of
AC based on the forecasted temperature. The equation coefficients were determined by a
1985 load reduction study that SCE staff could not locate when requested to do so by Energy
Division staff. Without the 1985 load reduction study Energy Division staff could not fully
evaluate the forecasting methodology. SCE did provide a revised algorithm which modifies the
equation structure. But the underlying methods for estimating those coefficients as yet remain
unexplained.
This evidence suggests that there is a critical flaw in either the way the Summer Discount
Plan events are forecasted or in the operation of the program, or both. The lack of a reliable
day‐ahead forecasting method is a major weakness that undermines the ability to fully consider
AC Cycling in the CAISO grid operations. Even if the utilities’ DR resources are eventually to be
bid into the CAISO market, which currently are not, ED recommends that SCE immediately
document the forecasting methods to be used for the 2013 season and thoroughly vet the
methods with CPUC and CAISO staff and relevant stakeholders to ensure the proposed
forecasting methods are reasonable and reliable. Throughout the 2013 summer season (and
longer if necessary), SCE should consider piloting more than one forecasting method which
should be tested using small ex‐post load impact evaluations to identify the most reliable
forecasting methods.
Base Interruptible Program
The Base Interruptible Program was triggered only once during the entire 2012 season and
this was a test event. This single event produced 573 MW of load reductions on September 26.
The load reductions for this event were 59 MW more than the day‐ahead forecast. It is worth
noting that the single Base Interruptible event was more than three times the load reduction of
any other SCE program event during 2012, and it was not triggered on one of the critical event
days discussed earlier in this section.
The Commission should explore a policy requiring more frequent deployments of this
program since it appears to have significant, yet underutilized, potential.
18 SCE‐01 Testimony at 11, Lines 3‐5. 19 See Appendix S.
Capacity Bidding Program
The Capacity Bidding Program Day‐Ahead events produced an average load reduction of
0.03 MW across all events. With the exception of three events in October (that were
associated with negative load reductions in the ex‐post analysis) most events produced
relatively small load reductions forecasted by the daily report. None of the Capacity Bidding
Program day‐ahead events occurred in August and September when the load reductions are
typically most needed.
By comparison, all of SCE’s Capacity Bidding Program Day‐Of events exceeded the
forecasted load reductions, by an average of 32%. The average load reduction for the Capacity
Bidding Program Day‐Of events was 15.9 MW, over 500 times the load reductions produced by
Day‐Ahead events.
This evidence suggests that, unlike the Day‐Of program, the Day Ahead Capacity Bidding
Program may not be serving a useful function in SCE’s DR portfolio.
Demand Bidding Program
The Demand Bidding contracts were called on eight occasions during the summer of 2012.
Of these eight events, five occurred in August. The first two August events on August 8 and
August 10 resulted in load reductions that exceeded the daily forecast by an average of 10%.
The third and fourth events on August 14 and August 16 were 34% short of the forecasted load
reductions and the fifth event on August 29 was 40% below forecast, suggesting that perhaps a
decline in customer participation in events could be explored as a potential factor in
diminishing returns.
Demand Response Contracts (DRC) – Nominated
Somewhat surprisingly, there were only two events for which Demand Response Contracts
were called. The ex‐ post load reductions for these two events were both around 35% below
the daily forecast. Energy Division was not able to examine why this program performed so
poorly. As noted earlier, SCE’s DRCs expired on December 31, 2012, and have since been
replaced by new contracts approved by the Commission.
Save Power Days / Peak Time Rebates (PTR) – Price Responsive
Daily forecasts were not provided by SCE for the four PTR events that occurred in August,
thus comparisons between the daily forecast and ex‐post results are possible for only the two
events on September 7 and September 10. Both of the September events were forecasted to
reduce loads by 109 MW. Ex‐post results, however, indicate that the PTR events had no impact
at all. In fact, the September 7 event was correlated with a fairly significant load increase of
23.11 MW.
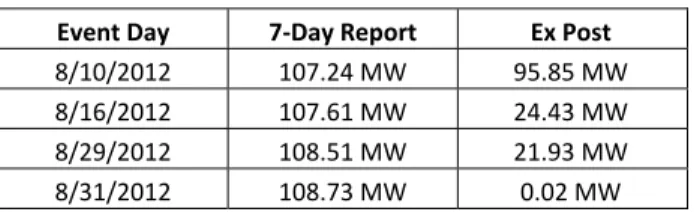
Ex‐post load reductions were estimated for the four August PTR events, for which day‐
ahead estimates were not provided by SCE. As a proxy for the daily forecast the 7‐day reports
were used. As shown in Table 15 below, estimated load reductions were between 107 and 108,
while the ex‐post load reductions ranged between 0.02 and 96 MW.