University of Dundee
How many biological replicates are needed in an RNA-seq experiment and which
differential expression tool should you use?
Schurch, Nicholas J; Schofield, Pietá; Gierliski, Marek; Cole, Christian; Sherstnev, Alexander;
Singh, Vijender; Wrobel, Nicola; Gharbi, Karim; Simpson, Gordon G; Owen-Hughes, Tom;
Blaxter, Mark; Barton, Geoffrey J
Published in:
RNA: a Publication of the RNA Society
DOI:
10.1261/rna.053959.115
Publication date: 2016
Document Version
Publisher's PDF, also known as Version of record
Link to publication in Discovery Research Portal
Citation for published version (APA):
Schurch, N. J., Schofield, P., Gierliski, M., Cole, C., Sherstnev, A., Singh, V., ... Barton, G. J. (2016). How many biological replicates are needed in an RNA-seq experiment and which differential expression tool should you use? RNA: a Publication of the RNA Society, 22(6), 839-51. DOI: 10.1261/rna.053959.115
General rights
Copyright and moral rights for the publications made accessible in Discovery Research Portal are retained by the authors and/or other copyright owners and it is a condition of accessing publications that users recognise and abide by the legal requirements associated with these rights.
• Users may download and print one copy of any publication from Discovery Research Portal for the purpose of private study or research. • You may not further distribute the material or use it for any profit-making activity or commercial gain.
How many biological replicates are needed in an RNA-seq
experiment and which differential expression tool should
you use?
NICHOLAS J. SCHURCH,1,6PIETÀ SCHOFIELD,1,2,6MAREK GIERLIN´SKI,1,2,6CHRISTIAN COLE,1,6 ALEXANDER SHERSTNEV,1,6VIJENDER SINGH,2NICOLA WROBEL,3KARIM GHARBI,3
GORDON G. SIMPSON,4TOM OWEN-HUGHES,2MARK BLAXTER,3and GEOFFREY J. BARTON1,2,5 1Division of Computational Biology, College of Life Sciences, University of Dundee, Dundee DD1 5EH, United Kingdom 2
Division of Gene Regulation and Expression, College of Life Sciences, University of Dundee, Dundee DD1 5EH, United Kingdom 3Edinburgh Genomics, University of Edinburgh, Edinburgh EH9 3JT, United Kingdom
4
Division of Plant Sciences, College of Life Sciences, University of Dundee, Dundee DD1 5EH, United Kingdom
5Division of Biological Chemistry and Drug Discovery, College of Life Sciences, University of Dundee, Dundee DD1 5EH, United Kingdom
ABSTRACT
RNA-seq is now the technology of choice for genome-wide differential gene expression experiments, but it is not clear how many biological replicates are needed to ensure valid biological interpretation of the results or which statistical tools are best for analyzing the data. An RNA-seq experiment with 48 biological replicates in each of two conditions was performed to answer these questions and provide guidelines for experimental design. With three biological replicates, nine of the 11 tools evaluated found only 20%–40% of the significantly differentially expressed (SDE) genes identified with the full set of 42 clean replicates. This rises to >85% for the subset of SDE genes changing in expression by more than fourfold. To achieve >85% for all SDE genes regardless of fold change requires more than 20 biological replicates. The same nine tools successfully control their false discovery rate at ≲5% for all numbers of replicates, while the remaining two tools fail to control their FDR adequately, particularly for low numbers of replicates. For future RNA-seq experiments, these results suggest that at least six biological replicates should be used, rising to at least 12 when it is important to identify SDE genes for all fold changes. If fewer than 12 replicates are used, a superior combination of true positive and false positive performances makesedgeRandDESeq2the leading tools. For higher replicate numbers, minimizing false positives is more important andDESeq marginally outperforms the other tools.
Keywords: RNA-seq; benchmarking; differential expression; replication; yeast; experimental design; statistical power
INTRODUCTION
RNA-seq has now supplanted microarrays as the technology of choice for genome-wide differential gene expression (DGE) experiments. In any experimental design, selecting the appropriate number of biological replicates is a trade-off between cost and precision. For microarray methods it has been shown that low replicate experiments often have in-sufficient statistical power to call DGE correctly (Pan et al. 2002) and cannot accurately measure the natural biological variability (Churchill 2002). Although it is widely appreciated that increasing the number of replicates in an RNA-seq ex-periment usually leads to more robust results (Auer and
Doerge 2010; Hansen et al. 2011; Busby et al. 2013; Liu et al. 2014), the precise relationship between replicate num-ber and the ability to correctly identify the differentially ex-pressed genes (i.e., the statistical power of the experiment) has not been fully explored.
The rise of RNA-seq technology has led to the develop-ment of many tools for analyzing DGE from these data (e.g., Anders and Huber 2010; Hardcastle and Kelly 2010; Robinson et al. 2010; Wang et al. 2010; Tarazona et al. 2011; Li et al. 2012; Lund et al. 2012; Trapnell et al. 2012; Leng et al. 2013; Li and Tibshirani 2013; Frazee et al. 2014; Law et al. 2014; Love et al. 2014; Moulos and Hatzis 2015). Each tool makes assumptions about the statistical properties inherent to RNA-seq data and they exploit a range of normal-ization and analysis techniques to compute the magnitude of
6These authors contributed equally to this work.
Corresponding authors: [email protected], t.a.owenhughes@ dundee.ac.uk, [email protected], [email protected]
Article published online ahead of print. Article and publication date are at http://www.rnajournal.org/cgi/doi/10.1261/rna.053959.115. Freely available online through theRNAOpen Access option.
© 2016 Schurch et al. This article, published in RNA, is available under a Creative Commons License (Attribution 4.0 International), as described at http://creativecommons.org/licenses/by/4.0/.
a DGE result and estimate its significance. Several studies have generated data specifically for the purpose of testing the assumptions intrinsic to DGE methods (Marioni et al. 2008; SEQC/MAQC-III Consortium 2014), but most rely ei-ther on RNA-seq data sets designed to test biological hypoth-eses (Bullard et al. 2010; Rapaport et al. 2013; Seyednasrollah et al. 2013) or simulated data (Busby et al. 2013; Soneson 2014), or a combination of the two (Kvam et al. 2012; Li et al. 2012; Dillies et al. 2013; Guo et al. 2013; Soneson and Delorenzi 2013; Burden et al. 2014). The majority of studies based on analysis of experimental RNA-seq data rely on data from experiments with fewer than five replicates per condi-tion (Marioni et al. 2008; Bullard et al. 2010; Kvam et al. 2012; Li et al. 2012; Busby et al. 2013; Dillies et al. 2013; Rapaport et al. 2013; SEQC/MAQC-III Consortium 2014; Soneson 2014), limiting their ability to compare the perfor-mance of DGE tools as a function of replication.
Two studies explore higher replication by exploiting pub-licly available RNA-seq data from 21 individual clones of two laboratory strains of mouse (Bottomly et al. 2011; Soneson and Delorenzi 2013; Burden et al. 2014). Burden et al. (2014) consider false discovery rate (FDR) as the main metric for ranking five tools and conclude that at least six replicates per condition and multiplexing DGE tools gives the best results. Soneson and Delorenzi (2013) focus on the degree of concordance between tools as a metric for compar-ison and conclude that none of the 11 tools they tested per-form well with fewer than three replicates. Nevertheless, since the experiments are from individual mice, the data may reflect interindividual variance in RNA expression as well as from other aspects of the experimental protocol. The same is true of studies in human that make use of data from individuals to explore higher sample replication in DGE (Guo et al. 2013; Seyednasrollah et al. 2013). Guo et al. (2013) expand the replicate number by comparing six tools using RNA-seq data from breast cancer tumor-normal paired samples from 53 individuals in The Cancer Genome Atlas (TCGA, The Cancer Genome Atlas Research Network 2008), using this primarily to guide the construction of a sim-ulated data set. They conclude that all six of the tools they test suffer from oversensitivity but thatedgeRrepresents the best compromise between accuracy and speed. Seyednasrollah et al. (2013) examine the performance of eight tools using mouse data (Bottomly et al. 2011) and lymphoblastoid cell data from a cohort of 56 unrelated Nigerian individuals from the HapMap project (The International HapMap Consortium 2005). They recommendlimmaandDESeqfor data with fewer than five replicates per condition, finding thatedgeRis“oversensitive”and suffers from high variability in its results while SAMSeqsuffers from a lack of statistical power with few replicates. The idea of combining DGE meth-ods is implemented in the novel tool PANDORA, which weights the results of different DGE tools according to their performance on test data and performs at least as well as the constituent tools (Moulos and Hatzis 2015).
In this paper, the performance of DGE tools is evaluated through the first highly replicated RNA-seq experiment de-signed specifically to test both the assumptions intrinsic to RNA-seq DGE tools (Gierlin´ski et al. 2015) and to assess their performance. The paper focuses on 11 popular RNA-seq specific DGE tools (as judged by citations): baySeq,
cuffdiff,DEGSeq, DESeq, DESeq2, EBSeq, edgeR (exact and
glm modes), limma, NOISeq, PoissonSeq, and SAMSeq (see Table 1 for references) and assesses their performance as a function of replicate number and fold change. The study pro-vides general recommendations on:
How many replicates future RNA-seq experiments require to maximize the sensitivity and accuracy of DGE identifica-tion and quantificaidentifica-tion.
The most appropriate DGE tools to use to detect DE genes in RNA-seq experiments with a given number of replicates.
RESULTS
Tool-specific gold standards
RNA was sequenced from 48 biological replicate samples of
Saccharomyces cerevisiaein each of two well-studied experi-mental conditions; wild-type (WT) and a Δsnf2 mutant. Quality control and data processing steps reject several repli-cates from each condition resulting in 42 WT and 44Δsnf2
biological replicates of“clean”data totaling∼889M aligned reads (see Materials and Methods for a full description on the experiment, the mutant strain, the sequencing and the quality control and data processing steps). The data used for the performance comparison here represents a best-case scenario for the DGE tools since biological variation within conditions is low (Pearson’sR> 0.97 for all pairs of repli-cates). In contrast, the mean Pearson’s correlation (±1 SD) between replicates using the count data for four RNA-seq studies from the ReCount project (Frazee et al. 2011) show only R=0.86+0.09 −0.09 (Cheung et al. 2010), R=0.95+−00..0404 (Bottomly et al. 2011), R=0.89+0.07 −0.07 (Montgomery et al. 2010; Pickrell et al. 2010),R=0.64+0.22 −0.22(Wang et al. 2008).
The performance of each DGE tool as a function of repli-cate number and expression fold change was evaluated by comparing the DGE results from subsets of these replicates against the“gold standard”set of DGE results obtained for each tool with the full set of clean replicates. The tool-specific gold standards were computed by running the tool on the read-count-per-gene measurements from the full set of clean data and marking as“significantly differentially expressed” (SDE) those differentially expressed genes with multiple testing correctedP-values or FDRs≤0.05. These gold-stan-dard runs typically result in 60%–75% of the 7126 genes in the Ensembl v68 (Flicek et al. 2011) S. cerevisiae annota-tion being identified as SDE (except for DEGSeq, NOIseq, and PoissonSeq, which call >80% of the genes as SDE; see
With the tool-specific gold standards defined, each DGE algorithm was run iteratively on i repeated subselections drawn from the set of clean replicates (without replacement). For each of the tools, bootstrap runs were performed withi= 100 iterations andnr= 2,…,40 replicates in each condition
(cuffdiffwas significantly slower than the other tools so the number of iterations was reduced to i= 30 for this tool). For a given value of nr, the mean log2 transformed fold
change [log2(FC)] and median adjustedP-value or FDR
cal-culated across all the bootstrap iterations was considered representative of the measured behavior for each individual gene. Again, genes were marked as SDE when the adjusted
P-value or FDR was ≤0.05. From these results, true posi-tive, true negaposi-tive, false posiposi-tive, and false negative rates (hereafter TPR, TNR, FPR, FNR) were then calculated as a function of nr for four arbitrary fold-change thresholds
( log 2(FC)=T [{0,0.3,1,2}), by comparing the SDE genes from each bootstrap with the SDE genes from the tool’s gold standard (see Materials and Methods for a detailed
de-scription of these calculations). Intrinsic to this method of measuring each tool’s performance is the assumption that the large number of replicates in the full data set will enable each tool to unambiguously identify the“true”differentially expressed genes in the experiment.
Tool performance
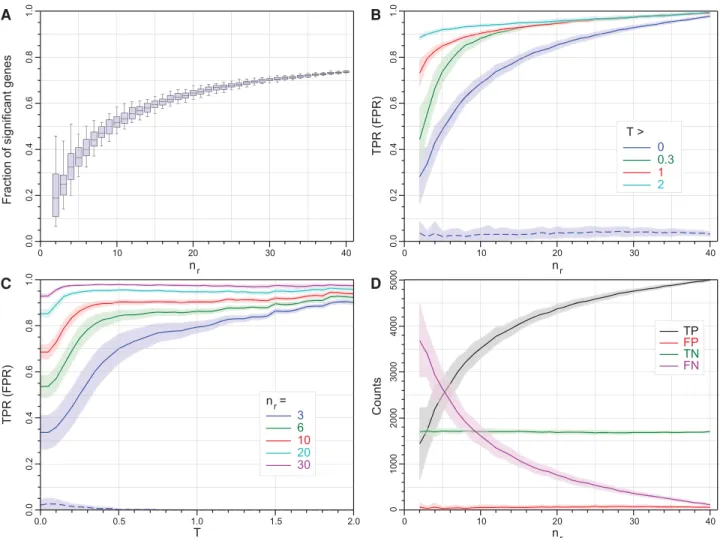
Figure 1 shows an example of the key performance data for
edgeR (exact)(similar figures for edgeR’s generalized linear model mode and the other tools can be found in
Supplemental Figs. S2–S12). The fraction of all genesedgeR
(exact) calls as SDE increases as a function ofnrand the
im-pact of sampling effects on this fraction shrinks asnrincreases
(Fig. 1A). The TPR performance changes as a function of both replicate number and fold-change threshold (Fig. 1B, C). However,edgeR (exact)successfully controls its FDR for all combinations of bothnrandTand the primary effect of
increasing the number of replicates or imposing a
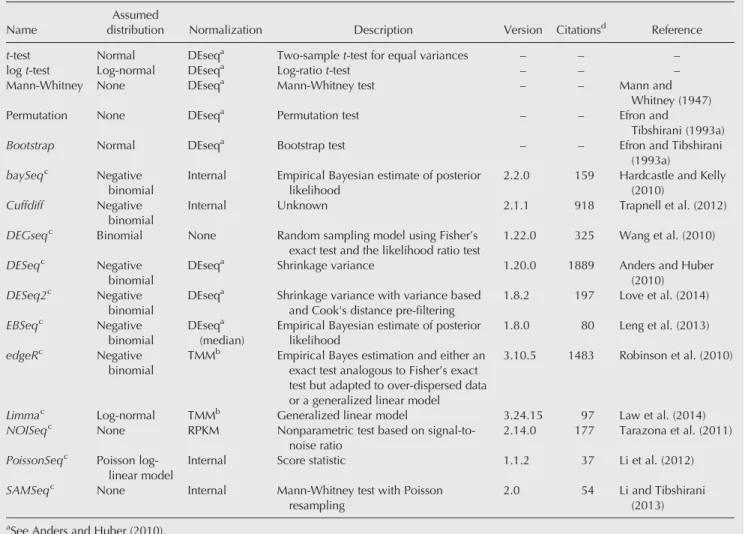
fold-TABLE 1.RNA-seq differential gene expression tools and statistical tests Name
Assumed
distribution Normalization Description Version Citationsd Reference
t-test Normal DEseqa Two-samplet-test for equal variances – – –
logt-test Log-normal DEseqa Log-ratiot-test – – –
Mann-Whitney None DEseqa Mann-Whitney test – – Mann and
Whitney (1947)
Permutation None DEseqa Permutation test – – Efron and
Tibshirani (1993a)
Bootstrap Normal DEseqa Bootstrap test – – Efron and Tibshirani
(1993a)
baySeqc Negative
binomial
Internal Empirical Bayesian estimate of posterior likelihood
2.2.0 159 Hardcastle and Kelly (2010)
Cuffdiff Negative
binomial
Internal Unknown 2.1.1 918 Trapnell et al. (2012)
DEGseqc Binomial None Random sampling model using Fisher’s
exact test and the likelihood ratio test
1.22.0 325 Wang et al. (2010)
DESeqc Negative
binomial
DEseqa Shrinkage variance 1.20.0 1889 Anders and Huber (2010)
DESeq2c Negative
binomial
DEseqa Shrinkage variance with variance based and Cook's distance pre-filtering
1.8.2 197 Love et al. (2014)
EBSeqc Negative
binomial
DEseqa (median)
Empirical Bayesian estimate of posterior likelihood
1.8.0 80 Leng et al. (2013)
edgeRc Negative
binomial
TMMb Empirical Bayes estimation and either an exact test analogous to Fisher’s exact test but adapted to over-dispersed data or a generalized linear model
3.10.5 1483 Robinson et al. (2010)
Limmac Log-normal TMMb Generalized linear model 3.24.15 97 Law et al. (2014)
NOISeqc None RPKM Nonparametric test based on
signal-to-noise ratio
2.14.0 177 Tarazona et al. (2011) PoissonSeqc Poisson
log-linear model
Internal Score statistic 1.1.2 37 Li et al. (2012)
SAMSeqc None Internal Mann-Whitney test with Poisson
resampling
2.0 54 Li and Tibshirani (2013) aSee Anders and Huber (2010).
b
See Robinson and Oshlack (2010). cR (v3.2.2) and bioconductor (v3.1). d
change threshold is to increase the sensitivity of the tool, con-verting false negatives to true positives (Fig. 1D).
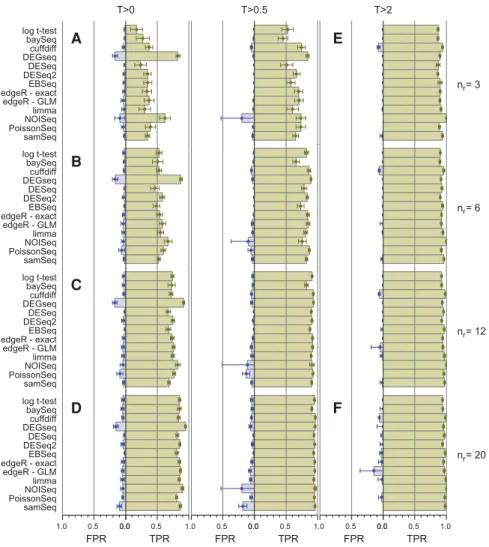
Figure 2 summarizes the performance of all 11 tools con-sidered in this study as a function of replicate number and fold-change threshold. The TPR for bootstrap subselections with three replicates and no fold-change threshold (nr= 3,
T= 0) is ∼20%–40% for all the tools except NOISeq and
DEGSeq, indicating that with this few replicates these exper-iments were unable to identify the majority of DE genes regardless of the tool used to analyze the data (Fig. 2A).
DEGSeq and NOISeq both show strong TPR performance but this is coupled with high FPRs (DEGSeq: ∼17%,
NOISeq: ∼9%). For DEGSeq in particular this originates from overestimating the number of SDE genes regardless of the number of replicates (Supplemental Fig. S4A). Excluding
DEGSeq, the TPR performance for all the remaining tools is a strong function of fold change (Fig. 1C;Supplemental Figs. S2–S12C). For the highest fold-change genes (T= 2), these tools show TPRs≳85% and with the exception of cuffdiff
also show FPRs consistent with zero (Fig. 2E). These tools are successfully capturing the majority of the true differential expression signals for the most strongly changing genes from each tool’s gold standard with as few as three replicates per condition. For this cohort of high fold-change SDE genes the TPR is largely insensitive to replicate number. Irrespec-tive of the tool, increasing the number of replicates tonr=
20 forT= 2 provides only a modest increase in TPR from
∼85% to∼95% (Figs 1B, 2F;Supplemental Figs. S2–S12B). Increasing the number of replicates has a dramatic effect on the detection rate of genes with smaller fold changes.
Fraction of significant genes
0.0 0 .2 0.4 0 .6 0.8 1 .0 0 10 20 30 40 n r A n =r 3 6 10 20 30 TPR (FPR) 0.0 0 .2 0.4 0 .6 0.8 1 .0 T 0.0 0.5 1.0 1.5 2.0 C 0 0.3 1 2 T > TPR (FPR) 0.0 0 .2 0.4 0 .6 0.8 1 .0 0 10 20 30 40 n r B TP FP TN FN 0 10 20 30 40 n r 0 1000 2000 3000 4000 Counts D 5000
FIGURE 1. Statistical properties ofedgeR (exact)as a function of|log2(FC)|threshold,T, and the number of replicates,nr. Individual data points are
not shown for clarity; however, the points comprising the lines are each an average over 100 bootstrap iterations, with the shaded regions showing the 1 SD limits. (A) The fraction of all (7126) genes called as SDE as a function of the number of replicates (boxplots show the median, quartiles and 95% limits across replicate selections within a bootstrap run). (B) Mean true positive rate (TPR) as a function of nr for four thresholds
T∈{0,0.3,1,2} (solid curves, the mean false positive rate [FPR] forT= 0 is shown as the dashed blue curve, for comparison). Data calculated for every Δnr= 1. (C) Mean TPR as a function ofTfornr∈{3,6,10,20,30} (solid curves, again the mean FPR fornr= 3 is shown as the dashed blue curve, for
comparison). Data calculated everyΔT= 0.1. (D) The number of genes called as true/false positive/negative (TP, FP, TN, and FN) as a function of nr. The FPR remains extremely low with increasingnrdemonstrating thatedgeRis excellent at controlling its false discovery rate. Data calculated for
Reducing the fold-change threshold reduces the TPR inde-pendently of replicate number for all the tools except
DEGSeq(Fig. 2A–D). The reduced TPR associated with a re-duced fold-change threshold can be recovered by increasing the replicate number. For example, achieving an ∼85% detection rate withedgeR (exact)for fold-change thresholds
ofT= 1, 0.3, and 0 requires∼9, 11, and 26 replicates, respectively (Fig. 1B,C). For all the tools except DEGSeq, the TPR performance as a function of fold-change threshold has two distinct linear regions: a shallow linear regime at
high-T and a steeper region at low-T (Fig. 1C; Supplemental Figs. S2, S3, S5– S12C). The transition between these two regions is a function of both the tool and the number of replicates. For
edgeR(exact) withnr= 3, this transition
fold-change threshold is∼0.5 and drops to ∼0.25 and ∼0.15 for nr= 10 and 30,
respectively (Fig. 1C). These transitions represent an optimal fold-change thresh-old to filter the data by, to maximize both the quality and the utility of the data.
The best performing tools, DESeq, DESeq2, EBSeq, edgeR, and limma, suc-cessfully control their FPR, maintaining it consistently close to or below 5% ir-respective of fold-change threshold or number of replicates (Figs. 1B,C, 2;
Supplemental Figs. S5, S7, S9B,C), high-lighting again that the primary effect of increasing replicate number is to increase the sensitivity of these tools, converting false negatives to true positives (Fig. 1D;
Supplemental Figs. S5, S7, S9D). Other tools are not so successful in this regard but a detailed interpretation of the FPR from this test is complicated by the fact that each tool is tested against its own gold standard. A more robust method for probing the FPR performance of DGE tools is presented below.
Tool consistency with high replicate data
The DGE tool performance tests de-scribed here assume that, given enough replicates, the tools converge on the true underlying differential expression signal in the data. This assumption was tested by clustering the DGE measurements for each tool’s “gold standard” along with the results from five additional sim-ple statistical tests applied to the same data (see Materials and Methods for a detailed description of the statistical tests). For each tool or test, a 7126-element long vector of 1s and 0s was constructed representing whether each gene in the annotation was called as SDE (adjustedP-value or FDR threshold≤0.05) by the tool or not. The vectors for each tool or test were
B C D F A E FPR TPR 0.0 0.5 0.0 0.5 1.0 T>2 FPR TPR 0.0 0.5 0.0 0.5 1.0 T>0.5 FPR TPR 0.0 0.5 1.0 0.0 0.5 1.0 T>0 samSeq PoissonSeq NOISeqlimma edgeR - GLM edgeR - exact EBSeq DESeq2 DESeq DEGseqcuffdiff baySeq log t-test n = 6r samSeq PoissonSeq NOISeq limma edgeR - GLM edgeR - exact EBSeq DESeq2 DESeq DEGseq cuffdiff baySeq log t-test n = 12r samSeq PoissonSeq NOISeq limma edgeR - GLM edgeR - exact EBSeq DESeq2DESeq DEGseq cuffdiff baySeq log t-test n = 20r samSeq PoissonSeq NOISeq limma edgeR - GLM edgeR - exactEBSeq DESeq2 DESeq DEGseq cuffdiff baySeq log t-test n = 3r
FIGURE 2. Comparison of the true positive rate (TPR) and false positive rate (FPR) performance for each of the DGE tools on low-, medium-, and highly replicated RNA-seq data (nr∈{3,6,12,20}
—rows) for three |log2(FC)| thresholds (T∈{0,0.5,2}—columns). The TPRs and FPRs for each tool are calculated by comparing the mean number of true and false positives (TPs and FPs) cal-culated over 100 bootstrap iterations to the number of TPs and FPs calcal-culated from the same tool using the full clean data set (error bars are 1 SD). Although the TPRs and FPRs from each tool are calculated by comparing each tool against itself rather than a tool-independent“gold standard” (albeit with the full clean data set), the results are comparable across tools except forDEGSeq which calls a significantly larger fraction of genes as DE for all values of T and nr
(Supplemental Fig. S4). In general, the TPR increases with increasingnr(A–D) while both the
TPR increases and the FPR decreases with increasingT(A,D,E,F). The TPR for bootstrap subse-lections with three replicates and no fold-change threshold is∼20%–40% for all the tools except NOISeqandDEGSeq(A). For the highest fold-change genes (T=2), the tools show TPRs≳85% and, with the exception of cuffdiff also show FPRs consistent with zero ([E] NOISeq and PoissonSeqproduce no FPs for the highest threshold genes and thus no FPR is shown for them). ForT= 2, increasingnrprovides only a modest increase in TPR (∼85% to∼95%)
irre-spective of the tool (EandF).PoissonSeqandBaySeqshow an increasing FPR with increasing nr(A–D), andcuffdiffunexpectedly shows an increase in FPR with increasingT.DESeqappears
more conservative than the other tools, consistently returning fewer FPs (particularly for high val-ues ofnr[DandF]) and fewer TPs (particularly at low values ofnr[AandE]).
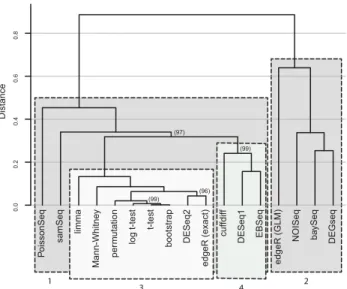
ordered by gene id and then hierarchically clustered by corre-lation distance with complete linkage (Fig. 3) using the R packagepvclust(Fig. 3; Suzuki and Shimodaira 2006).pvclust
uses bootstrapping to compute the statistical significance of subclusters within the dendrogram. Approximately unbiased
P-value percentages (AU%—Fig. 3, bracketed values) calcu-lated for each branch in the clustering are an indication of how robust each branch is to sampling error. Three widely used tools (DESeq2,edgeR [exact], andlimma, Table 1) are tightly grouped in a robust cluster with the standard statistical tests (Fig. 3, cluster 3). cuffdiff,DESeq, and EBSeq cluster tightly and are distinct from cluster 3 (Fig. 3, cluster 4). Despite the separation between these clusters being signifi-cant at the∼3% level, this is the weakest clustering observed in the tree, suggesting that these tools and tests are converging on approximately the same answer, given a large number of replicates. Several of the standard statistical tests are nonpara-metric (Mann-Whitney, permutation and bootstrap) and use very different underlying methods compared to the tools in this cluster, indicating that the agreement of techniques with-in this group is not the result of a similar underlywith-ing
method-ology, but is likely reflective of the true differential expression signal in the data.NOISeq,DEGSeq,baySeq, andedgeR ( gen-eralized linear model; hereafter GLM) form a distinct inde-pendent cluster (Fig. 3, cluster 2) suggesting that these tools reach a considerably different result to those in Cluster 1.
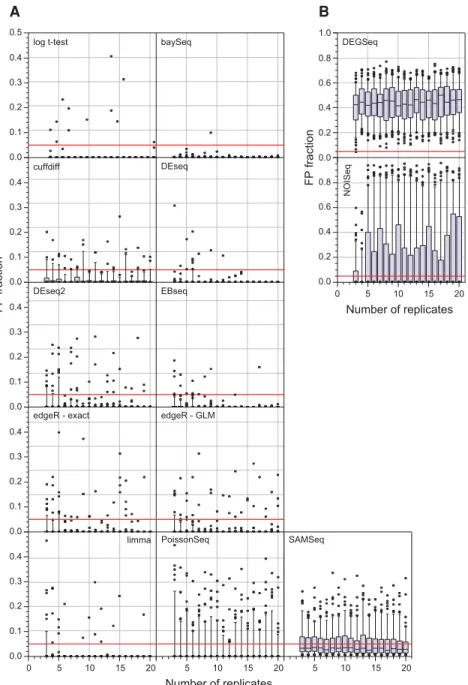
Testing tool false positive rates
Perhaps the most important performance measure for RNA-seq differential expression tools is their false detection rate. The large number of replicates in this study permits a simple test of the FPR for each of the tools. Two sets ofnrreplicates
were randomly selected (without replacement) from the WT condition. Under the null hypothesis that there is no expres-sion change between these two sets, every gene identified as SDE is, by definition, a false positive. For each bootstrap run, the fraction of the total gene set identified as SDE was computed. The distribution of this false positive fraction as a function of the number of replicates, for each differential expression tool, is shown in Figure 4. This approach shows that DEGSeq, NOISeq, and SAMSeq perform poorly even with a large number of replicates. DEGSeq, in particular, has poor false positive performance with every bootstrap iter-ation identifying >5% of all genes as false positives (FPs) and a median FPR of∼50% irrespective of the number of repli-cates. Approximately 10% ofcuffdiff,PoissonSeq, and∼40% ofSAMSeqbootstrap iterations identify >5% of all genes as FPs, suggesting that these tools are also not controlling their FPR well. BaySeq, DESeq, and EBSeq perform particularly well in this test withedgeR,DESeq2, andlimmaalso perform-ing adequately.
DISCUSSION
In this work, the performance of eleven popular RNA-seq DGE tools has been evaluated using a highly replicated two-condition RNA-seq experiment designed specifically for the purpose of benchmarking RNA-seq DGE tools on genuine biological replicate data. Five of the 11 tools,
EBSeq,edgeR (exact),DESeq,DESeq2, andlimmashow excel-lent performance in the tests presented here. Reassuringly,
edgeRandDESeqare the most widely used of the tools tested here as measured by citations (Table 1), suggesting that the majority of the RNA-seq DGE analyses in the literature are using the most appropriate tools for the job. An additional important feature of these five tools (run in GLM mode) is that they allow confounding experimental factors to be spec-ified for DGE permitting them to be used even with challeng-ing data sets. Where it is important to capture as many of the truly SDE genes as possible but with a low number of rep-licates (i.e., n≲12), the data presented here suggest edgeR (exact) or DESeq2in preference to the other tools due to their superior TP identification rate and well-controlled FDR at lower fold changes. All the tools perform well for experiments with sufficient numbers of replicates to ensure
P o issonSeq samSeq limma Mann-Whitne y per m utation log t-test t-test bootstr a p DESeq2 edgeR (exact) cuffdiff DESeq1 EBSeq edgeR (GLM) NOISeq ba ySeq DEGseq 0.0 0 .2 0.4 0.6 0.8 Distance 4 2 3 1 (97) (96) (99) (99)
FIGURE 3. Hierarchical clustering of eleven RNA-seq DGE tools and five standard statistical tests using all of the full clean data set comprising 42 WT and 44Δsnf2replicates. For each tool, or test, a 7126-element long vector of 1’s and 0’s was constructed representing whether each gene in the annotation was called as SDE (adjusted P-value or FDR threshold≤0.05) by the tool or not. The vectors for each tool and test were then ordered by the gene id and hierarchically clustered by Correlation distance with complete linkage using the R packagepvclust. Approximately unbiasedP-value percentages (bracketed values) calcu-lated for each branch in the clustering represent the support in the data for the observed sub-tree clustering. AU% > 95% are strongly supported by the data. AU% values are not shown for branch points where AU% = 100 for clarity. The outlier clustering of baySeq, DEGSeq, edgeR (GLM), andNOISeqsuggest that these tools are clearly distinct from the other tools. Combined with the tool performance data shown in Figure 2, this suggests that, given a large number of replicates, the tools and tests in Cluster 1 are reliably and reproducibly converging on a similar answer, and are likely to be correctly capturing the SDE sig-nal in the data.
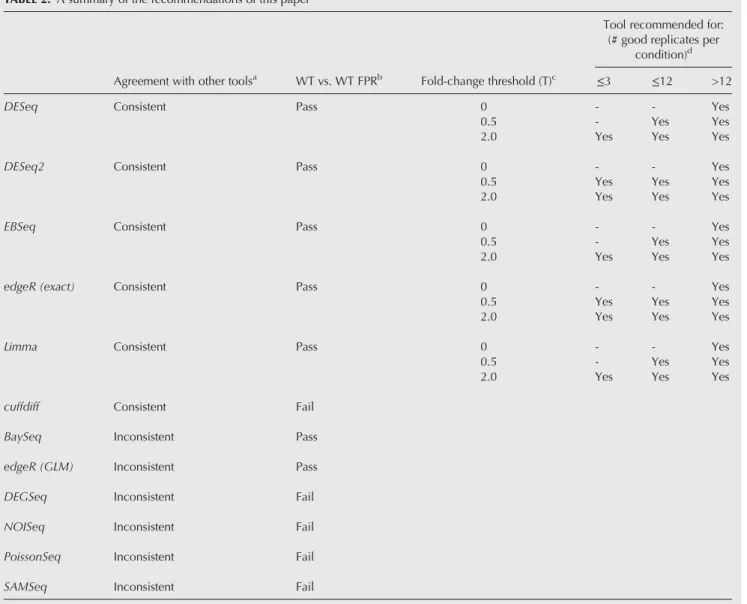
that the majority of the true SDE is already being captured (i.e., n≳12); however, the marginally better FPR perfor-mance ofDESeqsuggests it should be the tool of choice in this regime. Conversely, baySeq,cuffdiff, DEGSeq, NOISeq, PoissonSeq, andSAMSeqall show inferior performance in one or more areas. Table 2 summarizes the recommendations for
choosing RNA-seq DGE tools, based on the results of these benchmarking tests.
It is clear from the benchmarking runs that even the best tools have limited sta-tistical power with few replicates in each condition, unless a stringent fold-change threshold is imposed (Fig. 2). For all the tools the FPR is approximately constant regardless of fold-change threshold, sug-gesting that controlling the FNR rather than the FPR is the primary justification for imposing this limitation. The varia-tion intrinsic to any experimental proce-dures and protocols will result in a hard lower limit on the detectable fold changes for biologically relevant DGE. Unfortu-nately, it is not possible to calculate this limit here using the gene count data alone since it requires prior knowledge of actual fold changes to measure the im-pact of experimental variance. DESeq2
includes an option to specify a fold-change threshold for the null hypothesis being tested. In this mode the tool tests whether the measured gene fold changes are consistent with being below this threshold value (rather than being con-sistent with zero), providing a natural mechanism for incorporating a fold-change threshold in a statistically mean-ingful way. As expected, this reduces the number of genes called as SDE. Setting
nr= 10 and running 100 DESeq2
boot-straps, the number of SDE genes called is reduced from 3470 to 1277 by includ-ing a null hypothesis testinclud-ing the fold-change threshold of 0.5.
When designing an RNA-seq experi-ment with the primary goal of identifying those SDE genes that change by more than a factor of two (T= 1), three clean replicates per condition may be sufficient. However, this is not the same as conduct-ing the experiment with a total of three replicates, because there is a significant minority chance that one or more repli-cates within each condition should be rejected (see Gierlin´ski et al. 2015). Con-versely, for biological questions in which identifying the majority of the DE genes is important, a low-replicate experiment may not provide a sufficiently detailed view of the differential expression to inform the biology accu-rately. In these situations, it would be prudent to obtain at least 12 clean replicates per condition allowing the identification of≳90% of the truly SDE genes with T≳0.3 by any of the log t-test baySeq
FP fraction 0.0 0.1 0.2 0.3 0.4 0.5 0.0 0.1 0.2 0.3 0.4 0.0 0.1 0.2 0.3 0.4 0.0 0.1 0.2 0.3 0.4 DEseq2
limma PoissonSeq SAMSeq A
edgeR - exact edgeR - GLM EBseq DEseq cuffdiff 0.0 0.1 0.2 0.3 0.4 0 5 10 15 20 Number of replicates 5 10 15 20 B 0.0 0.2 0.4 0.6 0.8 1.0 DEGSeq 0 5 10 15 20 Number of replicates NOISeq 0.0 0.2 0.4 0.6 0.8 FP fraction 5 10 15 20
FIGURE 4. Testing false positive rate (FPR) performance: Each tool was used to call significantly differentially expressed (SDE) genes based on two artificial“conditions,”each constructed only from WT biological replicates. Genes identified as SDE are, by definition, false positives. The box plots show the median, quartiles, and 95% data limits on the FPR for 100 bootstrap iterations of each of the eleven tools and the logt-test fornr= 3,4,..,20. The red line highlights a 5% FPR. (A)
y-axis scale 0–0.5; (B)y-axis scale 0–1.0. In most cases the tools perform well for each bootstrap iteration, with only a small number of iterations showing a FPR > 5%.DEGSeq,NOISeq, and SAMSeqconsistently show a higher and more variable FPR, suggesting that they are struggling to control their FPR adequately.
tools presented here. It is worth recalling that identifying a gene as SDE does not necessarily equate to identifying it as bio-logically significant and that it is important to consider both the magnitude of the measured fold change and existing bio-logical knowledge alongside the statistical significance when inferring a biological significance for the results of DGE experiments.
The experiment performed here is likely to be a best-case scenario and thus represents the upper limit in performance of the tools tested.S. cerevisiaeis one of the best-studied mod-el organisms in biology, with a genome that is rmod-elativmod-ely small and well understood and few genes containing more than a single exon. Furthermore, the experiment contains no tis-sue-specific gene expression and the variation between bio-logical replicates is small. In an experiment with samples from individuals, or samples with higher biological variation,
the performance of all the DGE tools is likely to be worse. Similarly, for experiments using an organism with a more complex transcriptome, the performance of all the DGE tools is likely to be worse due to the presence of multiple transcript isoforms, anti-sense noncoding RNA transcrip-tion, and incomplete or poorly known annotations, particu-larly for 5′and 3′UTRs (Schurch et al. 2014). Although the majority of current DGE tools, including the 11 analyzed here, rely on an existing genome annotation, the recently published DGE toolderfinder(Frazee et al. 2014) examines differential expression for any region of a genome without annotations by analyzing differential expression at base pair resolution and grouping adjacent regions with similar signals. Such annotation-free differential expression tools may well represent the future for differential gene expression studies with RNA-seq data since they have the potential to mitigate
TABLE 2.A summary of the recommendations of this paper
Tool recommended for: (# good replicates per
condition)d Agreement with other toolsa WT vs. WT FPRb Fold-change threshold (T)c ≤3 ≤12 >12
DESeq Consistent Pass 0 - - Yes
0.5 - Yes Yes
2.0 Yes Yes Yes
DESeq2 Consistent Pass 0 - - Yes
0.5 Yes Yes Yes
2.0 Yes Yes Yes
EBSeq Consistent Pass 0 - - Yes
0.5 - Yes Yes
2.0 Yes Yes Yes
edgeR (exact) Consistent Pass 0 - - Yes
0.5 Yes Yes Yes
2.0 Yes Yes Yes
Limma Consistent Pass 0 - - Yes
0.5 - Yes Yes
2.0 Yes Yes Yes
cuffdiff Consistent Fail
BaySeq Inconsistent Pass
edgeR (GLM) Inconsistent Pass
DEGSeq Inconsistent Fail
NOISeq Inconsistent Fail
PoissonSeq Inconsistent Fail
SAMSeq Inconsistent Fail
a
Full clean replicate data set, see section“Tool Consistency with High Replicate Data”and Figure 3. bSee section“Testing Tool False Positive Rates”and Figure 4.
c
See section“Differential Expression Tool Performance as a Function of Replicate Number.” dSee Figure 2.
the impact of genome annotation on detection of differential expression.
To the best of our knowledge, the experiment presented here is the most highly replicated RNA-seq data set to date and the only one specifically designed for testing the process of calling differential expression. As such, it will be a useful resource for the bioinformatics community as a test-bed for tool development, and for the wider biological science community as the most detailed description of transcription in wild-type andΔsnf2mutantS. cerevisiae.
Recommendations for RNA-seq experiment design
The results of this study suggest the following should be con-sidered when designing an RNA-seq experiment for DGE: At least six replicates per condition for all experiments. At least 12 replicates per condition for experiments where
identifying the majority of all DE genes is important. For experiments with <12 replicates per condition; useedgeR
(exact)orDESeq2.
For experiments with >12 replicates per condition; use
DESeq.
Apply a fold-change threshold appropriate to the number of replicates per condition between 0.1≤T≤0.5 (see Fig. 2 and the discussion of tool performance as a function of replication).
MATERIALS AND METHODS TheΔsnf2mutant
Saccharomyces cerevisiaeis one of the best-studied organisms in mo-lecular biology with a relatively small transcriptome and very limited alternative splicing and was chosen in order to give us the simplest RNA-seq data possible.SNF2is the catalytic subunit of ATP-depen-dent chromatin remodeling SWI/SNF complex in yeast.SNF2forms part of a transcriptional activator and mutation in SNF2 brings about significant changes in transcription (e.g., Neigeborn and Carlson 1984; Stern et al. 1984; Peterson et al. 1991; Hirschhorn et al. 1992; Peterson and Herskowitz 1992; Holstege et al. 1998; Sudarsanam et al. 2000; Becker and Horz 2002; Gkikopoulos et al. 2011; Ryan and Owen-Hughes 2011, and references therein).
S. cerevisiaegrowth conditions and RNA extraction The S. cerevisiae strains used in the experiment were wild type (BY4741 strain, WT) andΔsnf2mutant in the same genetic back-ground. Asynchronous WT andΔsnf2mutant strains were streaked out on rich media (YPAD) to get individual colonies. For 48 repli-cates in both strains, single colonies were inoculated to 15 mL cul-tures and cells were grown to an OD600 of 0.7–0.8 (corresponding to approximately 106cells) at 30°C. RNA was isolated using the hot-phenol method (Kohrer and Domdey 1991) and cleaned up using the RNeasy mini kit (Qiagen) protocol that uses Zymolyase for yeast cell lysis and DNase treatment to remove DNA contamination. The amount of total RNA extracted ranged from 30.3 to 126.9 µg per
sample. Although the amount of RNA extracted was variable, the distributions were consistent with being drawn from the same pop-ulation (Kolmogorov–Smirnov test,P= 0.16) indicating no bias in RNA content between WT andΔsnf2mutant samples.
Library preparation, spike-in addition, and sequencing The RNA-seq experiment described here implements a“balanced block design”in order to control for technical artifacts such as library batch effects (Kaisers et al. 2014), barcoding biases, and lane effects via randomization of the libraries (Colbourn and Dinitz 2007; Auer and Doerge 2010). Additionally, all the replicates include artificial RNA spike-in controls in order to allow external calibration of the RNA concentrations in each sample and of the measured fold changes between the two conditions (Jiang et al. 2011; Loven et al. 2012). The 96 samples were prepared in batches of 24 samples with 12 of each strain in each batch. Barcodes were preassigned randomly between the samples with barcode IDs 1–48 assigned to theΔsnf2mutant sam-ples and 49–96 to the WT strain. For each batch the Illumina TruSeq protocol was used to prepare the sequencing library, with the addition of the ERCC spike-in standard (Ambion) (Jiang et al. 2011). Briefly, samples were poly(A) enriched with poly(dT) beads and 1 µL of 1:100 spike-in added to 19.5 µL of poly(A) enriched samples. Spike-in mix 1 was used with theΔsnf2mutant and mix 2 with WT. The RNA was then fragmented and subsequently underwent both first and second strand cDNA synthesis. The cDNA was then subjected to end repair, 3′end adenylation, and barcode sequences were added. Finally, the un-barcoded adapters were ligated, templates purified and finally the samples were enriched via barcode-specific PCR primers. At this point the quality of the libraries was examined and passed before being diluted down to 10 nM and quantified (using fluorescence-based quantification) for accurate aliquoting for cluster generation and appropriate lane loading. Seven independent pools of the 96 bar-coded samples were prepared and loaded onto seven lanes of an Illumina HiSeq 2000. Thus, each lane contains all 96 samples pre-pared in four batches with different spike-in mixes in each strain. The flow-cell was run for 51 cycles single-end.
Read alignment and read-count-per-gene measurement
The lane data were demultiplexed and processed through Cassava pipeline v1.8 to generate 672 fastq files comprising seven technical replicates for each of the 96 biological replicates in the experiment. A total of∼109reads were reported with each technical replicate having between 0.8 and 2.8 × 10⁶reads. Aggregating the technical replicates across lanes results in∼107reads per biological replicate. First pass quality control of the reads was performed withfastQC (http://www.bioinformatics.bbsrc.ac.uk/projects/fastqc) for each technical replicate. The reads from each technical replicate were then aligned to the Ensembl release 68 (Flicek et al. 2011)S. cerevi-siae genome with bowtie2 (v2.0.0-beta7) (Trapnell and Salzberg 2009) andTopHat2(v2.0.5) (Trapnell et al. 2009) using the follow-ing parameters:–max-intron-length 1000–min-intron-length 10 – microexon-search–b2-very-sensitive–max-multihits 1. The aligned reads were then aggregated with htseq-count (v0.5.3p9, Anders et al. 2015) using the Ensembl v68S. cerevisiaegenome annotation to give total gene read counts for all 7126 gene features for each tech-nical replicate. Finally, the read-count-per-gene measurements for
each technical replicate were summed across sequencing lanes to give read-count-per-gene for each of the 96 biological replicates, and these were then used to identify poorly correlating“bad” repli-cates within the two conditions that were then subsequently re-moved from the analysis (see Gierlin´ski et al. 2015 for a detailed description of this process). This resulted in a total of 42 WT and 44Δsnf2biological replicates of“clean”read-count-per-gene data. Tool details and considerations for differential
expression calculations
Most of the DGE tools assessed here calculate both a fold change (typically expressed as a logarithm to base 2 of the expression ratio, log2FC) and a statistical significance of differential expression for each gene. The fold change is based on the mean count across rep-licates in each condition, and for many of the tools this includes a calculation of sample-specific normalization factors based on the gene read-count data. For this study, the default normalization factors were used for each of the tools assessed. While there are differences between the normalizations used by these tools, it has been suggested that the details of which method is used to nor-malize the data does not significantly alter the downstream DGE results (Seyednasrollah et al. 2013). These normalization methods do, however, rely on the assumption that the majority of genes do not change their expression levels between conditions (e.g., Dillies et al. 2013). If this assumption is not satisfied, the measure-ments of both DGE fold change and significance are likely to be incorrect.
The statistical significances calculated by DGE tools are usually based on the null hypothesis of no expression change between the conditions. Calculating this significance typically relies on two key factors: (i) an assumption about the probability distribution that un-derlies the raw read-count measurements, and (ii) being able to accurately measure the mean count and variance for each gene. Different tools assume different forms for the underlying read-count distribution including the negative binomial (baySeq, Cuffdiff, DESeq, DESeq2, EBSeq, andedgeR), beta-binomial (BBSeq), bino-mial (DEGSeq), Poisson (PoissonSeq), and log-normal (limma) dis-tributions. A few algorithms make no assumptions about the read-count distribution and instead take nonparametric approaches to testing for DGE (NOISeqandSAMSeq). Gierlin´ski et al. (2015) show that for this data the majority of gene expression is consistent with both log-normal and negative binomial distributions except for the lowest expression genes, for which only the negative binomial distribution remains consistent with the data. For experiments with high numbers of replicates per condition (n≳12), the mean and var-iance estimators can be accurately computed directly on the data. However, many RNA-seq DGE studies rely on a low number of rep-licates per condition (n≲3), so several of the DGE tools (e.g.,DESeq, DESeq2, edgeR,limma) compensate for the lack of replication by modeling the mean-variance relation and borrowing information across genes to shrink the given gene’s variance toward the common model (Cui et al. 2005; De Hertogh et al. 2010; Robinson et al. 2010). The stabilized variance helps avoid some of the spurious false posi-tives and negaposi-tives, but is strongly dependent on an assumed read count distribution and on the assumptions intrinsic to the normali-zation of the count data, namely that the large majority of the gene counts are not truly differentially expressed. For a full description of the measured individual gene read count distributions in these data, a comparison of these with the assumptions made by DGE tools,
and the impact this has on the DGE results, see Gierlin´ski et al. (2015). Given these methods’dependence on accurate mean and variance measurements, it is somewhat surprising that scientists would con-template doing DGE analysis without replicated data, but for com-pleteness we note that several DGE analysis tools advertise that they can work with a single replicate per condition (Anders and Huber 2010; Robinson et al. 2010; Tarazona et al. 2011).
Bootstrap differential expression calculations
A utility pipeline was written to automate the process of running each DGE algorithm iteratively onirepeated subselections of clean repli-cates. Each subselection is comprised ofnrreplicates chosen at
ran-dom without replacement (that is, an individual replicate can appear only once within each subselection). This bootstrapping procedure includes applying the default normalization for each tool where relevant and possible (see section“Tool Details and Considerations for Differential Expression Calculations”) and the full output for each tool was stored in a localsqlitedatabase, including the log2 trans-formed fold change and the statistical significance for every expressed gene in the S. cerevisiae annotation. Most of the tools return Benjamini–Hochberg (hereafter BH; Benjamini and Hochberg 1995) correctedP-values or FDRs as their measure of statistical significance. Genes with an adjustedP-value or FDR≤0.05 were marked as “significantly differentially expressed” (SDE). Supple-mental Figure S1 shows an example of the output mean log2FC and medianP-value data for the tooledgeR(exact) withnr= 3.
From these data, TPRs, TNRs, FPRs, and FNRs for each tool were computed as a function of the number of replicates,nr, for four
ar-bitrary absolute log2fold-change thresholds, T∈{0,0.3,1,2}. A refer-ence fold change was used for deciding whether each gene falls above the thresholdTbecause the measured values of mean|log2FC| cal-culated for a gene varies considerably with both the tool being used andnr. These reference fold changes were defined independently of
the tools by applying DESeq normalization (Anders and Huber 2010) to the read-count-per-gene data from the full clean set of bi-ological replicates for each condition and then taking the log2 trans-formed ratio of the mean normalized read-count-per-gene for each condition. For each individual DGE calculation within a bootstrap run (i.e., an individual differential expression calculation with a spe-cific tool with a givennr), each gene was called as true/false positive/
negative by comparing whether it was called as SDE in the bootstrap run, and whether it was called as SDE in the corresponding tool-specific“gold standard.”Then, taking each fold-change threshold in turn, the mean of the number of true/false positives/negatives (TP, TN, FP, FN) for genes with reference fold changes above this threshold was calculated across all the individual DGE calculations within a bootstrap run. This results in a TPR, TNR, FPR, and FNR for a tool, for a givennrand for a givenT(Equations 1–4):
TPR(nr,T) = TP(nr,T) TP(nr,T) +FN(nr,T) ( 1) FPR(nr,T) = FP(nr,T) FP(nr,T) +TN(nr,T) ( 2) TNR(nr,T) = TN(nr,T) TN(nr,T) +FP(nr,T) ( 3) FNR(nr,T) = FN(nr,T) FN(nr,T) +TP(nr,T) ( 4)
Uncertainties in the resulting values were calculated by propagat-ing the standard deviations of the numbers of TPs, TNs, FPs, and FNs across the calculations within each bootstrap run, to reflect the spread of calculated values due to the random sampling of replicates.
Standard statistical tests for differential expression When assessing the performance of each DGE tool on the full set of clean data, we compare the tools not only within themselves, but also to the following set of standard statistical tests. For the following mathematical descriptions,xgk= (xg1k, xg2k, . . ., xgnkk)is a vector ofnk(clean) replicates for genegand conditionk,xgkands2gkare the
mean and variance of this vector. t-test
The null hypothesis in thet-test is that the given gene under two conditions has the same mean count,H0: µg1= µg2. We used the test statistic tg = xg1−xg2 s2 g12 n11+ 1 n2 (5)
with common variance estimators2
g12=[(n1−1)sg21+ (n2−1)s2g2]/n, and the number of degrees of freedom isv=n1+n2−2.
Log-ratio t-test
This modifiedt-test is more appropriate for log-normally distribu-ted data. The null hypothesis is lnµg1= lnµg2. The test statistic,
tg= lnxg1−lnxg2 s2 g1 n1x2g1+ s2 g2 n2x2g2 , (6)
is approximately distributed with t-distribution with n1+n2−2 degrees of freedom (see Olsson 2005).
Mann-Whitney test
The Mann-Whitney (Mann and Whitney 1947—hereafter MW) test is a nonparametric test assessing if count rate in a gene under one condition tends to be larger than under the other. The null hypoth-esis isH0:Pr(xgi1.xgj2) =1/2, for each pair of replicatesiandj.
P-values were calculated using normal approximation (Bellera et al. 2010) and taking ties into account (Sheskin 2004). The MW test relies on ranks, not actual data values, which makes it distribu-tion-free. On the other hand, when every replicate in one condition is larger than every replicate in the other condition, the MW test will return the sameP-value, regardless of how much the two conditions differ.
Permutation test
In the permutation test, counts from both conditions are pooled to-gether (for each gene),xg= (xg1,xg2) and then randomly resampledB times without replacement fromxg, using the original sizes,n1and
n2. For theb-th random permutationx∗g1(b)andx∗g2(b)we find the test statistic,D∗g(b) =x∗g1(b) −x∗g2(b), which is the difference be-tween the means of the two sampled vectors. This is compared with the observed statisticDg=xg1−xg2. The testP-value is the
fraction of cases where the resampled statistic exceeds the observed one, pg=#{|D∗g(b)|.|Dg|}/B(for more details, see Efron and
Tibshirani 1993a). The advantage of the permutation test is that it does not make any assumptions about the underlying distribution, but rather models it directly from data. The disadvantage is that it requires many replicates to build this underlying distribution, as it is not applicable for a typical experiment with, say, three replicates. Bootstrap test
The Studentized bootstrap test described by Efron and Tibshirani (1993b) was used here. It estimates probability distribution of the two populations with sample sizesn1andn2, under the null
hypoth-esis of the common mean. Data are resampled with replacement to estimate the significance level. For thebthbootstrap,x∗g1(b)and x∗
g2(b), the test statistic is
tg∗(b) = x ∗ g1(b) −x∗g2(b) s∗2 g12(b) n11+ 1 n2 ,b=1, 2,...B, (7) where the common variance estimator is s∗2
g12(b) =[(n1−1)s∗g12(b) +(n2−1)s∗g22(b)]/(n1+n2−2). This is compared with the observed statistic (Equation 5). As in the permu-tation test, the testP-value is the fraction of cases where the resam-pled statistic exceeds the observed one,pg=#{|tg∗(b)|.|tg|}/B.
DATA DEPOSITION
The data sets supporting the results of this article are available in the European Nucleotide Archive repository (ENA) (PRJEB5348, http:// www.ebi.ac.uk/ena/data/view/ERX425102). All the code for this work is publicly available (https://github.com/bartongroup/ profDGE48).
SUPPLEMENTAL MATERIAL
Supplemental material is available for this article.
ACKNOWLEDGMENTS
We acknowledge Dr. Tom Walsh for his efforts and support in managing the software requirements for this project on our HPC platform. We would like to thank Dr. Gabriele Schweikert for stim-ulating discussions and Dr. Mike Love for his assistance in identify-ing and correctidentify-ing a bug in our software that affected the original DESeq2andDEGSeqresults.
Author contributions: N.S. participated in the conception and de-sign of the experiment, the DGE analysis and statistical analysis of the data, and writing the manuscript. P.S. participated in the con-ception and design of the experiment and in the DGE analysis and statistical analysis of the data. M.G. participated in the concep-tion and design of the experiment, the DGE analysis and statistical analysis of the data, and in drafting the manuscript. C.C. participat-ed in the conception and design of the experiment, the DGE analysis and statistical analysis of the data, and in drafting the manuscript. A. S. participated in the DGE analysis of the data. V.S. grew the yeast samples and extracted the RNA for sequencing. N.W. participated in the QC and sequencing of the RNA samples and in incorporating
the ERCC spike-ins with the samples. K.G. participated in the design of the experiment, the QC and sequencing of the RNA samples, and with incorporating the ERCC spike-ins with the samples. G.S. par-ticipated in the design of the experiment and in drafting the manu-script. T.O.H. participated in the experimental design and in drafting the manuscript. M.B. participated in the design of the ex-periment and in the sequencing of the RNA samples. G.J.B. partic-ipated in the design of the experiment, in the DGE analysis and statistical analysis of the data, and in writing the manuscript. Received August 13, 2015; accepted February 17, 2016.
REFERENCES
Anders S, Huber W. 2010. Differential expression analysis for sequence count data.Genome Biol11:R106.
Anders S, Pyl PT, Huber W. 2015. HTSeq–a Python framework to work with high-throughput sequencing data.Bioinformatics31:166–169. Auer PL, Doerge RW. 2010. Statistical design and analysis of RNA
se-quencing data.Genetics185:405–416.
Becker PB, Horz W. 2002. ATP-dependent nucleosome remodeling. Annu Rev Biochem71:247–273.
Bellera CA, Julien M, Hanley JA. 2010. Normal approximations to the distributions of the Wilcoxon statistics: accurate to what N? Graphical insights.J Stat Educ18.
Benjamini Y, Hochberg Y. 1995. Controlling the false discovery rate: a practical and powerful approach to multiple testing.J R Stat Soc B (Methodol)57:289–300.
Bottomly D, Walter NA, Hunter JE, Darakjian P, Kawane S, Buck KJ, Searles RP, Mooney M, McWeeney SK, Hitzemann R. 2011. Evaluating gene expression in C57BL/6J and DBA/2J mouse striatum using RNA-Seq and microarrays.PLoS One6:e17820.
Bullard JH, Purdom E, Hansen KD, Dudoit S. 2010. Evaluation of stat-istical methods for normalization and differential expression in mRNA-Seq experiments.BMC Bioinformatics11:94.
Burden C, Qureshi S, Wilson SR. 2014. Error estimates for the analysis of differential expression from RNA-seq count data.PeerJ2:e576. Busby MA, Stewart C, Miller CA, Grzeda KR, Marth GT. 2013. Scotty: a
web tool for designing RNA-Seq experiments to measure differential gene expression.Bioinformatics29:656–657.
The Cancer Genome Atlas Research Network. 2008. Comprehensive ge-nomic characterization defines human glioblastoma genes and core pathways.Nature455:1061–1068.
Cheung VG, Nayak RR, Wang IX, Elwyn S, Cousins SM, Morley M, Spielman RS. 2010. Polymorphic cis- and trans-regulation of human gene expression.PLoS Biol8.
Churchill GA. 2002. Fundamentals of experimental design for cDNA microarrays.Nat Genet32:490–495.
Colbourn CJ, Dinitz JH. 2007. Handbook of combinatorial designs. Chapman and Hall/Taylor and Francis, Boca Raton, FL.
Cui X, Hwang JT, Qiu J, Blades NJ, Churchill GA. 2005. Improved stat-istical tests for differential gene expression by shrinking variance components estimates.Biostatistics6:59–75.
De Hertogh B, De Meulder B, Berger F, Pierre M, Bareke E, Gaigneaux A, Depiereux E. 2010. A benchmark for statistical micro-array data analysis that preserves actual biological and technical var-iance.BMC Bioinformatics11:17.
Dillies MA, Rau A, Aubert J, Hennequet-Antier C, Jeanmougin M, Servant N, Keime C, Marot G, Castel D, Estelle J, et al. 2013. A com-prehensive evaluation of normalization methods for Illumina high-throughput RNA sequencing data analysis. Brief Bioinform 14:
671–683.
Efron B, Tibshirani R. 1993a.An introduction to the bootstrap, pp. 203– 219. Chapman and Hall, New York.
Efron B, Tibshirani R. 1993b.An introduction to the bootstrap, pp. 220– 224. Chapman and Hall, New York.
Flicek P, Amode MR, Barrell D, Beal K, Brent S, Chen Y, Clapham P, Coates G, Fairley S, Fitzgerald S, et al. 2011. Ensembl 2011. Nucleic Acids Res39:D800–D806.
Frazee AC, Langmead B, Leek JT. 2011. ReCount: a multi-experiment resource of analysis-ready RNA-seq gene count datasets. BMC Bioinformatics12:449.
Frazee AC, Sabunciyan S, Hansen KD, Irizarry RA, Leek JT. 2014. Differential expression analysis of RNA-seq data at single-base reso-lution.Biostatistics15:413–426.
Gierlin´ski M, Blaxter M, Cole C, Gharbi K, Owen-Hughes T, Schofield P, Schurch NJ, Sherstnev A, Singh V, Wrobel N, et al. 2015. Statistical models for RNA-seq data derived from a two-con-dition 48-replicate experiment.Bioinformatics31:3625–3630. Gkikopoulos T, Schofield P, Singh V, Pinskaya M, Mellor J, Smolle M,
Workman JL, Barton GJ, Owen-Hughes T. 2011. A role for Snf2-re-lated nucleosome-spacing enzymes in genome-wide nucleosome or-ganization.Science333:1758–1760.
Guo Y, Li CI, Ye F, Shyr Y. 2013. Evaluation of read count based RNAseq analysis methods.BMC Genomics14:S2.
Hansen KD, Wu Z, Irizarry RA, Leek JT. 2011. Sequencing technology does not eliminate biological variability.Nat Biotechnol29:572–573. Hardcastle TJ, Kelly KA. 2010. baySeq: empirical Bayesian methods for identifying differential expression in sequence count data. BMC Bioinformatics11:422.
Hirschhorn JN, Brown SA, Clark CD, Winston F. 1992. Evidence that SNF2/SWI2 and SNF5 activate transcription in yeast by altering chromatin structure.Genes Dev6:2288–2298.
Holstege FC, Jennings EG, Wyrick JJ, Lee TI, Hengartner CJ, Green MR, Golub TR, Lander ES, Young RA. 1998. Dissecting the regulatory circuitry of a eukaryotic genome.Cell95:717–728.
The International HapMap Consortium. 2005. A haplotype map of the human genome.Nature437:1299–1320.
Jiang L, Schlesinger F, Davis CA, Zhang Y, Li R, Salit M, Gingeras TR, Oliver B. 2011. Synthetic spike-in standards for RNA-seq experi-ments.Genome Res21:1543–1551.
Kaisers W, Schwender H, Schaal H. 2014. Hierarchical clustering of DNA k-mer counts in RNA-seq fastq files reveals batch effects. arXivdoi: 1405.0114.
Kohrer K, Domdey H. 1991. Preparation of high molecular weight RNA. Methods Enzymol194:398–405.
Kvam VM, Liu P, Si Y. 2012. A comparison of statistical methods for de-tecting differentially expressed genes from RNA-seq data.Am J Bot
99:248–256.
Law CW, Chen Y, Shi W, Smyth GK. 2014. Voom: precision weights un-lock linear model analysis tools for RNA-seq read counts.Genome Biol15:R29.
Leng N, Dawson JA, Thomson JA, Ruotti V, Rissman AI, Smits BM, Haag JD, Gould MN, Stewart RM, Kendziorski C. 2013. EBSeq: an empirical Bayes hierarchical model for inference in RNA-seq exper-iments.Bioinformatics29:1035–1043.
Li J, Tibshirani R. 2013. Finding consistent patterns: a nonparametric approach for identifying differential expression in RNA-Seq data. Stat Methods Med Res22:519–536.
Li J, Witten DM, Johnstone IM, Tibshirani R. 2012. Normalization, test-ing, and false discovery rate estimation for RNA-sequencing data. Biostatistics13:523–538.
Liu Y, Zhou J, White KP. 2014. RNA-seq differential expression stud-ies: more sequence or more replication? Bioinformatics 30:
301–304.
Love MI, Huber W, Anders S. 2014. Moderated estimation of fold change and dispersion for RNA-seq data with DESeq2.Genome Biol15:550.
Loven J, Orlando DA, Sigova AA, Lin CY, Rahl PB, Burge CB, Levens DL, Lee TI, Young RA. 2012. Revisiting global gene expres-sion analysis.Cell151:476–482.
Lund SP, Nettleton D, McCarthy DJ, Smyth GK. 2012. Detecting differ-ential expression in RNA-sequence data using quasi-likelihood with shrunken dispersion estimates.Stat Appl Genet Mol Biol11 doi: 10.1515/1544-6115.1826.
Mann HB, Whitney DR. 1947. On a test of whether one of two random variables is stochastically larger than the other.Ann Math Stat18:
50–60.
Marioni JC, Mason CE, Mane SM, Stephens M, Gilad Y. 2008. RNA-seq: an assessment of technical reproducibility and comparison with gene expression arrays.Genome Res18:1509–1517.
Montgomery SB, Sammeth M, Gutierrez-Arcelus M, Lach RP, Ingle C, Nisbett J, Guigo R, Dermitzakis ET. 2010. Transcriptome genetics using second generation sequencing in a Caucasian population. Nature464:773–777.
Moulos P, Hatzis P. 2015. Systematic integration of RNA-Seq statistical algorithms for accurate detection of differential gene expression pat-terns.Nucleic Acids Res43:e25.
Neigeborn L, Carlson M. 1984. Genes affecting the regulation of SUC2 gene expression by glucose repression in Saccharomyces cerevisiae. Genetics108:845–858.
Olsson U. 2005. Confidence intervals for the mean of log-normal distri-bution.J Stat Educ13.
Pan W, Lin J, Le CT. 2002. How many replicates of arrays are required to detect gene expression changes in microarray experiments? A mix-ture model approach.Genome Biol3:research0022.
Peterson CL, Herskowitz I. 1992. Characterization of the yeast SWI1, SWI2, and SWI3 genes, which encode a global activator of transcrip-tion.Cell68:573–583.
Peterson CL, Kruger W, Herskowitz I. 1991. A functional interaction be-tween the C-terminal domain of RNA polymerase II and the negative regulator SIN1.Cell64:1135–1143.
Pickrell JK, Marioni JC, Pai AA, Degner JF, Engelhardt BE, Nkadori E, Veyrieras JB, Stephens M, Gilad Y, Pritchard JK. 2010. Understanding mechanisms underlying human gene expression var-iation with RNA sequencing.Nature464:768–772.
Rapaport F, Khanin R, Liang Y, Pirun M, Krek A, Zumbo P, Mason CE, Socci ND, Betel D. 2013. Comprehensive evaluation of differential gene expression analysis methods for RNA-seq data.Genome Biol
14:R95.
Robinson MD, Oshlack A. 2010. A scaling normalization method for differential expression analysis of RNA-seq data. Genome Biol11:
R25.
Robinson MD, McCarthy DJ, Smyth GK. 2010. edgeR: a Bioconductor package for differential expression analysis of digital gene expression data.Bioinformatics26:139–140.
Ryan DP, Owen-Hughes T. 2011. Snf2-family proteins: chromatin remodellers for any occasion.Curr Opin Chem Biol15:649–656. Schurch NJ, Cole C, Sherstnev A, Song J, Duc C, Storey KG,
McLean WH, Brown SJ, Simpson GG, Barton GJ. 2014. Improved
annotation of 3′untranslated regions and complex loci by combina-tion of strand-specific direct RNA sequencing, RNA-Seq and ESTs. PLoS One9:e94270.
SEQC/MAQC-III Consortium. 2014. A comprehensive assessment of RNA-seq accuracy, reproducibility and information content by the Sequencing Quality Control Consortium. Nat Biotechnol 32:
903–914.
Seyednasrollah F, Laiho A, Elo LL. 2013. Comparison of software pack-ages for detecting differential expression in RNA-seq studies.Brief Bioinform16:59–70.
Sheskin D. 2004. Handbook of parametric and nonparametric statistical procedures, 3rd ed., pp. 428–431. Chapman and Hall/CRC, Boca Raton, FL.
Soneson C. 2014. compcodeR—an R package for benchmarking differ-ential expression methods for RNA-seq data. Bioinformatics 30:
2517–2518.
Soneson C, Delorenzi M. 2013. A comparison of methods for dif-ferential expression analysis of RNA-seq data.BMC Bioinformatics
14:91.
Stern M, Jensen R, Herskowitz I. 1984. Five SWI genes are required for expression of the HO gene in yeast.J Mol Biol178:853–868. Sudarsanam P, Iyer VR, Brown PO, Winston F. 2000. Whole-genome
expression analysis of snf/swi mutants ofSaccharomyces cerevisiae. Proc Natl Acad Sci97:3364–3369.
Suzuki R, Shimodaira H. 2006. Pvclust: an R package for assessing the uncertainty in hierarchical clustering.Bioinformatics22:1540– 1542.
Tarazona S, Garcia-Alcalde F, Dopazo J, Ferrer A, Conesa A. 2011. Differential expression in RNA-seq: a matter of depth.Genome Res
21:2213–2223.
Trapnell C, Salzberg SL. 2009. How to map billions of short reads onto genomes.Nat Biotechnol27:455–457.
Trapnell C, Pachter L, Salzberg SL. 2009. TopHat: discovering splice junctions with RNA-Seq.Bioinformatics25:1105–1111.
Trapnell C, Roberts A, Goff L, Pertea G, Kim D, Kelley DR, Pimentel H, Salzberg SL, Rinn JL, Pachter L. 2012. Differential gene and tran-script expression analysis of RNA-seq experiments with TopHat and Cufflinks.Nat Protoc7:562–578.
Wang ET, Sandberg R, Luo S, Khrebtukova I, Zhang L, Mayr C, Kingsmore SF, Schroth GP, Burge CB. 2008. Alternative isoform regulation in human tissue transcriptomes. Nature 456: 470– 476.
Wang L, Feng Z, Wang X, Wang X, Zhang X. 2010. DEGseq: an R pack-age for identifying differentially expressed genes from RNA-seq data. Bioinformatics26:136–138.
10.1261/rna.053959.115 Access the most recent version at doi:
2016 22: 839-851 originally published online March 28, 2016 RNA
Nicholas J. Schurch, Pietá Schofield, Marek Gierlinski, et al.
and which differential expression tool should you use?
How many biological replicates are needed in an RNA-seq experiment
Material Supplemental http://rnajournal.cshlp.org/content/suppl/2016/03/28/rna.053959.115.DC1.html References http://rnajournal.cshlp.org/content/22/6/839.full.html#ref-list-1 This article cites 63 articles, 26 of which can be accessed free at:
Open Access
Open Access option. RNA
Freely available online through the
License Commons Creative . http://creativecommons.org/licenses/by/4.0/ (Attribution 4.0 International), as described at
, is available under a Creative Commons License RNA
This article, published in
Service Email Alerting
click here. right corner of the article or
Receive free email alerts when new articles cite this article - sign up in the box at the top
http://rnajournal.cshlp.org/subscriptions go to:
RNA To subscribe to