Civil Engineering Journal
Vol. 3, No. 10, October, 2017Oil Reservoir Permeability Estimation from Well Logging Data
Using Statistical Methods
(A Case Study: South Pars Oil Reservoir)
Akbar Esmailzadeh
a*,
Sina Ahmadi
b, Reza Rooki
b, Reza Mikaeil
aaMining and Metallurgical Department, Urmia University of Technology, Urmia, Iran. bMining and Metallurgical Department, Birjand University of Technology, Birjand, Iran.
Received 21 August 2017; Accepted 16 October 2017
Abstract
Permeability is a key parameter that affects fluids flow in reservoir and its accurate determination is a significant task. Permeability usually is measured using practical approaches such as either core analysis or well test which both are time and cost consuming. For these reasons applying well logging data in order to obtaining petrophysical properties of oil reservoir such as permeability and porosity is common. Most of petrophysical parameters generally have relationship with one of well logged data. But reservoir permeability does not show clear and meaningful correlation with any of logged data. Sonic log, density log, neutron log, resistivity log, photo electric factor log and gamma log, are the logs which effect on permeability. It is clear that all of above logs do not effect on permeability with same degree. Hence determination of which log or logs have more effect on permeability is essential task. In order to obtaining mathematical relationship between permeability and affected log data, fitting statistical nonlinear models on measured geophysical data logs as input data and measured vertical and horizontal permeability data as output, was studied. Results indicate that sonic log, density log, neutron log and resistivity log have most effect on permeability, so nonlinear relationships between these logs and permeability was done.
Keywords: Permeability; Oil Reservoir; South Pars; Well Logging; Statistical Nonlinear Models; SPSS.
1.
Introduction
The permeability is the capability of the penetration of a fluid such as oil, gas or water into the reservoir. The higher permeability causes the easier penetration of oil and gas into the reservoir rock. In this case, the oil can be extracted with higher rate and lower cost. The permeability is shown by "𝑘". The higher the effective porosity degree (𝜑𝑒) of the reservoir, the easier oil flow and the higher permeability of the reservoir would be. Darcy is the unit of the permeability. Different types of the permeability can be classified as absolute, relative and effective. Such definitions have completely been presented in most of studies carried out on this issue. Determination of permeability parameter is vital in processes such as storage estimate and development of oil reservoirs. Understanding of the correct values of permeability is considered as an effective tool for oil engineers in the process of production and management of an oil field. Usually, two direct (core and well test analysis) and indirect (geophysical logs assessment) methods are applied to determine the correct values of permeability in the oil industry [1-3].
Experimental relationships based on the Kozeny-Carmen theory have also been developed that relates permeability to other logs or other parameters such as resistivity and irreducible water saturation. Since core permeability data are
* Corresponding author: [email protected]
http://dx.doi.org/10.28991/cej-030918
This is an open access article under the CC-BY license (https://creativecommons.org/licenses/by/4.0/). © Authors retain all copyrights.
available in most exploration wells, statistical methods have become a more alternative in the domain of this problem solutions. Therefore, regression is widely used as a statistical method in searching for relationships between core permeability and well logs parameters. This parametric method requires the assumption and satisfaction of multinomial behavior and linearity. It is a model-based technique, and hence it must be applied with caution.
In spite of valuable core analysis results and well log interpretations, there are always doubts on a well production potential, particularly during the exploration stages. This doubt does not resolve unless a large sample of fluid formations is recovered during the production test, which is called the drill stem test. The recovery of the obtained fluids relies upon the permeability and porosity of the tested formation and the viscosity of the fluids existing inside the formation. Well logs are the curves indicating the variations of a physical variable or its derivations relative to depth. These logs comprise spontaneous potential logging (SP), gamma logs (GR), formation density compensated logs (FDC) or gamma – gamma graph, compensated neutron log (CNL), NPHI, resistivity log and acoustic Log [4].
2.
Literature Review
The mathematical relation in connection with the permeability is merely used to determine the effective permeability. Many studies were carried out to predict oil reservoir permeability. Over the past two decades, Artificial Intelligent (AI) has become a popular approach to model complex nonlinear systems. The neural network method is one branch of artificial intelligence technology analogizing human brain structures of perception, memory and recognition [5] in recent decades, artificial Intelligent (AI) has many applications in the oil engineering and permeability prediction [6-9].
Artificial intelligence approaches using seismic data in order to estimate of permeability of oil reservoir was used by Joonaki et al [10]. In their research oil reservoir is described by seismic elastic properties. Hybrid computational artificial was used to predict permeability of oil reservoir by Helmi et al. [11]. They predicted precisely oil reservoir permeability using integrated approach of Fuzzy logic (FL) and support vector machine (SVM). Support vector machines, based on the structural risk minimization (SRM) principle, seem to be a promising method for data mining and knowledge discovery [12]. It was introduced in the early 90s as a nonlinear solution for classification and regression tasks [13-14]. As well as Gholami et al. used support vector machine to predict of hydrocarbon reservoirs permeability. Comparing the result of SVM with that of a general regression neural network (GRNN) revealed that the SVM approach is faster and more accurate than the GRNN in prediction of hydrocarbon reservoirs permeability [15]. Alfaaouri et al. [16] estimated reservoir permeability base on 3-dimensional geological model using stochastic method. They applied two step modeling approach to predict permeability of reservoir. First, the reservoir skeleton was created from the field, and then the reservoir properties are distributed in the structural model using the random method. Oil reservoir permeability prediction using Hybrid neural genetic algorithm method was done by Kaydani et al. [17]. They develop their work on heterogeneous oil reservoir which is zoned into homogenic parts based on their geological characteristics. Support vector machine as powerful tool was used to estimate reservoir permeability by Anifowose et al. [18].
In their research comparison is made between performance of artificial neural network and support vector machine in reservoir permeability prediction that the results of support vector machine were better than those of artificial neural network. Rafik et al. predicted reservoir permeability using the nonparametric multivariate regression and neural network [19]. They applied well logging data of an oil reservoir in Algeria. Neural networks combined with hybrid genetic algorithm and particle swarm optimization was applied by Ahmadi et al. to predict oil reservoir permeability [20]. Their work indicates that metaheuristic methods such as particle swarm optimization could lead in acceptable result. In order to reservoir permeability estimation, Mohebbi et al. picked up artificial neural network method [21]. Due to heterogeneity of reservoir they broke the reservoir into homogenic parts based on geologic characteristics. In another research Kaydani et al estimate the Permeability in heterogeneous oil reservoirs by gene genetic programming algorithm. The multi-gene multi-genetic programming (MGGP) model with artificial neural networks (ANNs), adaptive neuro-fuzzy inference system (ANFIS) and genetic programming (GP) model were used to predict the permeability and obtained results were compared statistically. The comparison of results showed that the MGGP model can be applied effectively in permeability prediction, which gives low computational time. Furthermore, one equation based on the MGGP model using well log and core experimental data was generated to predict permeability in porous media [22].
Integrating Geological Attributes with a Multiple Linear Regression of Geophysical Well Logs to Estimate the Permeability of Carbonate Reservoirs is done by Almeida and Carrasquilla. The results of the study of this carbonate reservoir indicate that the permeability estimated by MLR method associated with reservoir zoning based on environmental energy zones is one that comes closest of laboratory data [23]. Yan et al Estimate Fractured Carbonate Reservoir Permeability by Microresistivity Imaging Logging. In order to guarantee the effectiveness of their method in multiscale rocks, they used upscaling method to acquire equations for calculating a variable parameter in this permeability model. Finally, they applied their permeability estimation method in microresistivity imaging logging interpretation. Results indicate that this method is better than traditional permeability model [24].An improved method for permeability estimation of the bioclastic limestone reservoir based on NMR data is done by Ge et al. they divide the pore space into four intervals by the inflection point between the pore radius and the transversal relaxation time.
Relationships between permeability and percentages of different pore intervals are investigated to investigate influential factors on the fluid transportation. To enhance the precision of downhole application of the new model, we developed a fluid correction algorithm to construct the water spectrum of in-situ NMR data, aiming to eliminate the influence of oil on the magnetization. The result reveals that permeability is positively correlated with percentages of mega-pores and macro-pores, but negatively correlated with the percentage of micro-pores [25].
According to reviewed literature, various methods have been applied to predict permeability of hydrocarbon reservoir. So, considering lack of statistical work in this area, this paper aims to present statistical models to foresee the permeability of the oil reservoirs by use of the data obtained from the south Pars region and SPSS Software.
3.
Permeability Prediction Methods
Sometimes permeability core data are not available due to a series of issues, such as well conditions or high coring costs. For this reason, several years have been attempted to estimate permeability by various methods. One of the cheap and simple sources for determining permeability is well logging. Various models have been used to achieve this goal. Experimental methods provide a series of policies for selecting independent variables that are used for prediction. Statistical models such as regression analysis are also used to determine permeability. Instead of flexible relationships, it predicts average statistical methods or expected permeability values for a series of rock properties and statistical parameters. In addition to the above methods, the artificial neural network method is one of the most effective methods for predicting permeability through well logs.
The advantage of regression and artificial neural network methods is that these methods do not need parameters such as porosity and saturation of water that should be pre-calculated.
3.1.Permeability Calculation Using Empirical Models
Kazani – Karman model is known as one of the most common methods. According to this model, permeability is expressed as below [26, 27]:
T
D
B
k
2 3
(1)
In which 𝜑 is porosity, 𝑇 is tortuosity, 𝐵 is Kazani constant (geometrical factor) and 𝐷 is effective size of particles. B value ranges from 5 to 100. As for a compacted and uniform rock, B is equal to 5. This model is not commonly used nowadays allowing for the wide range of B. However, the most accurate method in this regard is to analyze the core. Nevertheless, in view of some reasons including the well conditions and sizable costs of coring, it is not possible to measure the permeability values all along the well using core analysis method. All wells have well logging data, but no log can directly measure the permeability. Some methods applied for computing the permeability using well logs are as follows.
Wyli and Rose presented an empirical relation among the permeability, the porosity resulted from the well logs and irreducible saturation (𝑆𝑤𝑖) in accordance with Kazani - Karman equation:
y wi x
S
C
k
(2)
In which 𝐶 is the constant value depended on the hydrocarbon type (for dry gas equal to 79 and for the oil with moderate density is equal to 250), 𝑥, 𝑦 is the parameters obtained by logarithmic drawing of (𝑘 − 𝜑) in a certain saturation network 𝑆𝑤𝑖 , 𝑆𝑤𝑖 is irreducible water saturation. Similar formulae with different restrictions have also been presented in several other literatures [1, 2].
Free Fluid Index (FFI) is a volume of the fluid which is not restricted and has mobility. FFI can be obtained by NMR log. This index is in connection with the porosity and irreducible saturation as following:
)
1
(
S
wiFFI
(3)
Therefore, the irreducible saturation can be obtained as per Relation 3, if FFI and porosity are available. Then, the permeability can be achieved taking into consideration relation 1 or directly via the following relation [28]:
2 4
)
)(
10
(
FFI
FFI
k
(4)
3.2.Permeability Calculation Using Well Test
The permeability can also be determined via well test at certain distances. Nevertheless, this method cannot be led to a continuous estimation on the permeability. The estimated permeability, in this method, corresponds to a vast region [2].
The aforementioned equations need to have further modifications to obtain constant factors and powers. There is a problem with the empirical relations including the equation of Kazani - Karman. Such equations consider the behavior of a porosity area with high complexity as the behavior of a very simple porous area. This affects the flow in the area under consideration. NMR is very new and has not commonly been used yet. So, it is common to relate the well logs to the permeability in the cores wells that can be used for the spaces and non-cored wells.
4.
Site Investigation
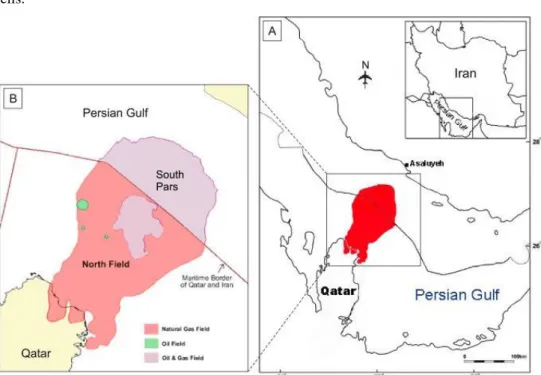
The sedimentary basin of Iran Plateau waters (Persian Gulf) is doubtlessly known as one of the richest regions of the world from the viewpoint of the concentration of hydrocarbon materials. This has been proven by the activities of different oil companies in the past, which resulted in the exploration of numerous oil fields in this region. Several factors comprising integrated sedimentary deposits with adequate thickness, the presence of mother rocks, reservoir and a good quality effective cover and multi-bedded hydrocarbon horizons have been involved in the creation of the aforesaid suitable gas and oil conditions. In the framework of exploration and drilling plan of the Persian Gulf, the exploration management of NIOC has commenced several exploratory activities since 1988 to recognize new anomalies and realize the structural characteristics of the explored fields making use of seismographic studies performed on some zones. The primary seismographic data corresponds to the mid-water and in parallel with the border line of the Persian Gulf. The initial attempts led to the exploration of several positive geological phenomena at different regions including the geological structure of South Pars that is the rest of the northern limb of the large northern gas field of Qatar. Figure 1 depicts the geographic location of large northern gas field of Qatar. The second seismographic data related to other regions including the northeast section of the South Pars Structure (1989 - 1990) showed vaster area of this field [29].
5.
Material and Methods
In accordance with the seismographic data, the first exploratory well was excavated (1990 - 1991) in the peak region of the structure in close proximity to the mid-line of the Persian Gulf waters. The excavations were terminated at depth 3522 m in sandstone sediments of Faraghoon Formation. The excavations and tests results depicted the presence of hydrocarbon materials in the strata of Jahrom (asphalt oil - tar), Daryan, Gadvan, Fahlian (oil), Upper Surmeh (heavy oil) and large amount of gas hydrocarbon materials in geological formations of Kangan and Dalan. The study area belongs to the geological formations of Kangan and Dalan related to the south Pars Oil Field (𝑘1, 𝑘2, 𝑘3 and 𝑘4). The wells under consideration include SP1, SP5 and SP6. Coring and core analysis have been performed on these wells. Table 1 represents the start depth of each part of 𝑘1, 𝑘2, 𝑘3, 𝑘4 and the geological formations of Kangan and Dalan in three study wells.
Table 1. Start depth of each part of 𝒌𝟏, 𝒌𝟐, 𝒌𝟑, 𝒌𝟒 and the geological formations of Kangan and Dalan SP6 SP5 SP1 Formation 2615 2775 2563 K1 Kangan 2720 2864 2672 K2 2770 2906 2716 K3 Dalan 2893-3050 3029-3180 2834-2978 K4
6.
Statistical Analysis of Well Logging Data
The main objective of this study is to predict permeability of the gas reservoirs by incorporating well logs and core data of three gas wells (SP1, SP5, SP6) in the South Pars field. In this study, 88 data of the well logging corresponding to the south Pars field are studied and statistically assessed. The study results can be utilized as statistical models so as to foresee the permeability of the oil reservoirs. A model in this article is a statistical model in which analyses that are performed by SPSS and Excel software on well data are used. In the first section, linear relations and then nonlinear relations are presented to predict permeability with respect to the reservoir rock parameters, which are well logs (GR, DT, RHOB, NPHI, PEF, MSFL, LLD and LLS). In the following, comparing these relationships and performing statistical tests, the best model for predicting the permeability of oil reservoirs is presented. To determine if the sample correlation coefficient has a significant difference with zero, use the t test. The f test is a generalized test of t and is used to evaluate the equal or even unity of two societies or several societies. In this test, the variance of the whole society is decomposed into its initial factors. This test is used when it is intended to simultaneously compare the goodness of fit (GOF) of several societies instead of two societies, because it is so difficult to compare the medians of several societies using 𝑡 Test.
6.1.Linear Regression
In the first part of the statistical studies, the data related to the South Pars region are collected using Ln, Log, exponential and power functions; then, the analyses associated with the single and multi-variables simple regression are assessed. In this part, it is assumed that there is an approximate linear relation between the independent variable (x) and dependent variable (y). This assumption is expressed as following [31]:
𝑦 = 𝐶 + 𝐴𝑥
1+ 𝐵𝑥
2+ ⋯
(5)
In which 𝑦 is Permeability, 𝐴, 𝐵, … is Constants, 𝑥1, 𝑥2, … is well logged data parameters. 6.2.Nonlinear Regression
In this model, the following non-linear relation is obtained by logarithm of the relation presented in the linear model [31, 32]:
𝑦 = 𝑥
1𝐴× 𝑥
2𝐵× 10
𝐶(6)
Having assessed the t and f factors as well as R2 value, three following relations were selected as the most appropriate ones (Table 2):
Table 2. Acquired Statistical models for Permeability
Models No. 𝑲𝑯 =𝑫𝑻𝟏𝟒.𝟔𝟒𝟐× 𝑹𝑯𝑶𝑩𝟏𝟑.𝟗𝟗𝟒× 𝑵𝑷𝑯𝑰𝟏.𝟔𝟔𝟗× 𝑳𝑳𝑫𝟎.𝟕𝟖𝟖 𝟏𝟎𝟑𝟒.𝟔𝟕𝟐 1 𝑲𝑯 =𝑫𝑻𝟏𝟑.𝟕𝟖𝟎× 𝑹𝑯𝑶𝑩𝟏𝟐.𝟐𝟗𝟒× 𝑵𝑷𝑯𝑰𝟏.𝟔𝟗𝟑× 𝑳𝑳𝑫𝟎.𝟕𝟒𝟐 𝑮𝑹𝟎.𝟔𝟎𝟕× 𝟏𝟎𝟑𝟏.𝟔𝟐𝟒 2 𝑲𝑯 = 𝑫𝑻𝟐𝟐.𝟏𝟒𝟗× 𝑹𝑯𝑶𝑩𝟐𝟐.𝟐𝟖𝟔× 𝑳𝑳𝑫𝟏.𝟔𝟖𝟕 𝑮𝑹𝟎.𝟗𝟖𝟕× 𝑴𝑺𝑭𝑳𝟎.𝟒𝟔𝟗× 𝑳𝑳𝑺𝟏.𝟓𝟖𝟕× 𝟏𝟎𝟒𝟕.𝟓𝟒𝟐 3
The results of the statistical tests for three multivariate statistical models are presented in Table 4. According to the results, as for t and F statistical tests, it is possible to trust the model coefficients and correlation factor in all models with reliability of more than 90% based on the following descriptions.
To determine if the correlation coefficient of the sample is statistically significant, we use the t test for a significant difference. In this method, it is assumed that the distribution of y and x is normal and two variables, and their relationship is linear. We consider n sample of 𝑥𝑖, 𝑦𝑖. The correlation factor of r is an estimation of the correlation factor of 𝜌 society:
𝑟 =
√∑(𝑥∑(𝑥𝑖−𝑥)𝑖−𝑥)2∑(𝑦𝑖−𝑦)2
(7)
The test statistic is defined as below:
𝑡 =
𝑟√𝑛−2√1−𝑟2
(8)
The F test is the generalized version of the t Test which is used to evaluate whether two or several societies are uniform or not. In this test, the society total variance is analyzed into its initial factors. For this reason, this test is also called variance analysis (ANOVA) [31].
Table 3. Acquired Statistical models for Permeability
Parameters Power coefficient Standard error F t R Model Constant -34.672 7.909 60.448 -4.384 0.863 1 LDT 14.642 3.480 4.208 LRHOB 13.994 4.994 2.802 LNPHI 1.669 0.231 7.236 LLLD 0.787 0.170 4.639 Constant -31.624 8.159 49.314 -3.876 0.866 2 LGR -0.607 0.433 -1.402 LDT 13.780 3.514 3.922 LRHOB 12.294 5.111 2.405 LNPHI 1.693 0.230 7.362 LLLD 0.742 0.172 4.325 Constant -47.542 8.794 28.433 -5.409 0.823 3 LGR -0.987 0.512 -1.929 LDT 22.142 3.650 6.066 LRHOB 22.286 5.874 3.794 LMSFL -0.469 0.175 -2.688 LLLD 1.687 0.429 3.937
A graph was drawn for each relation to determine the bias. So, the relations were rewritten by 80% of the data and the permeability amount was estimated by the remaining 20%. The graph was drawn making use of the permeability amount estimated by relations and the present permeability. In this graph, it is possible to estimate the relations bias as below taking into account the scattered data from the bisector.
Table 4. Measured and predicted data scattering from bisector
3 2 1 Model 1.841 2.052 2.068 Value
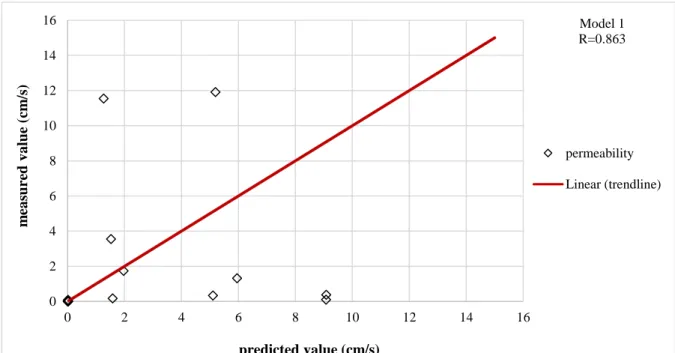
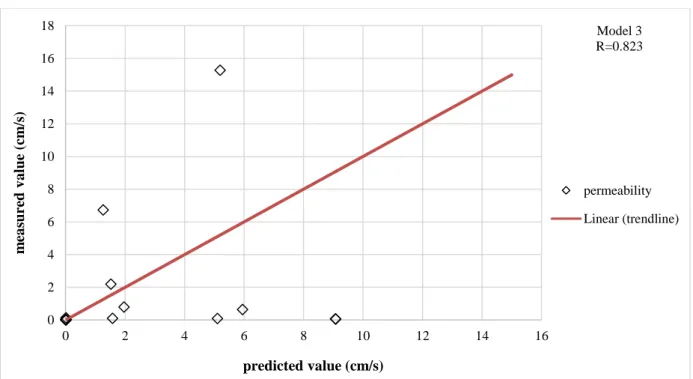
Figures 2-4. illustrate scattering of measured and predicted values for presented 3 models for 20 percent of the data that is used to prediction of the permeability. As shown in this figures, the correlation coefficient of models 1, 2, and 3 is obtained 0.863, 0.866 and 0.823 respectively. The predicted permeability by the new models is coherent with the laboratory permeability, showing favorable generalization ability of the new model.
Figure. 2. Measured and predicted data scattering from bisector for model 1
Figure 3. Measured and predicted data scattering from bisector for model 2
0 2 4 6 8 10 12 14 16 0 2 4 6 8 10 12 14 16 m ea sured v a lue ( cm /s ) predicted value (cm/s) Model 2 R=0.866 permeability Linear (trendline) 0 2 4 6 8 10 12 14 16 0 2 4 6 8 10 12 14 16 m ea sured v a lue ( cm /s ) predicted value (cm/s) Model 1 R=0.863 permeability Linear (trendline)
Figure 4. Measured and predicted data scattering from bisector for model 3
It should be noted that three points are eliminated from the data because of their high differences in permeability values, so that the scatter plot present better results. The studies performed on the statistical models indicate that there is a relatively acceptable bias in the permeability value predicted by the non-linear statistical models that can be used in this regard.
7.
Conclusion
It is very important to predict the permeability of the oil reservoirs. That is why the oil engineers are doing their level best to have the best predictions on the permeability of the oil reservoirs by presenting the relevant statistical models. The oil engineers always consider the statistical analyses as an applicable tool to relate the permeability parameter to the well logging data. In these computations, it is normally assumed that there is a linear or non-linear relation between the permeability and other parameters. In other words, it is assumed that the linear or non-linear function obtained for modeling is suitable/ adequate for modeling the relation between the permeability and other rock parameters. This paper aims to present statistical models for estimating the permeability in the oil reservoir of the South Pars Region making use of the geophysical, well logging data and SPSS Software. The study results indicated that the permeability of the oil reservoirs of the South Pars Region has not acceptable linear relation with the well logging data (correlation factor of less than 0.5). Nevertheless, the non-linear analyses results depict that the permeability of the oil reservoirs has acceptable non-linear relation with the well logging data. In general, the study results show that there is more appropriate relation between the permeability parameter and GR, DT, RHOB, NPHI and LLD in non-linear relations.
8.
References
[1] Kumar, N., N. Hughes, and M. Scott. "Using well logs to infer permeability." Center for Applied Petrophysical Studies, Texas Tech University (2000).
[2] Bhatt, Alpana. "Reservoir Properties from Well Logs using neural Networks." PhD diss., Norwegian University of Science and Technology, Trondheim, Norway, 2002.
[3] Russell, Brian Henderson. The application of multivariate statistics and neural networks to the prediction of reservoir parameters using seismic attributes. 2004.
[4] Moradzadeh, A., Ghavami, R., Well logging for engineer. Shahrood university press, 2001.
[5] Wang, Kejun, Bo He, and Ruolei Chen. "Predicting parameters of nature oil reservoir using general regression neural network." In Mechatronics and Automation, 2007. ICMA 2007. International Conference on, pp. 822-826. IEEE, 2007.
[6] Artun, Emre, Shahab D. Mohaghegh, Jaime Toro, Tom Wilson, and Alejandro Sanchez. "Reservoir characterization using intelligent seismic inversion." In SPE Eastern Regional Meeting. Society of Petroleum Engineers, 2005.
[7] Jeirani, Z., and A. Mohebbi. "Estimating the initial pressure, permeability and skin factor of oil reservoirs using artificial neural 0 2 4 6 8 10 12 14 16 18 0 2 4 6 8 10 12 14 16 m ea sured v a lue ( cm /s ) predicted value (cm/s) Model 3 R=0.823 permeability Linear (trendline)
[8] Hamada, G. M., and M. A. Elshafei. "Neural network prediction of porosity and permeability of heterogeneous gas sand reservoirs using NMR and conventional logs." Nafta 61, no. 10 (2010): 451-460.
[9] Olatunji, Sunday Olusanya, Ali Selamat, and Abdulazeez Abdulraheem. "Modeling the permeability of carbonate reservoir using type-2 fuzzy logic systems." Computers in industry 62, no. 2 (2011): 147-163.
[10] Joonaki, Edris, Shima Ghanaatian, and Ghassem Zargar. "An intelligence approach for porosity and permeability prediction of oil reservoirs using seismic data." International Journal of Computer Applications 80, no. 8 (2013).
[11] Helmy, Tarek, and Anifowose Fatai. "Hybrid computational intelligence models for porosity and permeability prediction of petroleum reservoirs." International Journal of Computational Intelligence and Applications 9, no. 04 (2010): 313-337.
[12] Weston, Jason, Alex Gammerman, M. Stitson, Vladimir Vapnik, Volodya Vovk, and Chris Watkins. "Support vector density estimation." Advances in Kernel Methods—Support Vector Learning (1999): 293-306.
[13] Vapnik, V. "The nature of statistical learning theory Springer New York Google Scholar." (1995).
[14] Behzad, M., Asghari, K., Eazi, M., & Palhang, M. (2009). Generalization performance of support vector machines and neural networks in runoff modeling. Expert Systems with applications, 36(4), 7624-7629.
[15] Behzad, Mohsen, Keyvan Asghari, Morteza Eazi, and Maziar Palhang. "Generalization performance of support vector machines and neural networks in runoff modeling." Expert Systems with applications 36, no. 4 (2009): 7624-7629.
[16] Alfaaouri, S., M. A. Riahi, N. Alizadeh, and M. Rezaei. "Permeability prediction in an oil reservoir and construction of 3D geological model by stochastic approaches." (2009).
[17] Kaydani, Hossein, Ali Mohebbi, and Ali Baghaie. "Permeability prediction based on reservoir zonation by a hybrid neural genetic algorithm in one of the Iranian heterogeneous oil reservoirs." Journal of Petroleum Science and Engineering 78, no. 2 (2011): 497-504.
[18] Baziar, Sadegh, Mohammad Mobin Gafoori, Mohaimenian Pour, Seyed Mehdi, Majid Nabi Bidhendi, and Reza Hajiani. "Toward a Thorough Approach to Predicting Klinkenberg Permeability in a Tight Gas Reservoir: A Comparative Study." Iranian Journal of Oil & Gas Science and Technology 4, no. 3 (2015): 18-36.
[19] Rafik, Baouche, and Baddari Kamel. "Prediction of permeability and porosity from well log data using the nonparametric regression with multivariate analysis and neural network, Hassi R’Mel Field, Algeria." Egyptian Journal of Petroleum 26, no. 3 (2017): 763-778.
[20] Ali Ahmadi, Mohammad, Sohrab Zendehboudi, Ali Lohi, Ali Elkamel, and Ioannis Chatzis. "Reservoir permeability prediction by neural networks combined with hybrid genetic algorithm and particle swarm optimization." Geophysical Prospecting 61, no. 3 (2013): 582-598.
[21] Mohebbi, A., R. Kamalpour, K. Keyvanloo, and A. Sarrafi. "The prediction of permeability from well logging data based on reservoir zoning, using artificial neural networks in one of an Iranian heterogeneous oil reservoir." Petroleum Science and Technology 30, no. 19 (2012): 1998-2007.
[22] Kaydani, Hossein, Ali Mohebbi, and Mehdi Eftekhari. "Permeability estimation in heterogeneous oil reservoirs by multi-gene genetic programming algorithm." Journal of Petroleum Science and Engineering 123 (2014): 201-206.
[23] Almeida, Paula, and Abel Carrasquilla. "Integrating Geological Attributes with a Multiple Linear Regression of Geophysical Well Logs to Estimate the Permeability of Carbonate Reservoirs in Campos Basin, Southeastern Brazil." Analyst 9, no. 4 (2016): 8-17.
[24] Yan, W., J. Sun, K. Liu, L. Cui, and H. Dong. "Fractured Carbonate Reservoir Permeability Estimation by Microresistivity Imaging Logging." In 79th EAGE Conference and Exhibition 2017. 2017.
[25] Ge, Xinmin, Yiren Fan, Jianyu Liu, Li Zhang, Yujiao Han, and Donghui Xing. "An improved method for permeability estimation of the bioclastic limestone reservoir based on NMR data." Journal of Magnetic Resonance 283 (2017): 96-109.
[26] Carman, Philip Crosbie. Flow of gases through porous media. Academic press, 1956.
[27] Carman, Philip Crosbie. "Fluid flow through granular beds." Transactions-Institution of Chemical Engineeres 15 (1937): 150-166.
[28] Tiab, Djebbar, and Erle C. Donaldson. Petrophysics: theory and practice of measuring reservoir rock and fluid transport properties. Gulf professional publishing, 2015.
[29] National Iranian Oil Company (NIOC), http://www.nioc.ir
[30] Mehrabi, Hamzeh, Maryam Mansouri, Hossain Rahimpour-Bonab, Vahid Tavakoli, and Maryam Hassanzadeh. "Chemical compaction features as potential barriers in the Permian-Triassic reservoirs of Southern Iran." Journal of Petroleum Science and
Engineering 145 (2016): 95-113.
[31] Seber, George AF, and Alan J. Lee. Linear regression analysis. Vol. 936. John Wiley & Sons, 2012.