Digitale bestemmingsplannen
Geo-informatie en
ruimtelijk
ontwikkelings-beleid in Nederland
Binnen het RGI-project 3D Topografie [2] wordt door de TU Delft onderzoek gedaan
naar een geschikte datastructuur voor het opslaan, bewerken en analyseren van 3D
geo-informatie. Cruciaal hierbij zijn de mogelijkheden die de structuur biedt voor
het consistent houden van de data (aangezien de stap van 2D naar 3D zowel
data-omvang als complexiteit aanzienlijk vergroot) en het ondersteunen van 3D analyses
en bewerkingen (om zo 3D GIS meer te laten zijn dan alleen een realistische
visua-lisatietechniek). Gekozen is voor een Tetrahedronized Irregular Network (TEN), een
topologische structuur die de ruimte volledig opdeelt in tetraëders door gebruik te
maken van simplices; de eenvoudigste vorm per dimensie: node, edge, driehoek,
tetraëder. Een TEN voldoet aan de eisen qua consistentiecontrole en rekenkundige
ondersteuning. Nadeel van een TEN is vaak de dataomvang en voor de
doorsnee-gebruiker ook de complexiteit. Deze nadelen worden ondervangen in onze aanpak,
die Poincaré’s formalisme van de simpliciale homologie uit 1895 als uitgangspunt
39
De ruimtelijke basis van de
nationale planning
In de Nederlandse ruimtelijke ordening be-palen de gemeenten welke bestemming hun grondoppervlak mag krijgen. Dit wordt vastge-legd in bestemmingsplannen. Er vindt breed vooronderzoek plaats waarbij bijvoorbeeld de historische informatie van het gebied wordt bezien of de waterhuishouding in het gebied onderzocht. Alle functies, variërend van wo-nen, werken, recreëren tot vuilstortplaatsen
en stiltegebied, passeren de revue. Vervol-gens worden de voorlopige plannen getoetst aan de regels en kaders van Rijk en provincie.
3D MODELLING OF
TOPOGRAPHIC OBJECTS
BY FUSING 2D MAPS AND LIDAR DATA
39
INTRODUCTION
With the growing demand for 3D topographic data the need for automated 3D data acquisi-tion also grows. Over the past 10 years several researchers proposed methods to acquire 3D topographic data. Many of them focussed on 3D reconstruction of man-made objects. Auto-mated methods for reliable and accurate 3D re-construction of man-made objects are essential to many users and providers of 3D city data. But also the 3D reconstruction of other topo-graphic features, like infrastructural objects and land use, are of interest for many applications like flood forecasting, pollution studies, noise modelling and time-space modelling.
PART OF RGI PROJECT 011
“3D TOPOGRAPHY”
Height data and topographic information should be combined to upgrade 2D maps to 3D topographical maps. In 3D maps it should be possible to store multiple topographic features
at one and the same 2D location (e.g. tunnels and flyovers). Height information can be ex-tracted from airborne or terrestrial acquisition methods, but can also be modelled as impli-cit semantic information. The challenge is to produce semantical, geometrical and topolo-gical correct 3D topography. In this paper we describe the steps to acquire 3D topographic information. This research is part of RGI pro-ject ‘3D Topography’, which aims to develop methods for acquiring, storing, and querying 3D topographic data as a feasibility study for a future national 3D topographic database. Usage is therefore made of the current national
Figure 1: Schematic representation of interchan-ge in 2D (left) and in 3D (right).
40
G E O - I N N OVAT I E2D topographic database TOP10vector and the national elevation model AHN.
DATA FUSION WITH CARE
In this research we recognise and model height discontinuities between objects that are adja-cent in a 2D topographic database. For model-ling the surfaces of the 3D topographic object a point cloud segmentation algorithm is used. This algorithm preserves height discontinui-ties, but eliminates small objects like cars and traffic signs that should not be included in the 3D topographic database. Filtering algorithms are also used to select the correct laser points for modelling the object surfaces. The point densities obtained by airborne laser scanner systems are increasing rapidly. When used for the 3D reconstruction of buildings the increa-sing amounts of points contain more and more information about the shape of buildings. The use of an additional source of information can improve the reconstruction process, especially in terms of time and reliability. The existing
topographic data delivers a large amount of to-pological and semantical information. Objects in topographic maps have been classified by human interpretation of aerial images which implies that the outlines, classification and semantics of topographical features are being stored for every object.
HEIGHTS TO BOUNDARIES
AND SURFACES
Adding height to a 2D object not only means giving height to the boundaries of this object, but also to the surface of the object. Most of the objects show some relief at its surface, like structures on the roof of a building, height dif-ferences in grasslands and infrastructure. Laser data and 2D map data will be integrated and processed in an object-based approach. For groups of objects rules for 3D reconstruction are being set-up. These rules have to ensure the geometrical, topological and semantical correctness of the 3D map. Adding height infor-mation to existing 2D features is not sufficient;
41
S Y M P O S I U M 2 0 0 6
Figure 3: AHN laser data of Prins Claus Plein.
additional features have to be acquired and existing features might get an extra dimension. Examples are shown in figure 2 for the auto-mated generation of additional polygons at real 3D objects like interchanges and flyovers. Next, road objects at those locations are con-verted automatically from surfaces to volumes, in order to get realistic 3D data.
In the first step of data fusion it will be decided which parts of the laser data will be used to provide height information to which part of the 2D map. This is one of the most crucial steps in the automation of the reconstruction process. The easiest way to select the laser data is just to perform a points-in-polygon function, where the outlines of the grouped 2D objects act as polygons. In the ideal case this is enough to
select the right points. However, in many cases not all laser points represent height informa-tion of the topographic object, but may indicate height of details of an object, e.g. one laser point can lie on a chimney instead of the roof, or on a car instead of the street. An important step of the selection is segmenting the point cloud, according to the rules and conditions of the object (group). In the modelling step selected laser points will be further processed in order to remove the noisy character of the laser data, to generalize the shape of the ob-ject, and, doing so, to prepare a more realistic view in the end product. For each object group different strategies will be set-up. In many cases, two objects that are adjacent in 2D are also adjacent in 3D. In some cases, however, there will be a clear height difference for (a
42
G E O - I N N OVAT I Epart of) the boundary that the objects share in 2D. Assigning the proper heights to the object outlines then requires the introduction of addi-tional lines in the database. Addiaddi-tional surfaces have to be constructed for ‘hidden’ objects, like the lower roads at interchanges or the water surfaces beneath bridges.
Implicit height information of objects will be added to the model. Some examples have been described by other authors: a lake represents a horizontal plane, and all height values of the lakes’ area must be the same, the neighbouring banks, however, have to be hi-gher than the water. To give another example, the slope of a road along and across the road direction must not exceed a certain maximum value. Although neither laser points nor map data may be available underneath interchanges and flyovers, constraints in the model can fill the gap and connect two parts on the high-way in 3D. Other constraints for neighbouring objects can be that no topographic objects other than “air” are allowed to exist above a
highway at a distance smaller than a certain threshold.
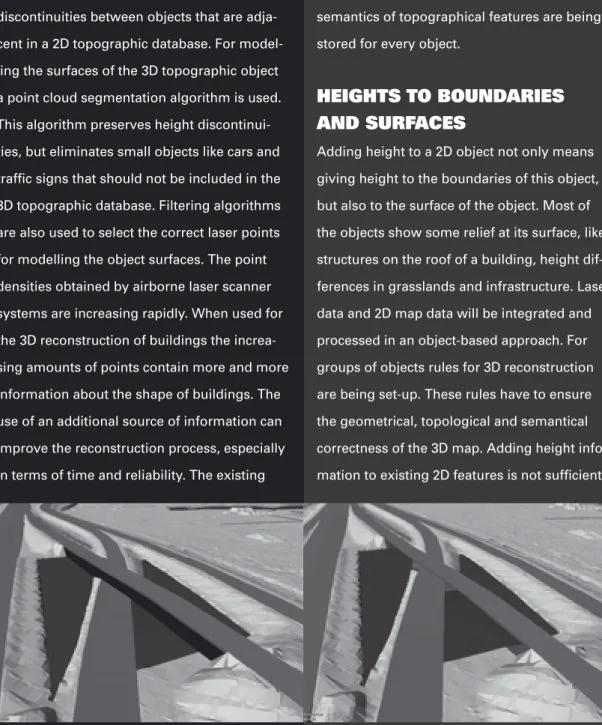
PRINS CLAUS PLEIN IN 3D
Results are shown for the fusion of a medium scale topographic map (TOP10Vector) with laser data with a point density of one point per five m2 (original dataset of part of the AHN).The developed method is demonstrated with a 3D reconstruction of the complex motorway interchange ‘Prins Claus Plein’, with multiple infrastructural objects crossing each other at different height levels. Figure 3 shows the reconstructed model, viewing the Utrechtse Baan eastwards. Although the focus in this presentation will lie on the modelling of 3D infrastructural objects, the 3D map includes the modelling of topographic features completely covering the terrain.
International Institute for Geo-information Science and Earth Observation (ITC)
[email protected] Figure 4: Perspective view of 3D reconstruction of Prins Claus Plein.