Utilization of Multimodal
Interaction Signals for Automatic
Summarisation of Academic
Presentations
Keith Curtis
B.Sc.
A dissertation submitted in fulfilment of the requirements for the award of
Doctor of Philosophy (Ph.D.)
to the
Dublin City University
School of Computing
I hereby certify that this material, which I now submit for assessment on the programme of study leading to the award of Ph.D. is entirely my own work, that I have exercised reasonable care to ensure that the work is original, and does not to the best of my knowledge breach any law of copyright, and has not been taken from the work of others save and to the extent that such work has been cited and acknowledged within the text of my work.
Signed:
(Candidate) ID No.: 59847065
Contents
Abstract xvi Acknowledgements xvii 1 Introduction 1 1.1 Motivation . . . 2 1.1.1 Example Use-Case 1 . . . 4 1.2 Overview . . . 5 1.3 Objectives . . . 7 1.4 Research Questions . . . 9 1.5 Structure . . . 14 2 Background Review 16 2.1 Non-Verbal Communication . . . 162.2 Background and Related Work . . . 20
2.3.3 Optical Character Recognition . . . 41
2.4 Audio Feature Analysis . . . 42
2.4.1 Pitch . . . 42 2.4.2 Intensity . . . 43 2.4.3 Formants . . . 45 2.4.4 MFCC’s . . . 46 2.4.5 Laughter Detection . . . 47 2.5 Video Summarisation . . . 47
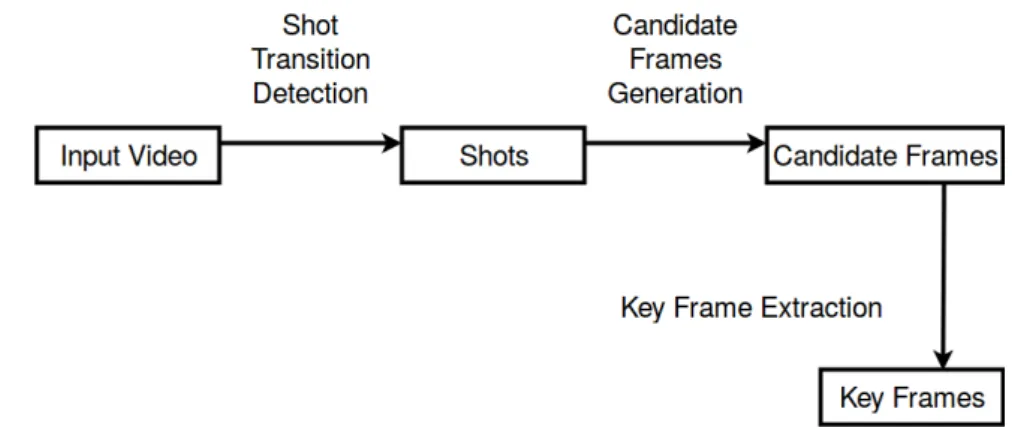
2.5.1 Key Frame Abstraction: . . . 48
2.5.2 Video Skim Abstraction: . . . 51
2.5.3 Discussion . . . 54
2.5.4 Skim Generation Process . . . 54
2.5.5 Related Works at TRECVID . . . 55
2.6 Multimodal Signal Fusion . . . 58
2.6.1 Fusion Methods . . . 60
2.6.2 When to Fuse . . . 61
2.6.3 Level of Fusion . . . 61
2.6.4 What to Fuse . . . 62
2.7 Summary . . . 62
3 Multimodal Data Collection 65 3.1 Existing Multimodal Datasets . . . 65
3.1.1 AMI . . . 66
3.1.2 MASC . . . 66
3.1.3 Open Online Lectures and Presentations . . . 67
3.2 Introduction to Corpus . . . 67
3.3 Data Collection . . . 68
3.4 Human Annotation . . . 70
3.4.2 Speaker Emphasis . . . 75
3.4.3 Comprehension . . . 77
3.5 Final Dataset . . . 79
3.6 Summary . . . 80
4 Classification of Engaging & Emphasised Material 83 4.1 Classification of Automatic Speaker Ratings and Audience Engagement 83 4.1.1 Introduction . . . 84
4.1.2 Objectives . . . 86
4.1.3 Multimodal Feature Extraction . . . 87
4.1.4 Experiment Design . . . 92
4.1.5 Linear Correlations to Presentation Ranking and Engagement 99 4.1.6 Classification of Speaker Ratings . . . 101
4.1.7 Classification of Audience Engagement . . . 106
4.1.8 Speaker Ratings : Audience Engagement - Linear Correlations 109 4.2 Identification of Intentional or Unintentional Emphasised Speech . . . 110
4.2.1 Introduction . . . 110
4.2.2 Multimodal Feature Extraction . . . 111
4.2.3 Experimental Investigation . . . 111
4.2.4 Results and Analysis . . . 114
4.3 Summary . . . 118
5.3.5 Audience-Based Visual Features . . . 128
5.4 Experiment Design . . . 128
5.4.1 Experimental Investigation . . . 129
5.4.2 Detailed Technical Description . . . 130
5.5 Experimental Results . . . 134
5.5.1 Balance of Data Set and Baseline . . . 134
5.5.2 Early-Fusion Classification Results . . . 136
5.5.3 Late-Fusion Classification . . . 151
5.5.4 Alternative Classification for Binary Problem . . . 156
5.5.5 Correlation of Individual Features to Comprehension . . . 157
5.5.6 Relation to Speaker Ratings and Audience Engagement . . . . 159
5.6 Summary . . . 159
6 Generation and Evaluation of Presentation Summaries 161 6.1 Introduction . . . 161
6.2 Creation of Presentation Summaries . . . 164
6.3 Evaluation of Video Summaries . . . 169
6.3.1 Gaze-Detection: Instructions to Participants . . . 170
6.3.2 Gaze-Detection Evaluation . . . 170
6.3.3 Further Evaluations of Gaze . . . 174
6.3.4 Eye-Tracking Heat Maps . . . 177
6.3.5 Questionnaire for Eye-Tracking Participants . . . 186
6.3.6 Evaluation by Comparison with Enhanced Digital Video Browser188 6.3.7 Evaluation Between Summary Types . . . 190
6.3.8 Gaze Plots . . . 193
6.4 Summary . . . 203
7 Conclusion and Future Work 205 7.1 Summary of Thesis Contributions . . . 205
7.3 Potential Future Research Directions . . . 213 7.4 Concluding Remarks . . . 214 Bibliography 216 Glossary 229 Appendix A 230 A.1 Publications . . . 230 Appendix B 232 B.1 Full Eye-Tracking Results . . . 232
B.1.1 Further Evaluations of Gaze . . . 237
Appendix C 242 C.1 Technical Information . . . 242 C.1.1 OpenCV . . . 242 C.1.2 OpenSMILE . . . 243 C.1.3 Praat . . . 244 C.1.4 Weka . . . 245
List of Figures
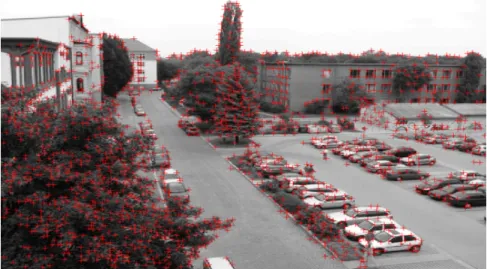
2.1 Types of non-verbal communication, from (Non, 2014) . . . 19 2.2 An example of Harris Corner Detector, keypoints detected at all
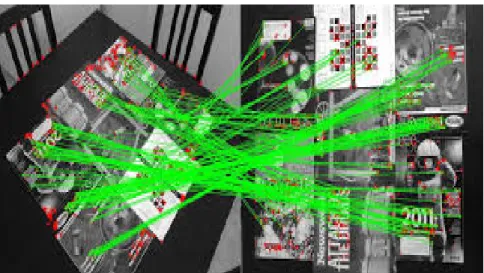
ma-jor corners or edges, from (Har, 2017) . . . 35 2.3 An example of Scale Invariant Feature Transform (SIFT), keypoints
detect identical object in different images, from (Sif) . . . 35 2.4 An example of ORB descriptor, similar to SIFT and SURF, keypoints
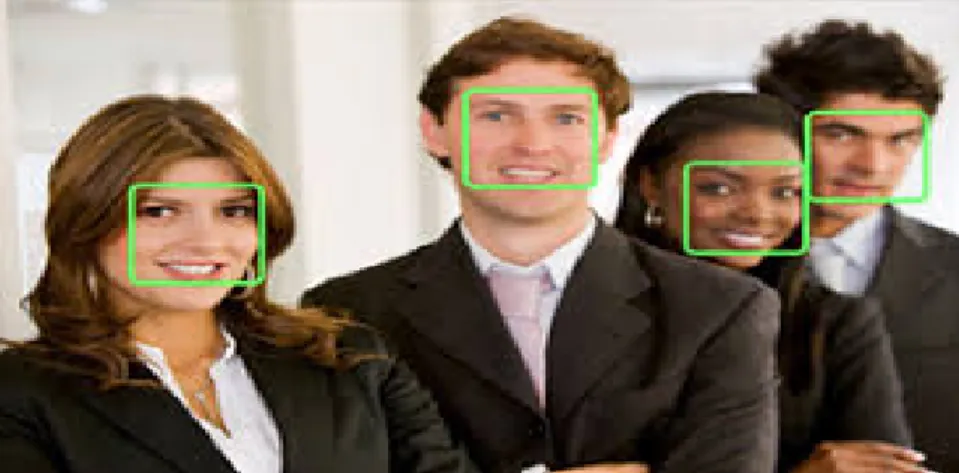
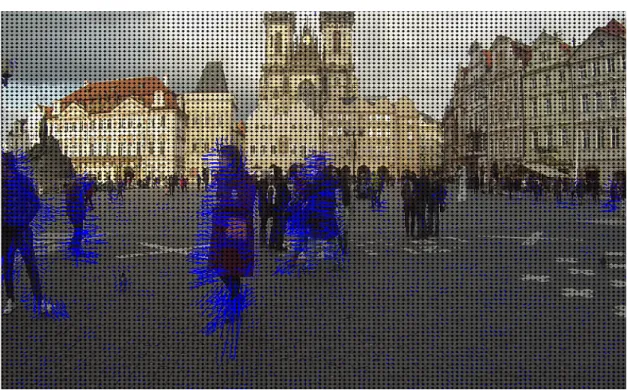
detect identical objects in different images, from (Orb, 2013) . . . 37 2.5 An example of Robust Real-Time Face Detection, from (Fac, 2015) . 39 2.6 Optical Flow 1/2 . . . 40 2.7 Optical Flow 2/2 . . . 40 2.8 An example of Optical Flow: Clusters of blue pixels around
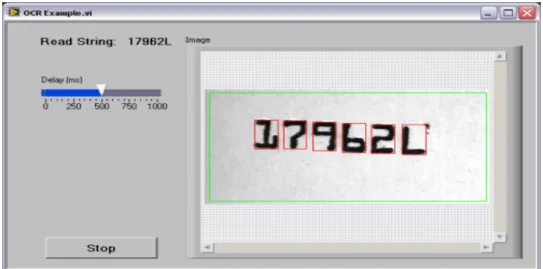
pedes-trians indicate their velocity and direction of movement, from (Opt, 2016). . . 41 2.9 An example of Optical Character Recognition, from (Opt, 2015) . . . 42 2.10 Pitch and Intensity Profiles for Male and Female Speakers. Image
comes from (Lou, 2016). . . 44 2.11 The spectral envelope of ani sound as pronounced by a male speaker.
F1, F2 and F3 are the first three formants. This image is taken from (MAURO ANDREA VOICE STUDIO - CANTO AULAS) . . . 46 2.12 Key Frame Extraction - This is a re-drawn version of the image from
2.13 Attributes of Video Skimming Techniques (Truong and Venkatesh,
2007) . . . 53
2.14 The 3 basic levels of fusion - from (Dumas et al., 2009) . . . 60
2.15 Multimodal Fusion: Strategies and Conventions. a) Analysis Unit b) Feature Fusion Unit c) Decision Fusion Unit d) Feature Level Mul-timodal Analysis e) Decision Level MulMul-timodal Analysis f) Hybrid Multimodal Analysis (Atrey et al., 2010) . . . 64
3.1 Full camera view of the stage . . . 69
3.2 Full camera view of the gallery . . . 70
3.3 Audience View - View of the audience to presentations, this is the view annotators had for judging audience engagement levels . . . 72
3.4 Presenter Close-up view - View of the presenter up close, this is the view that annotators had for annotating emphasised speech. . . 73
3.5 Image of the Annotation Tool used for human annotation of speaker ratings. . . 73
3.6 Example of Time Windowing of Video Segments . . . 75
3.7 Presenter: mid-Emphasis . . . 76
3.8 Two presenters jointly present a talk . . . 77
3.9 Annotators View: This is the view which annotators had for judging presentation rankings and for performing comprehension annotation tasks. . . 79 3.10 Screenshot from Super Lectures website which hosts all presentations
5.4 Plotted classifications over the full 7 class distribution. These are the results of late fusion of classifiers. The numbers along the x-axis are the video segment numbers, time-plotted over the full data-set. The numbers along the y-axis are the comprehension levels, ranging from 1 to 7. As explained by the legend, the solid blue line is the actual comprehension level for that segment while the broken red line is the
prediction for that segment. . . 154
5.5 Plotted classifications over the combined 4 class distribution. These are the results of late fusion of classifiers. The numbers along the x-axis are the video segment numbers, time-plotted over the full data-set. The numbers along the y-axis are the comprehension levels, rang-ing from 1 to 4. As explained by the legend, the solid blue line is the actual comprehension level for that segment while the broken red line is the prediction for that segment. . . 155
6.1 Visualisation of Video Summarisation Process . . . 166
6.2 Pleanaryoral2 full - heat map 1 . . . 178
6.3 Pleanaryoral2 full - heat map 2 . . . 178
6.4 Plenaryoral2 summary - heat map 1 . . . 179
6.5 Plenaryoral2 summary - heat map 2 . . . 179
6.6 prp1 full - heat map 1 . . . 180
6.7 prp1 full - heat map 2 . . . 180
6.8 prp1 summary - heat map 1 . . . 181
6.9 prp1 summary - heat map 2 . . . 181
6.10 prp5 full - heat map 1 . . . 182
6.11 prp5 full - heat map 2 . . . 182
6.12 prp5 summary - heat map 1 . . . 183
6.13 prp5 summary - heat map 2 . . . 183
6.15 speechRT6 full - heat map 2 . . . 184
6.16 speechRT6 summary - heat map 1 . . . 185
6.17 speechRT6 summary - heat map 2 . . . 185
6.18 Example Gaze Plot for Interpretation . . . 194
6.19 Plen 2 Full - Gaze Plots . . . 195
6.20 Plen 2 Summary - Gaze Plots . . . 196
6.21 Prp 1 Full - Gaze Plots . . . 197
6.22 Prp 1 Summary - Gaze Plots . . . 198
6.23 Prp 5 Full - Gaze Plots . . . 199
6.24 Prp 5 Summary - Gaze Plots . . . 200
6.25 SpeechRT 6 Full - Gaze Plots . . . 201
6.26 SpeechRT 6 Summary - Gaze Plots . . . 202
C.1 OpenCV functions . . . 243
C.2 OpenSMILE GUI . . . 244
C.3 Praat Screenshot. The Oscillogram (upper panel) and spectrogram (lower panel) of a sentence. . . 245
List of Tables
2.1 Visual Feature Detectors . . . 33
3.1 Data Collection Summary . . . 81
3.2 Final Annotated Engagement Levels . . . 81
3.3 Speaker Movements : Audience Engagement - Linear Correlations . . 81
3.4 Final Annotated Comprehension Levels . . . 81
4.1 Speaker Ratings Classifiers . . . 97
4.2 Audience Engagement Classifiers . . . 98
4.3 Speaker Ratings - Linear Correlation . . . 99
4.4 Engagement Levels Linear Correlation . . . 100
4.5 8-Class Speaker Ratings Classifier - 10FCV . . . 101
4.6 Audio-visual confusion matrix - 10FCV . . . 101
4.7 Audio-only confusion matrix - 10FCV . . . 102
4.8 Visual-only confusion matrix - 10FCV . . . 102
4.9 8-Class Speaker Ratings Classifier - LOOCV . . . 103
4.10 Audio-visual confusion matrix - LOOCV . . . 103
4.11 Audio-only confusion matrix - LOOCV . . . 103
4.12 Visual-only confusion matrix - LOOCV . . . 103
4.13 4-Class Speaker Ratings Classifier - 10FCV . . . 104
4.14 Audio-only confusion matrix - 10FCV . . . 104
4.15 Visual-only confusion matrix - 10FCV . . . 104
4.17 4-Class Speaker Ratings Classifier - LOOCV . . . 104
4.18 Audio-only confusion matrix - LOOCV . . . 105
4.19 Visual-only confusion matrix - LOOCV . . . 105
4.20 Audio-visual confusion matrix - LOOCV . . . 105
4.21 Audience Engagement Classifier - 10FCV . . . 106
4.22 Speaker-based only confusion matrix - 10FCV . . . 106
4.23 Audience visual & Speaker confusion matrix - 10FCV . . . 106
4.24 Audience visual-only confusion matrix - 10FCV . . . 106
4.25 Audience Engagement Classifier - LOOCV . . . 107
4.26 Audience-visual only confusion matrix - LOOCV . . . 107
4.27 Audience visual & Speaker confusion matrix - LOOCV . . . 107
4.28 Speaker-based only confusion matrix - LOOCV . . . 107
4.29 Speaker Ratings : Engagement - Linear Correlation . . . 109
4.30 Speaker Ratings - Emphasis : Linear Correlation . . . 116
4.31 Audience Engagement - Emphasis : Linear Correlation . . . 117
4.32 Audience Engagement - Emphasis : Linear Correlation . . . 118
5.1 Early-Fusion Comprehension Classification Results over 7 class dis-tribution - 10FCV . . . 137
5.2 Audio-only confusion matrix - 10FCV . . . 137
5.3 Audio-speaker visual confusion matrix - 10FCV . . . 138
5.4 Audio-Audience visual confusion matrix - 10FCV . . . 138
5.12 Early-Fusion Comprehension Classification Results over 7 class
dis-tribution - LOOCV . . . 141
5.13 Audio-only confusion matrix - LOOCV . . . 141
5.14 Audio-speaker visual confusion matrix - LOOCV . . . 142
5.15 Audio-Audience visual confusion matrix - LOOCV . . . 142
5.16 Audio-Slides confusion matrix - LOOCV . . . 142
5.17 Slides-only confusion matrix - LOOCV . . . 142
5.18 Emotion features-only confusion matrix - LOOCV . . . 143
5.19 Emotion Speaker-visual confusion matrix - LOOCV . . . 143
5.20 Emotion + Slides confusion matrix - LOOCV . . . 143
5.21 All features confusion matrix - LOOCV . . . 143
5.22 Early-Fusion Comprehension Classification Results over 4 class dis-tribution - 10FCV . . . 144
5.23 Audio-only confusion matrix - 10FCV . . . 145
5.24 Audio-Speaker Visual confusion matrix - 10FCV . . . 145
5.25 Audio-Audience Visual confusion matrix - 10FCV . . . 145
5.26 Audio Slides confusion matrix - 10FCV . . . 145
5.27 Slides-only confusion matrix - 10FCV . . . 145
5.28 Emotion features-only confusion matrix - 10FCV . . . 145
5.29 Emotion Speaker-Visual confusion matrix - 10FCV . . . 146
5.30 Emotion Audience-Visual confusion matrix - 10FCV . . . 146
5.31 Emotion Slides confusion matrix - 10FCV . . . 146
5.32 All features confusion matrix - 10FCV . . . 146
5.33 Early-Fusion Comprehension Classification Results over 4 class dis-tribution - LOOCV . . . 147
5.34 Audio-only confusion matrix - LOOCV . . . 147
5.35 Audio-Speaker Visual confusion matrix - LOOCV . . . 147
5.36 Audio-Audience Visual confusion matrix - LOOCV . . . 148
5.38 Slides-only confusion matrix - LOOCV . . . 148
5.39 Emotion features-only confusion matrix - LOOCV . . . 148
5.40 Emotion Speaker-Visual confusion matrix - LOOCV . . . 148
5.41 Emotion Audience-Visual confusion matrix - LOOCV . . . 148
5.42 Emotion Slides confusion matrix - LOOCV . . . 149
5.43 All features confusion matrix - LOOCV . . . 149
5.44 Early-fusion comprehension classification results over binary distri-butions - 10FCV . . . 150
5.45 Early-fusion comprehension classification results over binary distri-butions - LOOCV . . . 150
5.46 7-Class Classifier - Late-Fusion . . . 151
5.47 4-Class Classifier - Late-Fusion . . . 152
5.48 Binary Classifier - Late-Fusion . . . 153
5.49 Binary Classification - Rotation Forest - 10FCV . . . 156
5.50 Binary Classification - Rotation Forest - LOOCV . . . 156
5.51 Multimodal Features - Comprehension : Linear Correlation . . . 158
5.52 Multimodal Features - Comprehension : Linear Correlation . . . 158
6.1 Video Summary Lengths 1 . . . 167
6.2 Video Summary Lengths 2 . . . 168
6.3 Final Video Summary Percentages . . . 168
6.4 Totals per video, version, scene (V.V.S = Video,Version,Scene) . . . . 172
6.12 Eye-tracking Video 3 - scene by version . . . 176
6.13 Eye-tracking Video 4 - scene by version . . . 176
6.14 Statements ranked by participants . . . 186
6.15 Levels of Agreement . . . 186
6.16 Averaged rankings per video . . . 187
6.17 Averaged rankings per summary or full video . . . 188
6.18 Statements ranked by participants . . . 189
6.19 Levels of Agreement . . . 189
6.20 Averaged ratings per video . . . 190
6.21 Total ratings per type . . . 190
6.22 Statements rated a Likert scale by participants . . . 191
6.23 Likert scale Levels of Agreement to statements in Table 6.22 . . . 191
6.24 Likert scale level of agreement per summary type for each video . . . 192
6.25 Likert scale level of agreement per summary type for each video . . . 193
B.1 Eye-tracking Video 1 - slides scene compared by version . . . 232
B.2 Eye-tracking Video 1 - speaker scene compared by version . . . 233
B.3 Eye-tracking Video 2 - slides scene compared by version . . . 234
B.4 Eye-tracking Video 2 - speaker scene compared by version . . . 234
B.5 Eye-tracking Video 3 - slides scene compared by version . . . 235
B.6 Eye-tracking Video 3 - speaker scene compared by version . . . 235
B.7 Eye-tracking Video 4 - slides scene compared by version . . . 236
B.8 Eye-tracking video 4 - speaker scene compared by version . . . 236
B.9 Eye-tracking Video 1 - full scene compared by version . . . 237
B.10 Eye-tracking Video 1 - attention scene compared by version . . . 238
B.11 Eye-tracking Video 2 - full scene compared by version . . . 238
B.12 Eye-tracking Video 2 - attention scene compared by version . . . 239
B.13 Eye-tracking Video 3 - full scene compared by version . . . 239
B.15 Eye-tracking Video 4 - full scene compared by version . . . 240 B.16 Eye-tracking Video 4 attention scene compared by version . . . 241
Utilization of Multimodal Interaction Signals
for Automatic Summarisation of
Academic Presentations
Keith Curtis
Abstract
Multimedia archives are expanding rapidly. For these, there exists a shortage of retrieval and summarisation techniques for accessing and browsing content where the main information exists in the audio stream. This thesis describes an investigation into the development of novel feature extraction and summarisation techniques for audio-visual recordings of academic presentations.
We report on the development of a multimodal dataset of academic presentations. This dataset is labelled by human annotators to the concepts of presentation ratings, audience engagement levels, speaker emphasis, and audience comprehension. We in-vestigate the automatic classification of speaker ratings and audience engagement by extracting audio-visual features from video of the presenter and audience and training classifiers to predict speaker ratings and engagement levels. Following this, we investigate automatic identification of areas of emphasised speech. By analysing all human annotated areas of emphasised speech, minimum speech pitch and gestic-ulation are identified as indicating emphasised speech when occurring together.
Investigations are conducted into the speaker’s potential to be comprehended by the audience. Following crowdsourced annotation of comprehension levels during academic presentations, a set of audio-visual features considered most likely to affect comprehension levels are extracted. Classifiers are trained on these features and comprehension levels could be predicted over a 7-class scale to an accuracy of 49%, and over a binary distribution to an accuracy of 85%.
Presentation summaries are built by segmenting speech transcripts into phrases, and using keywords extracted from the transcripts in conjunction with extracted paralinguistic features. Highest ranking segments are then extracted to build pre-sentation summaries. Summaries are evaluated by performing eye-tracking exper-iments as participants watch presentation videos. Participants were found to be consistently more engaged for presentation summaries than for full presentations. Summaries were also found to contain a higher concentration of new information than full presentations.
Acknowledgments
I would first like to express my appreciation to my two supervisors, Professor Gareth Jones (of Dublin City University) and Professor Nick Campbell (of Trinity College Dublin). I have been lucky to have two such great supervisors.
I would like to thank Nick for his particular encouragement in the early days of my PhD studies as he encouraged me to think as a researcher, and for introducing me to the vast array of multimodal research in his lab in TCD.
I would like to thank Gareth for his continued support and advice and constant feedback. Gareth is always very supportive of his students and his advice has been invaluable, not just for my PhD thesis but for my career direction as a whole. Gareth’s advice and feedback was essential, not just in the preparation of this thesis, but in the preparation of all my publications throughout the course of my research. I would also like to thank my examiners Dr Kristiina Jokinen and Professor Noel O’Connor, and my independent chairperson Dr Alistair Sutherland for making my PhD defence a memorable experience. I also want to express to gratitude to my ADAPT and DCU colleagues, whose support and professionalism was essential in making my PhD studies such a memorable experience. I would also like to express my gratitude to all friends within our lab who assisted with frequent annotation requests, without which much of this work would not have been possible.
Chapter 1
Introduction
Large archives of multimedia content are currently being created increasingly rapidly, with enormous levels of consumption of the resulting archives. Every minute in 2017, 4.1 million videos were viewed on YouTube, 70,017 hours of video were watched on NETFLIX, 40,000 hours of music were listened to on Spotify and 46,200 new posts were made to Instagram.1 In this environment, it is a growing challenge to locate and browse content of interest in such multimedia archives - either in response to user queries or in freer or more informal exploration of content. Interactive browsing of multimedia archives to find relevant information can be extremely time consum-ing. While this is a challenging problem for multimedia including a video channel, this is particularly challenging for spoken content where a user must listen to the spoken audio track in a linear mode. This represents a growing challenge for access-ing content considered relevant or of interest to users of multimedia archives where the significant information is in the audio of the multimedia file such as lectures, presentations etc., of which archives are growing rapidly.
Current methods for accessing and browsing digital video archives include scene type classification (Bosch et al., 2008) for named places, matching to low level fea-tures such as colours (Zhao and Grosky, 2002), or shape and texfea-tures (Rui et al., 1998; Chang and Smith, 1995). For finding relevant content, research has
ily focused on matching text queries against written metadata or transcribed audio (Chechik et al., 2008). These methods are limited by available low-level metadata descriptions and transcripts when browsing content such as lectures or presentations, where typically little information is available in the visual stream and most of the information exists in the audio track. The work described in this thesis contributes to addressing these limitations by classifying high-level paralinguistic features in such content, which can then be used for summarising lectures or presentations.
In order to address the problems of efficient engagement with this content, in this work we seek to classify paralinguistic features from within audio-visual pre-sentations, and investigate the potential for the use of these high-level features for automatic summarisation of presentations.
In this chapter we introduce the subject of the thesis, along with the motivations of the work and main research objectives. An overview of the research problem is first introduced. Following this, the main objectives of this research are introduced. We then introduce the Research Questions which are the focus of this thesis. An overview of the structure of the remainder of the thesis then follows.
1.1
Motivation
There are a growing number of online archives of audio-visual presentations and lectures. Typically a user will watch these from the start in a linear fashion through to the end of the video. This serves the needs of a typical user, who may be learning
are time consuming and inefficient.
Many users do not want to take the time to view full presentations and lectures, particularly if they are unsure as to whether the material is going to be of interest to them, or if much of the material is not of direct interest to them. Author-generated abstracts can be helpful in aiding the user to decide if the material is to be of benefit for them, however, most presentations and lectures are not accompanied by such abstracts. Even in cases where these are provided, the lecture or presentation may be too long for the user to commit to watching the presentation in its entirety. An alternative to viewing a video in its entirety is to engage with a summary of the key elements of the video.
Current video summarisation methods typically focus on the visual stream for event and salience detection. These summarisation methods do not cater well for material such as presentation and lecture videos where most of the information exists in the audio stream. In this regard, we consider the possibility of automatically classifying parts of presentations to high-level concepts familiar to humans, such as audience engagement and potential comprehensibility and emphasised speech.
We hypothesise that access to audio-visual lectures and presentations can be improved by automatically identifying areas considered to be the most engaging, emphasised or of most potential comprehensibility for the viewer. Automatically classifying areas of presentations considered most engaging and comprehensible for the audience could be used to implement techniques for the automatic generation of user summaries. These can give users a full overview of the presentation in question, allowing them to decide if that presentation is of interest to them. Based on that information, users can decide whether to watch the full presentation or to generate and watch a short summary of the presentation.
The automatic generation of presentation and lecture summaries would enable people to watch these to gain a quick overview of the material in question and see if it is going to be of interest and relevant to them. Thus less time would be wasted watching presentations and lectures not of interest or relevant to the user, while for
relevant and interesting material the user could decide whether to watch the full presentation or to instead watch a longer, more in depth automatically generated summary of the material.
The personal motivation for the choice of features chosen for this research comes from the recording of the presentations. Having set out with the intention to develop a set of methods to improve summarisation of presentations, we recorded the data set used in this thesis as described in Chapter 3. During one of the presentations of this data set in particular there was obvious great interest / engagement from the audience. This led me to wonder if it would be possible to automatically detect such presentations which are greatly engaging for the whole audience and whether the speaking techniques of the presenter encouraged the interest. Following the work on engagement, the concept of comprehension, how much the audience can actually understand the content, and spoken emphasis, areas of speech specifically empha-sised by the presenter of having specific importance, seemed the natural follow-up to the question of engagement / interest.
1.1.1
Example Use-Case 1
Emily is a researcher and wishes to watch recordings of recent conference presenta-tions which she has missed. However, Emily is very busy and does not want to waste time watching presentations which are of no interest to her. There are a number of presentations which may potentially be of use to her work.
her work.
Emily decides to generate two longer, in-depth summaries of the talks for which she does not want to commit to watching the full presentations. She then watches these longer summaries in addition to the full talk which she had committed to watching.
1.2
Overview
The main aim of the work described in this thesis is to investigate the creation of efficient and effective mechanisms to summarise audio-visual recordings where the significant information is in the audio stream. Current research on multimedia information retrieval has focused primarily on matching text queries against written metadata or transcribed audio (Chechik et al., 2008), on matching visual queries to low-level features such as colours (Zhao and Grosky, 2002; Niblack et al., 1993), textures and shape (Rui et al., 1998; Chang and Smith, 1995), and object recognition and person recognition (Marszalek and Schmid, 2007; Aslandogan and Yu, 1999; Cheng et al., 1998), in addition to scene type classification (Bosch et al., 2008; Szummer and Picard, 1998) - urban, countryside, and named individuals or places etc. (Huiskes et al., 2010; Xiao et al., 2010; Gallagher and Chen, 2009).
In the case of multimedia content where the information is primarily visual, the content can be represented by multiple key frames extracted from the video, using methods such as object recognition and facial detection. These are then matched against visual queries, and the retrieved videos are shown to the user using keyframe surrogates, with the user playing back those full videos that they believe to be relevant to their information need. Matching of the visual component of these queries is generally complemented by textual search against a transcript of any available spoken audio and any other metadata provided with the video (Lew et al., 2006).
for which spoken content provides additional or complementary information to the visual information stream. However, for significant amounts of multimedia content, the information that they contain is not primarily visual, e.g. public presentations such as lectures, which largely focus on a single speaker talking at length on a single topic, or meetings, where multiple speakers discuss a range of previously selected issues. Text-based searching of a transcript of recorded speech may find a relevant recording, but there is currently a lack of support to assist users in finding con-tent most likely to be engaging and interesting for them. To help users avoid large amounts of inefficient browsing of retrieved content, how might we assist them to decide which parts to review? In the context of multi-topic items, even identify-ing the most relevant recordidentify-ings may be difficult due to the general challenge of searching content covering multiple topics. How might we help the user to locate the most significant items? In this research, we aim to extend the state of the art in multimedia search, taking the research in a new direction by utilising non-verbal communication signals in order to enable users to more efficiently access content rel-evant to their information needs contained in multimedia archives. We propose to fuse and analyse non-verbal audio and visual signals to provide features identifying information which will be of interest to searches looking for relevant content. Rather than standard work in Multimedia Information Retrieval (MIR), which investigates search methods to find relevant documents, our work focuses on investigation of individual relevant multimedia documents to explore methods to identify areas that are likely to be of particular interest to searchers.
than meetings, with typically just one or two presenters speaking in front of a large audience. For this reason we conduct the research described here on a data-set of academic presentations, consisting of video of the presenter and corresponding video of the audience.
For classification of the features of engagement and comprehension we include behaviours of the audience during presentations such as movements, attendance at talks and the numbers facing forward towards the speaker or the presentation slides. We have not included post-presentation questions from the audience in this analysis, which are also indicative of engagement, primarily because the purpose of this work is to summarise the presentation itself by the most engaging, comprehensible parts. While questions from the audience following a presentation are useful indicators of engagement in itself, they often do not indicate the parts of a presentation in which audience participants were most engaged. Questions also do not form a part of summaries and thus have been excluded from the analysis.
1.3
Objectives
The objectives of this research project is to provide an advanced video summarisation method, which can be used to enhance the experience of users wishing to review academic presentations. As will be expanded upon in the following chapter, current automatic video summarisation techniques remain quite limited, particularly for viewing academic presentations and lectures, as most of the information in these aspects exists in the audio stream with very little in the way of visual stimuli, which are typically used for summarisation of video.
To accomplish this we investigate whether it is possible to classify higher level concepts than those typically classified for the summarisation of video, namely we investigate whether it is possible to build classifiers to identify the normally sub-jective terms of ‘good’ speaking techniques, audience engagement, intentional or unintentional speaker emphasis, and areas of potential comprehensibility for the
au-dience. To this end we develop a dataset of academic presentations, recorded at an international conference related to speech.
We first aim to develop a technique to accurately classify areas of speech which humans regularly consider to be ‘good’ speaking techniques. While there exists a number of guidelines for public speakers on this topic, this remains a very subjective concept, with people regularly having their own ideas on what represents a ‘good’ speaker. As this is such a subjective topic, we engage human annotators to provide ratings for the presenter throughout the data set. We then seek to use these infor-mation annotations to predict audience engagement levels for such presentations. Human annotators label engagement levels throughout the video. By using auto-matically extracted low-level audio-visual features, we attempt to train a classifier to automatically predict speaker ratings and audience engagement.
We investigate the development of methods to identify areas of intentional or unintentional emphasis by the presenter, and to assess whether these areas show correlation with areas of high audience engagement, as identified by human anno-tators.
The logical next step in this line of research leads us to investigate potential audience comprehension of academic presentations. As engagement asks the ques-tion as to how much the audience are paying attenques-tion and mentally involved in the presentation, comprehension asks the question of how much the audience can actually follow and understand the material in question. While much of this is de-pendant on the prior experience and knowledge of the individual audience member,
user is more likely to find engaging and comprehensible. This application directly addresses the motivation for this work, introduced in Section 1.1.
We provide a user-focused evaluation of our automatically generated video sum-maries. As the core part of this evaluation, we will request human participants to take part in eye-tracking evaluations of automatically generated presentation sum-maries and full presentations. With good, engaging, and comprehensible sumsum-maries, we would expect participants to keep their focus for longer periods than for full pre-sentations, which we can evaluate from participants’ focus. We would also expect that good summaries would result in participants being highly engaged as they watch the summaries. By comparing the number and duration of fixations we can evaluate whether participants are highly engaged for presentations summaries, and particu-larly whether or not they are more highly engaged than for full presentations. We provide further evaluation of summaries by crowd-sourcing questionnaires on presen-tation summaries and by polling participants on their ease of use and effectiveness for gaining a quick overview of the content of the video.
1.4
Research Questions
The preceding overview, which outlines the motives and primary objectives for this research leads to the following hypothesis: Social signals on the part of a presenter / speaker can be utilised to train classifiers which can be used to identify concepts such as audience engagement, strengths of the presenter, intentional or unintentional emphasis of speech, and the speaker’s potential to be comprehended / levels of under-standing among the audience to academic presentations and lectures, and that such classifiers can be utilised to provide novel and effective features for summarisation of such video content.
To explore the detailed elements of this hypothesis, we have identified the fol-lowing five research questions to be addressed in this research:
pro-vide a method for prediction of audience engagement and interest by analysing the speaking skills of the speaker in multimodal content. Previous work (Bednarik et al., 2012; Oertel and Salvi, 2013; Bonin et al., 2012; Gatica-Perez et al., 2005) in engage-ment detection has focused mainly on the annotation and detection of engageengage-ment in conversations. Other authors, (Whitehill et al., 2014; Jang et al., 2014) report work on engagement detection in multimodal learning environments. Other studies (Bohus and Horvitz, 2014; Corrigan et al., 2014) focused on engagement detection in human-robot conversation. In our work we study audience engagement with presentations given in academic conferences.
Meanwhile, previous studies on good public speaking techniques (Strangert and Gustafson, 2008; Strangert, 2007; Chen et al., 2014) focused on extracting the most influential, mainly acoustic, features associated with good public speaking skills. Other work (Liscombe et al., 2003) was performed on the detection of emotional speech. We study the features of speech that humans consider to be good speaking techniques and explore the training of a classifier for these features.
• Research Question 1 (RQ-1): Can we build a classifier to automatically rate the qualities of a good public speaker?
• Research Question 2 (RQ-2): Can we build a classifier to automatically pre-dict the levels of audience engagement by utilising speaker-based and visual audience-based modalities?
sation. Following this work, (Kennedy and Ellis, 2003) studied emphasis detection for characterisation of meeting recordings. In this work, five human annotators la-belled 22 minutes of audio from the ICSI meeting corpus. To do so, transcripts were given to annotators to account for context, while annotators marked ‘neutral’ or ‘emphasised’ for each utterance. Pitch versus Time was extracted for each of the speakers in the meeting, and the corresponding mean and standard deviation were calculated. In cases where four or more human annotators agreed on emphasised speech, accuracy rates of 92% were achieved. In addition, the utterances found to be the most emphasised were rated by annotators as a good summarisation of the meeting recording.
In this thesis, we investigate correlations between fine-grained audience engage-ment and areas of emphasised speech. This will provide insights into the effects on the audience of emphasised speech during presentations. Positive correlations in this regard along with positive detections of emphasised speech may provide us with ev-idence to rate changes in audience engagement at the fine-grained level within talks, also providing evidence of the importance of these areas of emphasis as perceived by the audience at the time of the presentation.
• Research Question 3 (RQ-3-1): Can visual and acoustic stimuli on the part of the speaker be utilised to discover areas of special emphasis being provided by the speaker to indicate important parts of their presentation?
– Secondary RQ (RQ-3-2): If we can detect spoken emphasis, is there a relationship between speaker ratings and emphasised speech, and between audience engagement and emphasised speech?
Another dimension of presentations is their potential to be comprehended. The concept of audience comprehension has to date not been studied in the domain of academic presentations or lectures. However, other studies have been performed on spoken language comprehension. (Tanenhaus et al., 1995) used eye-tracking to
spoken language comprehension. The effect of the design of presentation slides on audience comprehension was studied by (Garner and Alley, 2013). In this work they tested the effect on audience comprehension of slides that adhered to six multime-dia principles versus slides that followed commonly practised defaults in Microsoft PowerPoint. Language comprehension in children was studied by (Haake et al., 2014), who observed that a faster speech rate had a negative effect on children’s language comprehension while a slower speech rate had a positive effect. A study of comprehension of non-native speakers was performed by (Lev-Ari, 2014), who used eye-tracking to show that when following instructions from non-native speakers, lis-teners make more contextually-induced interpretations. The author also suggests that those with relatively strong working memory also tend to increase their re-liance on context to anticipate the speaker’s upcoming reference and are less likely to notice lexical errors in non-native speaker’s speech.
• Research Question 4 (RQ-4-1): Can we utilise visual and acoustic stimuli to train a classifier to automatically identify levels of comprehension among the audience to a presentation?
– Secondary RQ (RQ-4-2): If we can classify levels of audience comprehen-sion, is there a relationship between audience engagement and audience comprehension?
Current summarisation of academic presentations relies on the words spoken. In this thesis we explore the inclusion of automatically classified paralinguistic features,
tion to pause information to avoid selecting segments which start mid-phrase. They also garnered information from slide transition points to indicate the introduction of a new topic or sub-topic. They developed three summarisation algorithms for slide transition based summary, pitch activity based summary and summary based on slide transitions, pitch activity and user-access information. The approach out-lined in this thesis goes beyond this by including areas of emphasis, high audience engagement and potential comprehensibility in generated summaries.
An enhanced digital video browser was developed and evaluated in (Li et al., 2000). This evaluated the effectiveness of the following enhanced browser controls - Time Compression (TC), Pause Removal (PR), Table of Contents (TOC), Shot Boundary (SB), Timeline markers and jump controls. We use this idea of enhanced browser controls for further evaluation of generated summaries by comparing auto-matically generated summaries to the use of such enhanced digital video browsers for gaining a quick overview of the presentation. (Joho et al., 2009) captured and analysed the user’s facial expressions for the generation of perception-based sum-maries which exploit the viewer’s affective state, perceived excitement and attention. Perception-based approaches are designed to overcome the semantic gap problem in summarisation, the rich meaning expected by a user versus the shallowness of au-tomatically extracted content descriptions, by finding affective scenes in video. Our approach attempts to bridge this semantic gap by detecting and including in sum-maries areas of high engagement and comprehensibility for an audience. A set of tools for creating video digests of informational video is described in (Pavel et al., 2014). Informal evaluation suggests these tools make it easier for authors of infor-mational talks to create video digests. (Chen and Withgott, 1992) studied the use of emphasis for automatic summarisation of a spoken discourse. Emphasised speech from one speaker was detected and summarisation excerpts were extracted with no noticeable differences with human extracted summarisation excerpts. A HMM was used for training the emphasis detection model. Our approach extends this work by including highly engaging and comprehensible areas of presentation in addition to
detected areas of emphasis.
• Research Question 5 (RQ-5): Can areas of special emphasis provided by the speaker, combined with detected areas of high audience engagement and high levels of audience comprehension, be used as a component in the effective summarisation of academic presentations?
1.5
Structure
The remainder of this thesis is structured as follows:
Chapter 2provides a literature survey of related work. We provide an overview of current audio and visual feature extraction techniques. These techniques are re-viewed to discover which of these are most useful for work of the nature examined in this thesis. Following this a review of previous work in the area of video sum-marisation is provided, including the two basic approaches of keyframe extraction and video skims. A short introduction to multimodal signal fusion is then pre-sented, including common techniques and challenges for the fusion of multimodal data signals. Previous work is also introduced on the classification of the concepts of audience engagement, ‘good’ speaking techniques, speaker emphasis and audience comprehension.
In Chapter 3, an introduction is provided to the multimodal dataset we de-veloped for use in this research. This is a collection of audio-visual recordings of academic presentations from an international conference. The conference, venue,
an investigation into the identification of emphasised content during presentations and explore potential correlations between areas of intentionally or unintentionally emphasised speech and fine-grained audience engagement levels.
In Chapter 5, we report on the prediction of comprehension levels among the audience to academic presentations. This chapter describes the experiments per-formed and results achieved. We experiment with different fusion techniques and demonstrate how the decision-level fusion (post-fusion) of selected pre-trained clas-sifiers can improve classification accuracy. We also demonstrate the problem of predicting a presenter’s potential to be comprehended by an audience. This chapter experiments with the use of feature-level fusion and decision-level fusion techniques for the fusion of multiple modalities.
Chapter 6 reports on the development of automatically generated video sum-maries based on the methods introduced in Chapters 4 and 5. Techniques used in this summarisation strategy and reasoning for these are described. An evaluation of summaries is performed, including eye-tracking evaluation, and the comparison of automatically generated presentation summaries with video skim techniques previ-ously found by (Li et al., 2000) to aid users gain a quick overview of presentations and lectures for further evaluation. Evaluations are also performed to compare usage of a subset of all available features.
Chapter 7 provides final answers to the research questions addressed in this thesis in addition to conclusions from this research and suggests some future research directions which could further advance this work.
Appendix A, B & C We provide a list of all publications emanating form this work. Following this, we provide additional results to the experiments conducted in Chapter 6. Additional technical information on the tools used during the course of this research is also provided.
Chapter 2
Background Review
In this chapter we provide a review of previous work related to the topics investigated in this thesis. We begin by reviewing work in the area of non-verbal communication. This leads into our review of work directly related to the topics investigated in this thesis. Following this, we review work in the area of visual and audio feature extraction. We then review work in the area of video summarisation and take a look at the two main approaches to summarisation of video: keyframe extraction and video skims. Following this, we undertake a review of the main challenges involved in multimodal signal fusion.
2.1
Non-Verbal Communication
Non-verbal communication includes any non-speech communicative acts intended to portray some meaning. Typical non-verbal communications include facial
ex-expressions.
The broad definition of non-verbal communication includes any kind of non-verbal messages or non-verbal signs proper to informative processes. A narrow definition restricts it to non-linguistic phenomena that are inter-related, often in an intricate way, with verbal language and can be found in interactive or communicative processes.
(Payrat´o 2009:164)
(Dynel, 2011) reviewed the work of (Grice, 1991) and others on non-verbal com-munications from the narrow definition pertaining to human communication via body language. One of Grice’s key tenets is that intentionality underlies non-natural meaning as opposed to natural meaning. He uses the latter term in reference to any stimulus which conveys some information.
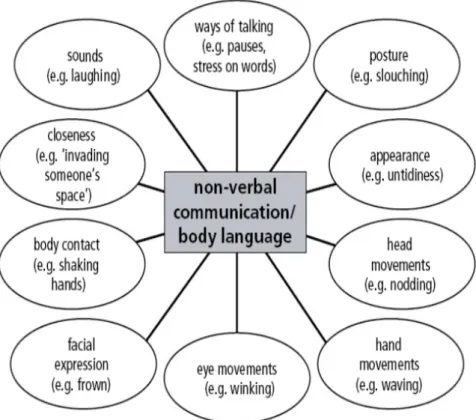
Some researchers e.g. (Morris and Morris, 1977; Gibbs, 1999; Payrat´o, 2009) distinguish between several constituents of non-verbal communication:
• polemics (physical distance in communication: intimate, social, personal, pub-lic)
• chronemics (communication time)
• haptics (touch in communication)
• kinesics (movement, posture, gesture, facial expression, gaze)
• para-language (non-verbal speech aspects, prosody)
• olfactics(smell)
• oculesics (eye movement)
• physical appearance (clothing, hairstyle etc.)
The two most frequently discussed categories of non-verbal communication are para-language and kinesics.
• Para-language - the audio aspects such as pitch, intensity and fluency of speech etc., are particularly important aspects for speaker ratings, engagement, em-phasis of speech and the comprehensibility of a presentation.
• Kinesics - the movement, gesticulation, gaze and posture of a speaker is partic-ularly important to determining the engagement of a presentation, emphasised parts of speech, and may also play a key role in the comprehensibility of a pre-sentation.
Gestures, a common form of non-verbal communication, are defined as body activities (non facial) which do not include postural, spatial or orientational ac-tions. (Kendon, 2004) endorses a continuum of gestures ranging from gesticulation, language-like gestures, pantomimes, emblems and sign language. This continuum shows a decline in importance of accompanying speech. In turn, the continuum shows an increase in gestures’ likeness to utterances. As one of the most common forms of nonverbal communication, we need to estimate a speaker’s gesticulation to be able to make inferences as to the overall interestingness / comprehensibility of a presentation.
Gesticulation is a seemingly spontaneous, unrehearsed body activity which co-occurs with speech, and is perceived as forming an intimate part of the total utter-ance (McNeill, 1992). Gesticulatory movement obligatorily accompany speech and
Figure 2.1: Types of non-verbal communication, from (Non, 2014)
using their finger to mimic a toothbrush while acting out brushing their teeth. Both language like gestures and pantomimes may entail the use of objects. A distinct sub-type is distinguished from language like gestures and pantomimes, namely deictic, or pointing gestures, which index referents.
Emblems or quotable gestures are coded gestures emerging through convention-alisation processes. Emblems may derive from gesticulation or illustrators which have undergone conventionalisation. An example could be a presenter making quo-tation emblems with their fingers during a presenquo-tation whilst saying “good”, which would more accurately mean ‘commonly perceived as good’. Emblems are used in place of their verbal counterparts and enjoy conventional meanings. Figure 2.1 above summarises different types of non-verbal communication.
2.2
Background and Related Work
This section reviews prior work directly relating to the topics investigated in this thesis. This will look at what has already been studied, what has yet to be inves-tigated, and how the prior work informs our decision making. We look at previous work in the area of public speaking skills, engagement detection, emphasis detection and audience comprehension.
2.2.1
Rating of Public Speaking and Presentation Skills
In this section we review existing research in public speaking and presentation skills. We first look at investigations examining what constitutes good speaking techniques. Previous work has studied what people popularly perceive to be ‘good’ public speak-ing skills, extracted features from the audio track and evaluated the correlation with these features and human judgements (Strangert and Gustafson, 2008; Chen et al., 2014; Liscombe et al., 2003). We also look at previous work in the area of en-gagement detection, most commonly performed in a multimodal meeting context. Separate studies have looked at engagement detection, most commonly in meetings and usually through the modalities of eye-gaze and facial expressions.(Strangert and Gustafson, 2008) looked at qualities of a good public speaker in the context of political speech. Human annotators listened to clips of politi-cal speeches from the Swedish parliament and rated the qualities of each speaker according to a number of statements about that speaker. Acoustic measurements
weight.
An assessment of good public speaking skills was performed by (Chen et al., 2014) who extracted multimodal cues and evaluated the linear correlation with human holistic scores - overall grades applied to speaking skills. In this work they found that simple multimodal features of the speech content, speech delivery and non-verbal behaviours together can predict human scores on presentation performance with significant accuracy. Features of the content of speech were extracted using a syntactic complexity analyser tool on speech transcripts (Lu, 2010). This tool counts the frequencies of nine types of syntactic structures e.g., verb phrases, clauses etc., and computes fourteen syntactic complexity values such as mean length of clause.
(Liscombe et al., 2003) trained a classifier on emotional speech using acoustic features. In this work they used an emotional speech corpus compiled using eight professional actors. Subjects listened to emotional speech samples and expressed a judgement on the emotion being expressed. The automatically extracted features include min F0, max F0, mean F0, F0 range, F0 standard deviation, minimum am-plitude, maximum amam-plitude, mean amam-plitude, range amam-plitude, standard deviation amplitude, ratio of voiced samples to total segments and mean syllable length, spec-tral tilt, contour and type of nuclear accent. They found that F0, RMS, and speaking rate are good at distinguishing emotions on the grounds of activation. However, this study also found that spectral tilt and type of phrase accent and boundary tone may be useful in discriminating between the valency of emotions, with friendly, happy and encouraging falling into one category and angry and frustrated into another.
A multimodal virtual audience platform was developed by (Batrinca et al., 2013) for public speaking training. In this work they use professional public speakers in-vited from toastmasters to rate the qualities of presentations using audio and visual stimuli. They found several expert estimates of non-verbal behaviour to be signifi-cantly correlated with an overall assessment of a presenters performance. Assessed behaviours of presenter’s in this work include flow of speech, clear intonation, in-terrupted speech, speaks too quietly, vocal variety, paces too much, gestures to
emphasise, gestures too much, gazes at audience and avoids audience.
Toastmasters International have published a practical guide to becoming a bet-ter speaker (Inbet-ternational, 2015). In this they emphasise the importance of body language. According to this guide, not only does body language communicate con-fidence and power, but enhances your believability and emphasises points you are making. Body language is expressed in stance, movement, gestures, facial expres-sions and eye-contact. They also emphasise the importance of vocal variety, such as volume (Intensity), pitch and speech rate. A speech rate which is too fast will cause the audience to not be able to keep up, which a speech rate which is too slow will cause the audience to lose interest. Variety in both loudness and pitch is also important for maintaining the audiences attention.
A speaker’s stance, facial expressions and eye-contact are outside of the scope of this thesis due to the difficulty in extracting these features. In this work we focus on the extraction of movement, gestures, volume, pitch and speech rate.
2.2.2
Detection of Engagement
In this section we look at previous work on engagement detection and the relation-ship between group-level and individual-level engagement.
(Oertel et al., 2011) aim to better understand the dynamic changes in human interaction in order to add social information to speech technologies. They studied automatic detection of involvement in conversation through measuring body move-ments and voice features. Involvement was annotated on a scale of 1-10, though
following, responding, conversing, influencing, managing) annotated over 15 second intervals using two annotators. In this they focused on the individual within the group rather than the group as a whole. In this work they found that gaze behaviour differs during distinct levels of conversational engagement. They built an SVM clas-sifier using gaze-based features which correctly predicts engagement to 74%. They found that with increasing activity and engagement in discussion, the mean fixation duration drops and there is also a decrease in the number of fixations.
Group involvement was contrasted with individual engagement by (Bonin et al., 2012), who annotated conversational engagement at an individual level and at the group level, and relate individual involvement with group level engagement. No prior examples of engagement levels were provided to annotators so as not to influence their interpretations. Annotators watched the video once per speaker and marked any changes of involvement at either the individual or group level. From their annotations it became clear to analysts that certain participants seemed to be more important in the perception of group involvement with respect to others.
This work was extended by (Oertel and Salvi, 2013) who based their analysis on an increased 8-party conversation and proposed a new set of features using eye gaze to relate group involvement to individual engagement. In this work participants rated their own engagement levels. They found that it was possible to estimate individual engagement and group involvement by analysing the participants eye gaze patterns. They built a classifier able to distinguish between four classes, low, high, lead and organising, of group involvement with an accuracy of 71%.
(Grafsgaard et al., 2014) analysed the additive effect of multimodal features for predicting engagement, frustration and learning in the study of introductory com-puter programming tutoring in which tutors communicated with students through a text-based interface. They found large improvements from the unimodal (dialogue, nonverbal, task) set to the bimodal (dialogue * nonverbal, dialogue * task, nonver-bal * task) set and from the bimodal set to the trimodal (bimodal union, dialogue * nonverbal * task) set. The complete trimodal set of features was found to be the
most predictive.
Group engagement detection in multimodal meetings was performed by (Gatica-Perez et al., 2005). In this work annotators were asked to label 15 second intervals from 4-party meetings according to 5 levels of engagement. Audio features, including energy, pitch and speaking rate, and visual features, including global person motion, eccentricity and pose, were extracted from the multimodal corpus. Hidden Markov models (HMM’s), a statistical Markov model in which the system being modelled is assumed to be a Markov process with hidden states, were used to detect segments of high and neutral group interest levels. In this work they found that audio only modalities performed better than visual only modalities. (McCowan et al., 2005) use HMM’s to examine the relationship between individual and group level engagement. In this they made use of visual and acoustic features with no eye gaze information. They found that it is important to model the correlation between the behaviour of different participants and that there is evidence of asynchrony between participants acting within the group actions.
The automatic recognition of student engagement was studied by (Whitehill et al., 2014) from analyses of facial expressions. Undergraduate students had their faces recorded while using a cognitive skills training software application installed on an iPhone. For evaluation they used undergraduate and graduate students of computer science and psychology to rate the engagement level of each student using the software application based on their recorded facial expressions. They found that observers rely on head pose and elementary facial actions like brow raise, eye closure
ation they found that a C4.5 decision tree classifier with time window length of 1 second performed best.
From the above cited previous work on speaking techniques and on engagement / involvement detection we can see that audio-visual features have been shown to be effective for building a classifier to automatically predict speaking traits. Engage-ment detection has not been studied as yet in the context of academic presentations. In this work we seek to address this gap in existing work by constructing a classifier to predict speaker ratings for each presenter. Further, we explore the development of a classifier intended to predict audience engagement by extracting audio-visual fea-tures from the presenter in addition to the audience, and fusing with automatically classified ratings of the speaker.
2.2.3
Emphasis Detection
In this section we review existing research related to our work on emphasis detection. The use of emphasis for automatic summarisation of a spoken discourse was studied in (Chen and Withgott, 1992). Emphasised speech from one speaker was detected and summarisation excerpts extracted with no noticeable differences from a baseline of human extracted summarisation excerpts. Two sources of data were used for this investigation, a 27 minute long videotaped interview between two primary speakers and the second was a set of phrases extracted from telephone conversations, developed under a DARPA program. The emphasis detector was based on a Hidden Markov Model in which a separate model was created for each of the 3 levels of emphatic speech, unemphatic speech and background speakers.
Pitch based emphasis detection for automatic segmentation of speech recordings was explored in (Arons, 1994). Their initial investigation was based on recordings of talkers introducing themselves and presenting a 10 to 15 minute summary of their background and interests. A dialogue was transcribed and manually annotated with paragraph breaks and emphasised regions by a linguist. Based on preliminary anal-ysis and investigations, a pitch threshold of the top 1% of pitch values was chosen,
in which case speech segments with pitch values exceeding this threshold were classi-fied as emphasised speech. This threshold was selected as a practical starting point, which could be varied to find more or less emphasised regions. From this, the pitch based segmentation technique could be used to summarise the speech recordings into the most important speech segments. Three monologues were segmented using this technique, and were highly correlated with topic introductions, emphasised phrases and paragraph boundaries in the transcript annotated by the linguist.
(He et al., 1999) attempted to summarise audio-visual presentations by exploiting information in the audio signal, knowledge of slide transition points, and informa-tion about access patterns of previous users. In this work they found that overlap between pitch-based segments and author-generated segments performed no better than would be achieved by random chance. From this, it appears that audio-visual presentations may be less susceptible to pitch based emphasis analysis than the au-dio stream only, or that spoken emphasis did not truly correspond to semantically important material.
Following on from this work, (Kennedy and Ellis, 2003) studied emphasis de-tection for characterisation of meeting recordings. In this work they had 5 human annotators label 22 minutes of audio from the International Computer Science In-stitute (ICSI) meeting corpus (Morgan et al., 2001). Annotators were given both an audio recording and a transcript from the meeting in which the annotators listened to the audio recording while working their way through the transcript and marking each utterance as emphasised or not. The authors extracted pitch and aperiodicity
thresholds in the top 1 percentile were reliably found to have been emphasised by human assessors. However, (He et al., 1999) indicate that emphasis in audio-visual recordings is indicated by more than just notable increases in pitch in the audio stream, though findings by (Kennedy and Ellis, 2003) concluded that utterances found to be most emphasised represented a good summary of audio-only recordings of meetings. As this previous work shows a possible difference between emphasis in the audio-only stream and the audio-visual stream, in our study we investigate use of audio-visual features to detect emphasis in academic presentations.
2.2.4
Audience Comprehension
In this section we review existing research in audience comprehension. In preceding sections, we have already looked at investigations into what constitutes ‘good’ public speaking techniques and engagement. We now look at the small amount of previous work in the area of audience comprehension. We conclude this section by outlining how our work seeks to extend this earlier research.
Eye-tracking was used in (Tanenhaus et al., 1995) to study the effects of relevant visual context on the mental processes that accompany spoken language compre-hension. We consider that this could also relate to an audience as they garner the visual context from presentation slides whilst listening to the presentation speech. They show that in natural contexts, people seek to establish visual reference with respect to their behavioural goals from the earliest moments of linguistic processing. Moreover, referentially relevant non-linguistic information immediately affects the manner in which linguistic input is initially structured.
How the design of presentation slides affects audience comprehension was stud-ied in (Garner and Alley, 2013). In this work they tested the effect of slides which adhered to six multimedia principles on audience comprehension versus slides which instead followed commonly practised defaults in Microsoft PowerPoint. The slides which adhered to the six multimedia principles followed the assertion-evidence ap-proach. This is an approach to creating and delivering presentations by building a
talk on messages, not topics, to support these messages with visual evidence, not bullet lists, and to explain this evidence by fashioning words on the spot. Partici-pants were required to relate the process of Magnetic Resonance Imaging (MRI) in an essay. Essay responses from 110 engineering students revealed superior compre-hension levels and fewer misconceptions for the assertion-evidence group in addition to a lower perceived cognitive load. Cognitive load was self-rated by students as their perceived mental effort on a 7-point scale.
Language comprehension in children was studied by (Haake et al., 2014), who observed that a faster speech rate had a negative affect on children’s language com-prehension using the Test for Reception of Grammar, version 2 (TROC 2) (Bishop, 2009), while a slower speech rate had a positive affect. However, for more difficult test items in TROC 2, the benefits of a slower speech rate were only pronounced for the children who had scored better on a working memory test.
A study of comprehension of non-native speakers was performed by (Lev-Ari, 2014) who tracked eye movements of participants to show that when following structions from non-native speakers, listeners make more contextually-induced in-terpretations, increasing their reliance on context rather than depending on the speakers language alone. The author also suggests that those with a relatively strong working memory also tend to increase their reliance on context to anticipate the speaker’s upcoming reference and are less likely to notice lexical errors in the non-native’s speech, indicating that they take less information from the non-native speaker’s language.
fusion strategies for work of this nature. We also calculate correlations between comprehension and audience engagement in order to study potential relationships between these two concepts.
To the best of our knowledge, no current work exists which attempts to classify potential audience comprehension of audio-visual material or to relate this concept to audience engagement.
2.2.5
Academic Presentation Summarisation
In this section we look at related work on the summarisation and skimming of academic presentations.
The use of motion estimation techniques for analysing and annotating video recordings of technical talks was investigated in (Ju et al., 1998). They used a robust motion estimation technique to detect key frames and segment the video into sequences containing a single slide. For image sequences corresponding to a particular slide, stabilisation is warping each of the images towards a reference image, taking into account the cumulative motion estimated between each of the frames in the sequence. Potential gestures are tracked using active contours, found by computing the absolute difference between the key frame and images in the warped sequence. By successfully recognising all pointing gestures, presentations can be fully annotated per slide. This automatic video analysis system helped users to access presentation videos intelligently by providing access using specific slides and gestures.
Prosodic information from the audio stream to identify speaker emphasis dur-ing presentations was used in (He et al., 1999), in addition to pause information to avoid selecting segments for summaries which start mid-phrase. They also garnered information from slide transition points to indicate the introduction of a new topic or sub-topic. They developed three summary algorithms: a slide transition based summary, a pitch activity based summary and a summary based on slide, pitch and user-access information. They used surveys for evaluation and found that
com-puter generated summaries were rated poorly on coherence, in which participants complained that summaries jumped topics. No significant difference between users’ preferences for the three methods was found, leading to the conclusion that the sim-pler methods may be preferable. They also found that audio-visual presentations were less susceptible to pitch-based emphasis analysis than the audio-only stream, meaning emphasise is more easily analysed from pitch in the audio-only stream. This is the first work attempting to summarise presentation video by speaker em-phasis. In this work they found that speaker emphasis was not sufficient to generate effective summaries.
(Li et al., 2000) developed and evaluated an enhanced digital video browser for browsing through different categories of digital video. The categories evaluated were classroom, conference, sports, shows, news and travel. They evaluated the effective-ness of the following enhanced browser controls - Time Compression (TC), Pause Removal (PR), Table of Contents (TOC), Shot Boundary (SB), Timeline markers and jump controls. For browsing of conference presentations, TC and PR were found to be the most effective tools for improved video browsing with scores of 6.9 and 6.5 out of 7 respectively. This enhanced digital video browser can give us an additional comparison method to evaluate the effectiveness of our automatically generated pre-sentation summaries, to complement analysis using eye-tracking methods.
(Joho et al., 2009) captured and analysed user’s facial expressions for the gen-eration of perception based summar