Stock Liquidity, Auditor Choice, and Audit Fees
A DISSERTATION SUBMITTED TO THE GRADUATE DIVISION OF THE UNIVERISITY OF HAWAI‘I AT MĀNOA IN PARTIAL FULFILLMENT OF THE
REQUIREMENTS FOR THE DEGREE OF
DOCTOR OF PHILOSOPHY IN BUSINESS ADMINISTRATION AUGUST 2017 By Juan Qin Dissertation Committee: Jing Ai Liming Guan John Wendell Kate Zhou Jian Zhou, Chairperson
Keywords: Stock Liquidity, Auditor Choice, Audit Fees, Corporate Governance, Institutional Monitoring
ii
ACKNOWLEDGEMENTS
First, I want to express my enormous gratitude to my committee members. My advisor Dr. Jian Zhou serves as Chair in my dissertation committee. This dissertation would not have been possible without his support and guidance. I cannot be thankful enough for his patience, support and encouragement during the entire process of my PhD study at University of Hawaii at Manoa. I would also like to extend my appreciation to other committee members: Dr. Jing Ai, Dr. Liming Guan, Dr. John Wendell, and Dr. Kate Zhou for their constructive comments and suggestions to my dissertation.
I am also fortunate to receive guidance from other faculty members when I am studying here. I especially thank Dr. Qianqiu Liu, Dr. Victor Huang and Dr. David Yang for supporting me in numerous occasions. I would like to thank Dr. Liming Guan again for his invaluable advice on my study, teaching and research. I also want to thank Dr. Roger Debreceny for his generous financial support. In addition, I appreciate the opportunity to take the class from Dr. Boo Chun Jung and Dr. Ghon Rhee, and the enlightenment from their instruction has profound influence on my research.
I have enjoyed the supportive environment of the PhD Program at Shidler College of Business. Along this journey, I have met many outstanding people. Besides faculty, I learnt a lot from my fellows: Qiu Bin, Zhou Chen, Ying Guo, Jaehyeon Kim, Miaochan Li, Youngbin Kim, Jaeseong Lim, Kunsu Park, Fujiao Xie, Ting-Tsen Yeh, Jiarui Zhang and Jingwen Zhao.
Finally, I am so fortunate to have the understanding from my family, especially my parents. The support, patience and encouragement that they have provided during the past five years have been the motivation of my endeavor to survive in the PhD program.
iii ABSTRACT
I investigate whether firms’ stock liquidity is associated with their auditor choices and audit fees. Stock liquidity can increase monitoring by helping institutional investors overcoming free-rider problems to intervene in management decisions. Stock liquidity can also facilitate block formation and costly information acquisition, which enhances corporate governance through the threat of exit by institutional investors. Given that stock liquidity can enhance corporate governance, firms with higher stock liquidity may have incentives to hire higher quality auditors and pay higher audit fees to satisfy the demand of institutional investors. Consistent with these arguments, I find that firms with liquid stocks are more likely to appoint higher quality auditors such as Big 4 and industry specialist auditors, and they also pay significantly higher audit fees. These results are robust to alternative measures of liquidity and industry specialists. These results are also robust to the control of the endogeneity of stock liquidity. This paper contributes to the accounting literature by providing empirical evidence of the role of stock liquidity on auditor choice and audit pricing.
iv TABLE OF CONTENTS ACKNOWLEDGEMENTS ... ii ABSTRACT ... iii TABLE OF CONTENTS ... iv LIST OF TABLES ... vi CHAPTER 1. INTRODUCTION ... 1
CHAPTER 2. THEORETICAL FRAMEWORK AND HYPOTHESIS DEVELOPMENT ... 4
2.1 Stock Liquidity and Corporate Governance ... 4
2.2 Stock Liquidity and Auditor Choice ... 6
2.3 Stock Liquidity and Audit Fees ... 9
CHAPTER 3. RESEARCH DESIGN ... 11
3.1 Measures of Stock Liquidity ... 11
3.2 Measures of Auditor Choice ... 12
3.3 Empirical Models ... 13
CHAPTER 4. EMPIRICAL RESULTS ... 16
4.1 Data and Descriptive Statistics ... 16
4.2 Univariat Analysis ... 17
v
4.4 Multivariate Results for Auditor Fees ... 18
CHAPTER 5. ADDITIONAL TESTS ... 20
5.1 Effect of Client Firm Size on Big4 Choice ... 20
5.2 Effect of Internal Control Weakness on Audit Fees ... 20
5.3 Alterative Definitions of Specialist Auditor ... 21
5.4 Effect of Financial Crisis Period ... 21
5.5 Endogeneity Concerns ... 22
CHAPTER 6. CONCLUSION ... 25
vi
LIST OF TABLES
Table 1 Statistic Description for Regression Variables ... 26
Table 2 Pearson Correlation ... 28
Table 3 Univariate Analysis ... 30
Table 4 Stock Liquidity and Auditor Choice ... 32
Table 5 Stock Liquidity and Audit Fees (AC1) ... 34
Table 6 Stock Liquidity and Audit Fees (AC2) ... 36
Table 7 Stock Liquidity and Big 4 Auditor Choice (Effect of Client Firm Size) ... 38
Table 8 Stock Liquidity and Audit Fees (AC1 and No ICW) ... 41
Table 9 Stock Liquidity and Audit Fees (AC2 and No ICW) ... 43
Table 10 Stock Liquidity and Specialist1 Choice ... 45
Table 11 Stock Liquidity and Audit Fees (Specialist1) ... 46
Table 12 Stock Liquidity and Specialist2 Choice ... 48
Table 13 Stock Liquidity and Audit Fees (Specialist2) ... 49
Table 14 Stock Liquidity and Auditor Choice during Financial Crisis Period ... 51
Table 15 Stock Liquidity and Audit Fees during Financial Crisis Period (AC1) ... 53
Table 16 Stock Liquidity and Audit Fees during Financial Crisis Period (AC2) ... 55
Table 17 Stock Liquidity and Audit Choice (Two-Stage-Least Squares Regression) ... 57
Table 18 Stock Liquidity and Audit Fees (AC1 and Two-Stage-Least Squares Regression) ... 60
Table 19 Stock Liquidity and Audit Fees (AC2 and Two-Stage-Least Square Regression) ... 66
1
CHAPTER 1. INTRODUCTION
This paper investigates whether stock liquidity can explain U.S. firms’ auditor choice, and audit fees paid by these firms. After the failure of Arthur Andersen and the passage of the Sarbanes-Oxley Act in 2002, regulators have expressed concern about the high degree of concentration in the audit market and encouraged public companies to consider using smaller accounting firms (Cox 2005; McDonough 2005). However, even for most clients of Arthur and Andersen, they still switched to other Big 5 auditors after the scandal (Barton 2005). Proposals to reduce concentration of audit market have been put forth proposals by academic and business groups. However, none of them was widely supported, since market participants raised questions about the overall effectiveness, feasibility, and benefit of these proposals1. Therefore, the concentration in audit market continues for public companies. For example, there are totally 1077 U.S. accounting firms that are currently registered with the Public Company Accounting Oversight Board (PCAOB)2, only around 530 firms of them have audited public companies, and Big 4 audit approximately two thirds of public companies3. Since the potential adverse effects of further concentration of audit market, it is meaningful to explore the attributions to the companies’ auditor choice.
Information asymmetry between principals and agents provides opportunities for agents to promote their own interests at the expense of the interests of the principals (Jensen and Meckling 1976). In order to minimize such behavior, principals establish systems to monitor agents, and audit is one of the tools available for principle (Johnson and
Lys1990; Imhoff 2003). In this role, auditors provide investors and other potential users of financial statements with confidence in reported financial information audited by them.
1 http://www.gao.gov/assets/280/270953.pdf
2https://pcaobus.org/Registration/Firms/pages/registeredfirms.aspx 3 Audit Analytics
2
However, although audits are expected to be a strong monitoring mechanism, not all audit firms have the same audit quality in term of level of knowledge and expertise, and auditor choice of clients’ firms varies based on audit quality (DeAngelo 1981).
The extant literature indicates that auditor choice can be influenced by cultures, ownership structures, corporate governance, audit committee quality etc. (e.g., Abbott and Parker 2000; Hope et al. 2008; Wang et al. 2008; Guedhami et al. 2009; Ho and Kang 2013). Extending the literature, I assume that auditor choice can be impacted by stock liquidity. My argument is based on that stock liquidity is likely to influence companies’ decision making by facilitating incentives of institutional monitoring, either by enhancing blockholder voice (Maug1998) or by amplifying blockholder threat of exit (Edmans 2009; Edmans and Manso 2011).
In addition, I also explore the association between stock liquidity and the level of audit fees. On one hand, stock liquidity strengthens the institutional monitoring, which lower information asymmetry between owners and managers, decrease the extent to which managers succeed in manipulation (Fang 2012), and thus reduce the demand for a more stringent audit process, and result in less audit fees. On the other hand, the enhanced governance appeal to high quality audits to mitigate agency costs and the likelihood of fraudulent financial reporting. In response to such clients’ demand, auditors increase their engagement efforts and charge higher audit fees. Therefore, based on the controversial argument above, the relationship between stock liquidity and audit fees is a matter of empirical interest.
To address these objectives, I use Big 4 and industry expertise as the proxy for high quality of auditor, and use three measures for stock liquidity to analyze the response of companies’ auditor choice and audit fees to stock liquidity. Based on samples of U.S. firms for the period 2007–2014, I find that firms with more liquid stock are more likely to appoint high quality auditor, and pay more audit fees. To provide further evidences to these findings, I conduct some other additional tests. For example, I consider the effect of clients’ firm size on Big 4 choice, and divide the sample into quantiles by clients’ firm
3
size, and run the regression again. The result suggests that the role of stock liquidity on Big 4 choice is not driven by the client firm size. Next, since there are other definitions on industry expertise, I test the sensitivity of the prior results to the other measures of industry expertise, and it turns out that my findings are robust. I also investigate the possible impact of financial crisis on the results, since it documents that stock liquidity dries up in the financial crisis (NÆS et al. 2011). Through the analysis, I obtain the consistent results. Finally, while the primary tests are suggestive of a role for stock liquidity in auditor choice and audit fees, they are cross-sectional results, and thus suffer from endogeneity concerns. I implement a two-stage least squares estimation to address the endogeneity of stock liquidity, and the result indicate that the prior finding on the relationship between stock liquidity and auditor choice, and the relationship between stock liquidity and audit fees are persistent.
This paper contributes to literature in several ways. First, it closes a gap and extends stock liquidity study into accounting. It is a complement to the recent studies on the effects of stock liquidity under financial research. Second, it contributes to the auditor choice literature by suggesting that stock liquidity have significant influence on firms’ accounting properties through their impact on firms’ auditor choice. Third, although extensive empirical research documents the determinants of external audit fees in the audit market, this study is the first to investigate the relation between stock liquidity and audit fees. In addition, the study also contributes to the practice, since the findings have implications to the participants who concern about the concentration of audit market and the increasing audit fees in recent years.
The remainder of this paper proceeds as follows. The second section provides reviews of the literature on stock liquidity, the factors that influence auditor choice, the determinants of audit fees and thus gives the basis for our hypotheses. The third section describes the measures used for the dependent and control variables, the research design and the sample section procedure. The fourth section presents our empirical results. The fifth section provides the conclusion.
4
CHAPTER 2. THEORETICAL FRAMEWORK AND HYPOTHESIS DEVELOPMENT
In this section, I develop two hypotheses. The first hypothesis examines how firms’ stock liquidity affects auditor choice of U.S. listed firms. The second hypothesis examines the relation between stock liquidity and audit fees.
2.1 Stock Liquidity and Corporate Governance
There is a long-standing debate as to whether stock liquidity enhances or weakens corporate governance. Studies that support enhanced effect are based on the argument that stock liquidity reinforces institutional monitoring in two ways. The first theory in this vein includes Maug (1998), Kahn and Winton (1998), and Noe (2002), which hold that stock liquidity help overcome the free-rider problem and strengthen the incentives of investors’ monitoring in the form of intervention in management decisions. To be detail, buying shares at a cost that does not fully reflect the value appreciation resulting from intervention encourage investors to overcome the free-riding problem. Trading profits are increasing with stock liquidity because liquidity makes informed trades to hide their purchases by pooling with noise traders. Therefore, once investors acquire large block of shares at favorable prices, they can benefit from price appreciation caused by their monitoring activities later (Kyle and Vila 1991; Maug 1998). In other words, investor monitor and trade with an aim to profit from their monitoring activities and stock liquidity facilitates to achieve their aim. Therefore, Maug (1998) concludes that liquid stock markets, far from being a hindrance to corporate control, tend to support effective corporate governance.
Another causal mechanism through which stock liquidity may discipline management is identified in Palmiter (2002), Edmans (2009), and Admati and Pfleiderer (2009). They indicate if management’s compensation is tied to current stock prices, stock liquidity
5
increases the cost of managers’ opportunistic behavior by facilitating the informed
selling, and the higher stock liquidity makes the threat of exit more credible. Since higher stock liquidity lowers transactions costs, even minor negative signals suffice to induce investors’ selling, which drives down the price of the targeted firms and compel manager to maximize shareholder wealth. In addition, Edmans and Manso (2011) exam the behavior of blockholders who are long-term institutions with the option to sell in the short run, and illustrate that their selling is more informative to other investors.
Finally, to a certain extent, the theories on monitoring via intervention and monitoring via threat of exit are complementary to each other. For example, blockholders’ intervention in the U.S. is not ubiquitous, because they are always small and face obvious institutional and legal barriers. Sometimes, people suspect that intervention model can explain the role of such non-controlling shareholders playing in corporate governance. In this case, the exit model can be utilized to explain the monitoring capability from those multiple but small blockholders. In summary, when intervention models have difficulty, the exit model can justify why blockholders are so prevalent and exert governance even if they lack control rights (e.g., Edmans 2009; Edmans et al. 2013).
While these two models focus on the positive role of stock liquidity in improving corporate governance, other researchers have noted potential adverse effects of market liquidity on agency problems within the company. For example, Coffee (1991) and Bhide (1993) argue although liquidity is a lubricant for share purchase by investors, it makes blockholders’ position less firm, and facilitates the exit of current blockholders who are potential activists. Therefore, they insist that stock liquidity can be an
impediment for shareholder to exert monitoring, and blockholers can more easily exit with little or no impact on price when confronted with a less negative signal.
However, in this study, our argument bases on models that stock liquidity strengthens companies’ corporate governance, since they dominate in the literature and receives the support from empirical investigation. For example, as predicted by the exit model, Fang et al. (2009) finds evidence that liquidity enhances firm performance by increasing the
6
incentive effects of managerial pay-for performance contract. Norli (2014) indicates that stock liquidity increases the probability of activism and activists accumulate more stocks in targets when they are with more liquid stock.
2.2 Stock Liquidity and Auditor Choice
a. Stock Liquidity Mitigates High Quality Auditor Demand
The separation of ownership and management in firms can result in severe agency problems in firms (Fama and Jensen1983a; Fama and Jensen1983b). Usually managers have more insider information than they provide to firms’ owner and have an incentive to bias the information to maximize their interest. On the other hand, firms’ owner is
assumed be aware of managers’ incentive to exploit the information asymmetry, thus employed numerous tools to constrain such opportunistic actions on managers (Watts and Zimmerman1983). Audit is one of the tools available for owners to monitor management. Besides inspecting managers’ work, auditors also provide an independent check on the information provided by them to reinforce outsider users’ confidence in financial reporting as well as reduce the agency costs (Jensen and Meckling 1976; Johnson and Lys 1990; Imhoff 2003).
However, the fact is that audit conducted does not necessarily eliminate all misbehaviors of managers, since not all audit firms have the same level of audit quality. As defined by DeAngelo (1981) and Copley and Douthett (2002), audit quality is the probability that an auditor discovers a breach in the accounting system, and reports the breach. Audit market is differentiated based on audit quality (Simunic 1980; Danos and Eichenseher 1986; Simunic and Stein 1987; Krishnan and Schauer 2000; Bruynseels et al. 2011), and a batch of studies explore the determinants of auditor choice in terms of audit quality. Among them, agency theory is used to explain the utility of external audit service (e.g., Watts and Zimmerman1983; Simunic and Stein1987; Wang et al.2008). To be specific, as agency conflicts between principal and agent increase, higher quality auditors are demand, because higher quality auditor is seen to provide greater assurance to reduce information asymmetry. For example, Guedhami (2009) indicate that foreign owners who are in
7
privatized firms that suffer more serious information asymmetry prefer higher quality auditors to ensure the reliability of financial statements to reduce agency costs.
In this study, I investigate whether stock liquidity has any impact on companies’ auditor choice. As discussed, the demand for audit quality is driven by information asymmetry and conflict of interest between managers and investors (Watts and Zimmerman 1983; Healy and Palepu 2001). Companies with higher stock liquidity are subject to less severe agency problems, since as I mentioned, liquid stock can facilitate the formation of a toehold stake (Kyle and Vila, 1991), enhance the institutional monitoring, and improve corporate governance (Palmiter, 2002; Edmans, 2009; Admati and Pfleiderer, 2009). All these lead to lower information asymmetry and less conflicts of interest between
managers and shareholders, which mitigate the demand for the engagement of high quality auditors. In line with this argument, Ho and Kang (2013) and Khan et al. (2015) find that family firms are less likely to recruit top-tier auditors, since family owners exert influence to monitor their firms, resulting in less severe agency problems between
managers and shareholders. In sum, I expect that firms have liquid stock have lower demand for high quality auditors to serve a monitoring function to alleviate agency problems between managers and shareholders.
b. Stock Liquidity Enhances High Quality Auditor Demand
Conversely, stock liquidity can enhance the demand of high quality auditor choice. The existing studies have demonstrated that high quality auditor translate into high earnings quality, and high quality auditors provide information with more integrity and reliability to investors and shareholders (e.g., Teoh and Wong1993; Becker et al. 1998). Investors also value firms that hire high quality auditors more than those that hire low quality auditors (Balvers et al. 1988; Copley and Douthett 2002; Krishnan 2003), since they gain access to information that is more useful. For example, Balsam et al. (2003) indicate that clients audited by high quality auditors have lower discretionary accruals and higher earnings response coefficients than clients audited by low quality auditors. Diamond and Verrecchia (1991), Pittman and Fortin (2004) and Krishnan et al. (2013) find that high quality of auditor reduces firms’ financing cost.
8
Although the benefit to recruit high quality auditor is obvious, managers avoid high quality auditor when they have incentive to exercise discretion over accounting policies or conceal their diversionary practices (Fan and Wong 2005; Guedhami et al.2009). Since high quality auditors are more independent and less influenced by external factors to issue modified audit opinions to firms with questionable accounting practices (DeFond et al. 2000, Chan et al.2006). High quality auditors also facilitate the flow of more credible firm-specific information into the stock market (Gul et al.2010). In this case, the
appointment of high quality auditor could be imposed as a monitoring mechanism by shareholders (Watts and Zimmerman 1986).
Given stock liquidity reinforcing companies’ corporate governance, I expect that stock liquidity could either directly (through the intervention) or indirectly (through selling and thereby driving down stock price) to impel management to provide better monitoring in the form of high quality auditors. This argument is consistent with findings in Kane and Velury (2004), that once shareholder, either as individually or as groups, have sufficient stock to be influential, they would apply sufficient force to obtain high quality auditor. Therefore, blockholders who are more sophisticated and hold proportionately larger block of share can be able to exert substantive influence and facilities firms to appoint high quality auditor, in the form of direct intervention or indirect threat of exit (Norli 2014; Palmiter 2002; Edmans 2009; Edmans et al. 2013).
Besides those, another stream of literature indicates that subjected to intense monitoring, managers have less opportunity and less temptation to engage in self-stealing activities. They are inclined to improve financial reporting to persuade outside investors that they are not extracting private benefit by appointing high quality auditors (Watts and
Zimmerman 1983; Dyck and Zingales 2004; Barton 2005; Fang et.al 2016). Guedhami et al. (2014) find that connected insiders who refrain from self-dealing are more likely to appoint Big 4 auditor, since they have nothing to hide. Srinidhai (2014) also show that strongly governed family firms are more likely to choose higher quality audits to signal their transparency and signal their integrity by reporting higher earnings quality.
9
Therefore, given that stock liquidity is tend to enhance blockholders’ monitoring incentive, firm with higher stock liquidity, managers are more likely to hire higher quality auditors.
c. Relationship Between Stock Liquidity and Auditor Choice
In the light of discussion above, stock liquidity can either mitigate or enhance the demand for the high quality auditor. However, which force dominates the relationship between stock liquidity and auditor choice being a matter of empirical interest. Based on the controversial argument on the relationship between stock liquidity and auditor choice, my first hypothesis is a null hypothesis and stated in the following:
H1: Ceteris paribus, there is no significant relationship between stock liquidity and auditor choice.
2.3 Stock Liquidity and Audit Fees
The second question that I investigate is the influence of stock liquidity on audit fees. I begin the argument with the controversial debate on the relationship between governance mechanism and the audit fee. On one hand, some studies (e.g., Carcello et al., 2002; Abbott et al., 2003) provide evidence to support that governance mechanisms require high quality auditors to mitigate agency costs and reduce the possibility of fraudulent financial reporting, and the engagement of high quality auditors lead to higher audit fees. This view names as demand-side perspective. On the other hand, other studies (e.g., Gul and Tsui, 1998) document that governance mechanisms mitigate agency conflicts in financial reporting and reduce the perceived risk of irregularities or accounting
misstatements. The lower risk cuts down the scope of audit work, and decrease audit fees. This viewpoint names as supply-side (risk-based) perspective.
a. Stock Liquidity Increases Audit Fees
The argument in term of the association between stock liquidity and audit fees
10
the demand-side perspective. Again, stock liquidity facilities the formation of
blockholders, who are always sophisticated shareholders may require managers to utilize high quality auditors as a safeguard for the reliable financial reporting. In response to such clients’ demand, auditors increase their engagement efforts and charge higher audit fees. Therefore, from the demand-side perspective, stock liquidity is positively associated to audit fees.
b. Stock Liquidity Decreases Audit Fees
However, the relationship between stock liquidity and audit fees is also likely to hold from the supply-side risk perspective. Based on prior argument, stock liquidity enhances incentive of institutional monitoring over management, and improves corporate
governance, which reduce managers’ flexibility to produce distorted financial statement information to benefit themselves. Consistent with this argument, Fang (2012) indicate that firms with relative higher stock liquidity have less positive accrual earning, lower accruals-based earnings management, future cash flows, and larger earnings response coefficients than firms with relative lower stock liquidity. Therefore, for clients with high liquid stock, auditors would perceive their audit risk to be lower, which result in lower engagement efforts and less risk premiums, thus less audit fees. Therefore, from the risk-based supply perspective, there is a negative relationship between stock liquidity and audit fees.
c. Relationship between stock liquidity and audit fees
In the light of discussion above, it seems that audit fees are jointly determined by both the demand-related and supply-related perspectives. However, which factor dominates the relationship between stock liquidity and audit fees is a matter of empirical interest. Based on the controversial argument on the relationship between stock liquidity and audit fees, my second hypothesis is also a null hypothesis and stated in the following:
H2: Ceteris paribus, there is no significant relationship between stock liquidity and audit fees.
11
CHAPTER 3. RESEARCH DESIGN
3.1 Measures of Stock Liquidity
I use three measures for stock liquidity. The first one is Turnover, which is defined as the log of the ratio of total shares traded annually divided by share outstanding. The higher turnover means the higher stock liquidity. I choose Turnover as one measure of stock liquidity, since it is the most natural measure and yields the sharpest empirical
implications (Lo and Wang, 2000). Jayaraman and Milbourn (2012) also employ it as a proxy for stock liquidity, when investigating how stock liquidity influences the
composition of CEO annual pay and the sensitivity of managerial wealth to stock price. They think that Turnover is a more feasible measure of stock liquidity, since this measure’s computation involves scaling shares traded by shares outstanding, and implicitly controls for firm size, so that enable the comparison across firms and over time.
In addition, following Fang et al. (2009), I adopt other two measures: the Amihud (2002) measure of illiquidity and the percentage of zero-returns first used by Lesmond et al. (1999). Amihud (2002) develops a price impact measure to captures the “daily price response associated with one dollar of trading volume.” Specially, the ratio is:
Illiquidity = Average (|rt|/Volumet)
Where rt is the stock return on day t, and Volume is the dollar volume on day t. Since the ratio is undefined for zero-volume days, the average computes over all positive-volume days. Days with no trading are excluded from the calculation. To account for skewness in the distribution, the log-transforms is calculated in this study. Finally, because a higher value of this measure corresponds to a lower level of liquidity, I multiply it by -1 to facilitate interpretation as a measure of stock liquidity.
12
The last measure of stock liquidity is the proportion of days with zero returns, which is created in Lesmond et al. (1999). The reason to use it is that stocks with lower liquidity are more likely to have zero-volume days and thus are more likely to have zero-return days. The percentage of zero daily returns is calculated for each stock year, with zero daily returns and positive trading volume divided by the number of trading days over a firm's fiscal year. Consistent with prior literature, if the number of missing daily returns or zero daily returns in a firm-year exceeds 80% of the trading days for a firm’s fiscal year, the firm-year observations are dropped from my sample. Finally, the formula of the measure is
Zeros= (# of positive-volume days with zero return)/T
where T is the number of trading days over the fiscal year. Because a higher value of this measure corresponds to a lower level of liquidity, I also multiply it by -1 to facilitate interpretation as a measure of liquidity.
3.2 Measures of Auditor Choice
Audit quality is not directly observable. Several proxies are used to capture the quality association of audit services with auditor characteristic, like auditor size, industry
expertise, auditor tenure, and the proportion of non-audit fees. Among them, I choose two alternatives as proxies for auditor choice in this study. The first one is Big 4, which captures the impact of stock liquidity on recruiting high quality auditor based on auditor size. It equals 1 for firms audited by one of Big 4 firms, and 0 otherwise. DeAngelo (1981), Rogerson et al. (1983) and Datar et al. (1991) think that larger and more prestigious auditors and audit firms have greater incentives to provide high quality auditors to protect their investment in reputational capital. Craswell et al. (1995) argue that, although all audit firms must comply with certain standards, larger audit firms are more likely to invest in higher levels of expertise. Francis (2004) conducts surveys and further support that Big 4 are brand-name suppliers of better assurance services to
mitigate managers’ discretion over financial reporting, since Big 4 value their reputations and avoid liable for investor losses in civil litigation. In sum, Big 4, as a proxy for audit quality, received widely support in the academic research.
13
In addition, Hay (2013) call for alternative proxies to measure audit firm differentiation. To response such kind of appeal, I use the likelihood to recruit auditor with industry expertise as another proxy for audit choice. Industry specialist auditor variable is a dummy variable, which equals to 1 if the auditor is an industry specialist, and otherwise 0. The measure of auditor industry expertise is based on audit firms’ market share in audit fees within industry groups classified by two-digit SIC codes (Hogan and Jeter 1999; Feguson et al. 2003). Therefore, an audit firm is defined as an industry expert if its market share is ranked number one at the national level (Reichelt et al. 2010; Krishnan et al. 2013).
3.3 Empirical Models
Following Fang et al. (2016), I use the following logistic model to test the role that stock liquidity plays in auditor choice.
ACNit = a0 + a1* LiqNit + a2*SIZEit + a3*LEVit + a4*INVit + a5*ROAit+ a6*GROWTHit
+ a7*LLOSSit + a8*SEGit + a9*CURRit+ a10*ATURNit+ a11*FOREIGNit
+ Industry Fixed Effect + Year Fixed Effect + e (1)
Where ACN stands for the variable of auditor choice, and AC1 is Big 4 and AC2 is
Industry Specialist respectively. so ACN equal to 1 if the auditor choice is either Big 4 or
Industry Specialist. LiqN stands for three measures of stock liquidity and Liq1 is
Turnover, Liq2 is Zeros multiplied by -1, and Liq3 is Illiquidity multiplied by -1 respectively. In line with the argument for Hypothesis 1, the coefficient for LiqN is uncertain, and the association between stock liquidity and auditor choice is under test. To isolate the role of stock liquidity, Equation (1) controls a branch of variables known to affect auditor choice (e.g., Mansi et al. 2004; Fan and Wong 2005; Lennox 2005; Fortin and Pittman2007; Choi and Wong 2007; Wang et al. 2008; Guedhami et al. 2009). It includes firm size (SIZE), computing as the natural logarithm of total assets, financial leverage (LEV), calculating as book value of total debt divided by the total assets, asset
14
structure (INV), capturing with the ratio of inventory to total assets, profitability (ROA), being the return on assets ratio, growth (GROWTH), amounting to the sales growth ratio in the past year, for prior year (LLOSS), being a dummy variable and equaling to 1 if the firm reports a negative income, and zero otherwise, segment (SEG), being the number of business segments based on two-digit SIC codes, current ratio (CURR), amounting to current asset divided by current liabilities, asset turnover (ATURN), calculating as net sales divided by total assets and foreign operations (FOREIGN), equaling to 1 if the firm has foreign operations. I control SIZE, ROA, LLOSS, and ATURN to capture the impact of firm size and performance on auditor choice. I control LEV and CURR to capture the influence of financial solvency and liquidity risks on audit choice. Next, GROWTH is controlled for a firm’s capital needs to its demand for a high-quality auditor. FOREIGN
and SEG control the complicacy of the auditor scope. Finally, I control the industry and year fixed effect. The definitions of all variables are provided in Appendix.
Subsequently, based on previous research (e.g., Francis et al. 2005; Hogan and Wilkins 2008), I use the below equation to test Hypothesis 2 and investigate the relation between stock liquidity and audit fees.
LAUDFit = b0 + b1*LiqNit + b2*BIG 4it + b3*SIZEit+b4*RECINVit + b5*LEVit+ b6*ROAit
+ b7*GCit+ b8*MERGERit+b9*RESTRUCit + b10*SPECIALit+ b11*MBit
+ b12*SEGit + b13*ROANEGit+ b14*FOREIGN15+Industry Fixed Effect
+Year Fixed Effect + e (2)
Where LAUDF is the dependent variable and calculated as the natural logarithm of audit fees. In line with the argument for Hypothesis 2, the coefficient for LiqN is uncertain, and the association between stock liquidity and audit fees is under test. Some control
variables incorporated into Equation (2) are the same as in the Equation (1), including
BIG 4, SIZE, LEV, ROA, SEG and FOREIGN. In addition, Equation (2) also includes some other variables, which are RECINV, being the sum of receivables and inventories scaled by assets, GC, coded 1 if the observation receives a going concern opinion,
MERGER, coded 1 if the observation is engaged in a merger or acquisition, RESTRUC,
15
again and coded to 1 if observation has the special items, MB, defined as total asset minus book value plus the market value of equity, then divided by total asset, and ROANEG, equaling to1 if the firm’s ROA is negative; and 0 otherwise. Again, I controlindustry fixed effect and year fixed effect. The definitions of the variables are provided in Appendix as well.
16
CHAPTER 4. EMPIRICAL RESULTS
4.1 Data and Descriptive Statistics
The data for the primary empirical test comes from three sources. Firms’ financial information is from Compustat, data to compute the measure of stock liquidity is from
CRSP, and date related to audit is from Audit Analytics. The sample period is from 2007 to 2014. Excluding financial firms and utility firms, it includes 19868 firm-year
observations with non-missing data for all variables for Equation (1), and it includes 22250 firm-year observations with non-missing data for all variables for Equation (2).
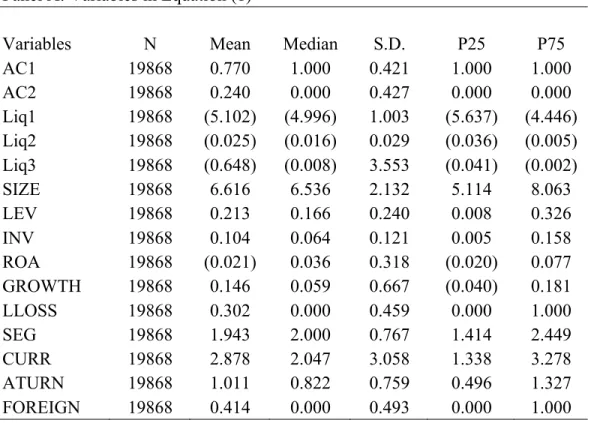
Table 1 presents the descriptive statistics of variables for the full sample of firm-year observations used in Equation (1) and Equation (2). In Panel A, the overall mean of AC1
is 0.770, which indicates that approximately 77% of observations hire BIG 4 to conduct audit in the sample, and the percentage of observations to hire Industry Specialist is 0.240. Therefore, the two definitions of audit choice yield different samples, which avoid bias of sample composition in the study. In addition, Liq1, Liq2 and Liq3 are the
measures of stock liquidity used in regression models of Equation (1) and Equation (2), and their mean values for the observation are -5.102, -0.025 and -0.648, respectively.
In Panel B, it reports the pooled distribution of the firm-year regression regarding the impact of stock liquidity on audit fees. The mean of LAUDF is 13.892. Panel A and Panel B include some variables incorporated in both Equation (1) and Equation (2), like
measures of audit choice, measures of stock liquidity, SIZE, ROA, LEV, SEG and FOREIGN, and their values in both Panels are comparable to each other. Besides, these variables as well as other control variables are qualitatively similar as the previous studies. Finally, to avoid outliers, all continuous variables are winsorized at the 1 percent and 99 percent levels.
17
Table 2 presents correlations among all the variables. Again, Panel A and Panel B describe the correlations among variables in the Equation (1) and Equation (2), respectively. In both panels, the correlation between AC1 and AC2 is positive and significant, the correlations among Liq1, Liq2 and Liq3 are positive and significant. In Panel A, the two measures of audit choice positively significantly correlate to Liq1, Liq2 and Liq3. In other words, the stock liquidity enhances the choice of high quality auditors. In the Panel B, LAUDF is positively significantly correlated to Liq1, Liq2 and Liq3
respectively as well.
[Insert Table 2 here]
4.2 Univariat Analysis
Table 3 shows the result of univariat analysis for subsamples consisting of observations audited by different type of auditors. There are Panel A, and Panel B, where AC1 and
AC2 is usedto measure auditor choice, respectively. This table presents the p-value from T-tests and Wilcoxon Z-tests for difference in means and medians between the two groups of observations.
As noted in both panels, observations audited by Big4 or Industry Specialist have characteristics that are distinguished from those audited by Non-Big4 or Non-Industry Specialist. To be specific, stock liquidity from observations audited by high quality auditor is significantly greater than stock liquidityfrom those audited by low quality auditor. In other words, clients audited by relative higher quality auditors have higher stock liquidity. In addition, clients audited by higher quality auditors have significantly larger firm size, less financial leverage, more inventory, more profitability, lower growth rate, less financial loss, more foreign operations, more complex control, and lower current ratio and asset turnover.
18 4.3 Multivariate Results for Auditor Choice
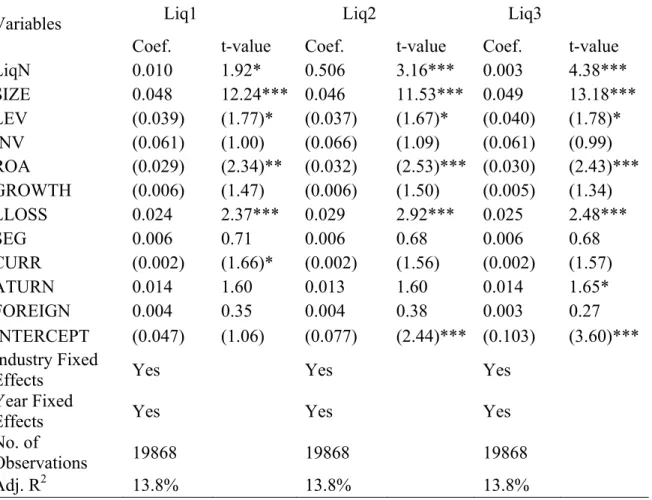
Table 4 reveals the results of test for the relationship between stock liquidity and auditor choice. The t-values are clustered by firm (Rogers 1993). The results for three measures of stock liquidity are given in Column (1), Column (2) and Column (3), respectively. In Panel A, the proxy for the auditor choice is AC1, and when the measure of stock liquidity is Liq1, the coefficient of stock liquidity is 0.053 and significant at t-value of 9.71. When the measure of stock liquidity is Liq2 (Liq3), the coefficient of stock liquidity is 1.775 (0.010) and significant at-value of 7.95 (7.89). Therefore, the result indicates that the higher liquid of firms’ stock, the high possibility of Big4 appointment.
Panel B shows the results of test for the relationship between stock liquidity and choice for the industry specialist. In Panel B, when the measure of stock liquidity is Liq1, the coefficient of stock liquidity is 0.011 and significant at T-value of 2.01. When measure of stock liquidity is Liq2 (Liq3), the coefficient of stock liquidity is 0.375 (0.003) and
significant at T-value of 2.31 (4.71). Therefore, firms with more liquid stock are inclined to hire industry specialist, supporting the claim that stock liquidity influences firms’ auditor choice by enhancing corporate governance. For the rest of control variables, their coefficients are consistent with prior studies. For example, larger firms, firms with higher leverage, or firms exhibiting serious financial loss are more likely to hire high quality auditors.
[Insert Table 4 here]
4.4 Multivariate Results for Auditor Fees
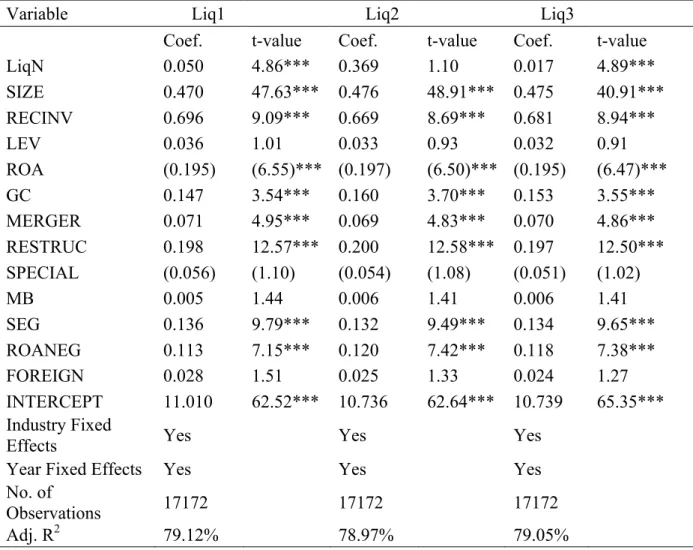
Table 5 gives the regression results for Equation (2) to test the relationship between stock liquidity and audit fees when Big4 is proxy for auditor choice. The t-values are clustered by firms (Rogers 1993) as well. Since the audit fees charged by Big4 is obviously different fromNon-Big 4, the sample is partitioned into Big4 and Non-Big4. The results for the three measures of stock liquidity are given in Column (1), Column (2) and
19
A, I find that stock liquidity is significantly positively related to audit fees. To be
specific, the coefficient of Liq1 is 0.050 and significant at t-value of 4.86. The coefficient of Liq2 (Liq3) is 0.369 (0.017), and the T-value is 1.10 (4.89). All these results indicate that audit fees are relatively higher in firms with more liquid stock. In addition, in Panel B, there is a similar result in the Non-Big 4 subsample as observed in Panel A. For the control variables, their coefficients are consistent with prior studies. For example, larger firms pay higher audit fees. Firms have more merger and acquisition activities, more foreign operations, and more business segments pay more audit fees, and auditors charge lower fees for firms with greater ROA.
[Insert Table 5 here]
Table 6 gives the regression results for Equation (2) to test the relationship between stock liquidity and audit fees when using industry specialist proxy for audit choice. The t-values are clustered by firm (Rogers 1993) as well. The results for the three measures of stock liquidity are given in Column (1), Column (2) and Column (3) respectively. Panel A is the result for firms audited by Industry Specialist. From Panel A, I find that stock liquidity is significantly positively associated with audit fees when the measure of stock liquidity is Liq1 and Liq3. Panel B reports the result for firms audited by Non-Industry Specialist, and the results indicate a significantly positive association between stock liquidity and audit fees for all measures of stock liquidity.
20
CHAPTER 5. ADDITIONAL TESTS
5.1 Effect of Client Firm Size on Big4 Choice
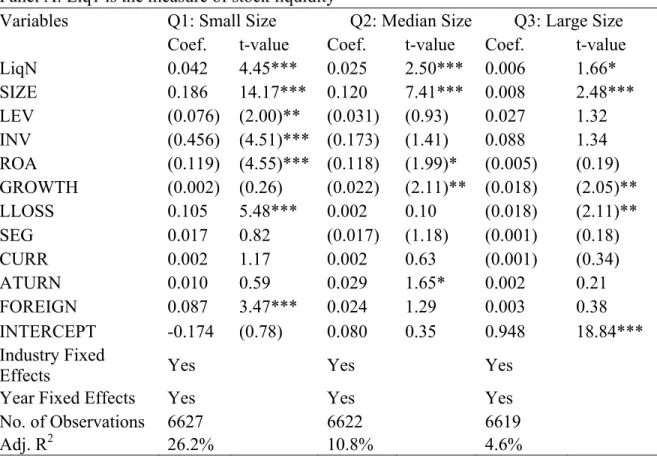
As illustrated in Table 1 Panel A, client firm size is significantly associated with the services’ provision of large audit firms, and 77% of large public firms saw their choice of auditor as limited to Big4. These motives me to further investigate whether client firm size drives the findings about the association between stock liquidity and auditor choice. To provide further evidence, I divided the sample into quantiles by client firm size, and re-run the regression for each quantile. The results of these regressions are presented in Table 7 panel A, Panel B and Panel C. The relation between stock liquidity and audit size is robust across the whole range of client firm size when the measure of stock liquidity is
Liq1, and robust across the small and median of client firm size when the measure of stock liquidity is Liq2 and Liq3. Therefore, our prior results are not driven from clients with large firm size. In general, the result in Table 7 is consistent with our previous findings that stock liquidity is significantly associated with Big 4 auditor choice.
[Insert Table 7 here]
5.2 Effect of Internal Control Weakness on Audit Fees
Hogan and Wilkins (2008) find that audit fees are abnormally high for firms with an internal control weakness (ICW) in the year preceding ICW disclosure, since auditors is likely to exert more effort for the substantive tests to reduce the impact of poor internal controls. While the earlier research design in this study does not exclude the effect of ICW on audit fees. Therefore, to be sure that the results to Hypothesis 2 is also persistent after isolating the effect of ICW, I form a sample that only includes observations without occurrence of ICW, and apply this sample to the Equation (2). The results reported in Table 8 and Table 9 provide further evidence on the relation stock liquidity and audit fees.
21
[Insert Table 8 here] [Insert Table 9 here]
5.3 Alterative Definitions of Specialist Auditor
Besides the prior proxy of industry specialist employed in this study, the extant literature has used several other proxies to measure industry expertise. I adopt other two measures and re-run the regression to test the robustness of the results on auditor choice and audit fees. The first measurement of auditor industry expertise is still based on audit firms’ market share in audit fees within industry groups classified by two-digit SIC codes. The auditor is an industry specialist if the auditor has a market share greater than 30% in a two-digit SIC category in a particular year. I use Specialist1 to stand for it (Reichelt et al. 2010; Krishnan et al. 2013).
For the second measure, I follow Balsam et al. (2003), and define an auditor as specialist in an industry if the auditor has the greatest number of clients in the industry. I use
Specialist2 to stand for it. Our analyses with these definitions yield results tabulated in Table 10 to Table 13, which are consistent with prior results reported in the Table 4, Table 5 and Table 6.
[Insert Table 10 here] [Insert Table 11 here] [Insert Table 12 here] [Insert Table 13 here]
5.4 Effect of Financial Crisis Period
NÆS et al. (2011) find stock liquidity worsens the onset of the National Bureau of Economic Research recession periods, such as the recent 2008-2010 financial crisis period (Srinidhi et al.2014). Since the sample period for the previous analysis in this study covers 2008 and 2010, to test the robustness of the findings, I conduct a separate analysis for the 2008 and 2010 period, and tabulate the results in Table 14, Table 15 and
22
Table 16. Again, the results of the logit regression with respect to auditor choice in Panel A, Panel B and Panel C of Table 14 are consistent with the results reported earlier. The coefficient of three measures of stock liquidity are still positive and significant, providing additional evidence to support that firms with relatively high stock liquidity are more likely to hire high quality auditor.
Regarding the test on the relationship between stock liquidity and audit fees, the results in the Panel B of Table 15 and Table 16 indicate that firms audited by Non-Big4 firm and
Non-Industry Specialist have consistent results with the findings reported earlier. While in the Panel A of Table 15 and Table 16, when using the Liq3 as the proxy for stock liquidity, I find the consistent results with prior findings. In general, even during the financial crisis period, the results partially support that auditors are likely charge more audit fees for firms with higher liquid stock.
[Insert Table 14 here] [Insert Table 15 here] [Insert Table 16 here]
5.5 Endogeneity Concerns
While the above tests are suggestive of the role for stock liquidity in auditor choice and audit fees, they are cross-sectional in nature, and thus the reverse causality problem due to simultaneity between stock liquidity and auditor choice or between stock liquidity and audit fees could not excluded. In other words, liquidity may affect auditor choice, and auditor choice could also affect stock liquidity; liquidity may affect auditor fees, and auditor fees could also affect stock liquidity. For example, Lang et al. (2012) find that high-quality auditors are associated with high stock liquidity for which the proportion of zero-return trading days is used as proxy. Ascioglu et al. (2005) also indicate that the auditor compensation lowers market liquidity of firms with weak corporate governance mechanisms.
23
Therefore, I employ a two-stage-least square regression to address the endogeneity concerns on these results. Following Fang et al. (2009), lagged value of liquidity
(LagLiq) and the median of stock liquidity for firms in the industry (IndLiq)are chose as instruments variables, since they are correlated with stock liquidity, but are unlikely to be correlated with the error term. To be specific, the use of lagged liquidity as an exogenous variable helps mitigate concerns that an unobservable is correlated with stock liquidity, auditor choice and audit fees in the same fiscal year t. Regarding to industry stock liquidity, Fang et al. (2009) point out that the portion of a firm’s liquidity that is correlated with the liquidity of its industry is less likely to be correlated with
unobservable that affect the outcome variable, which are firms’ auditor choice and audit fees in this study.
Table 17 presents results of this instrumental variables approach to test Hypothesis 1. The coefficients on LagLiq and IndLiq in the first stage regression in all three panels of Table 17 are positive and significant, which indicate that the instruments are highly correlated with stock liquidity. The last three columns present the second stage regression
regressing proxy of auditor choice on the predicted component of liquidity from the first stage. Consistent with our primary earlier results, the coefficients on PrLiq, which is the predicted value from first stage regression, are positive and significant in the regression when using LiqN as the measure of stock liquidity. Thus, the relation between auditor choice and stock liquidity is robust to controlling for endogeneity using a two-stage least squares specification.
[Insert Table 17 here]
The results of the instrumental variables approach testing Hypothesis 2 are reported in Table 18 and Table 19. Similarly, the coefficients on LagLiq and IndLiq in the first stage are positive and highly significant, suggesting that the instruments are highly correlated with stock liquidity. In the second stage of regression, I regress audit fees on the
predicted component of liquidity from the first stage. Consistent with our primary prior results, the coefficient on PrLiq is positive and significant in the regression in all
24
samples. Thus, the relation between auditor fees and stock liquidity is robust to controlling for endogeneity using a two-stage least squares specification.
[Insert Table 18 here] [Insert Table 19 here]
25
CHAPTER 6. CONCLUSION
In this paper, we examine the role of stock liquidity as institutional monitoring in influencing firms’ behavior by analyzing its effect on auditor choice and audit fees. It is motivated by the concern about the continued concentration of audit market from
organizations, including SEC and PCAOB. Controlling for a large set of control variables and industry and year fixed effects, I find that more liquid firms are more likely to hire high quality auditor, and audit firms charge more for clients with more liquid stock. To further support these claims, I conduct a series of additional tests and find consistent results. For example, I use alternative measures of auditor choice to examine the
sensitivity of prior results, use the separate sample to test the robustness of result during the period of financial crisis and use a two-stage least squares specification to mitigate concerns regarding endogeneity. Overall, the findings from this study may provide the implications to participants who are concern about the further concentration of the audit market and the increasing of audit fees in the U.S.
26
Table 1 Statistic Description for Regression Variables Panel A: Variables in Equation (1)
Variables N Mean Median S.D. P25 P75
AC1 19868 0.770 1.000 0.421 1.000 1.000 AC2 19868 0.240 0.000 0.427 0.000 0.000 Liq1 19868 (5.102) (4.996) 1.003 (5.637) (4.446) Liq2 19868 (0.025) (0.016) 0.029 (0.036) (0.005) Liq3 19868 (0.648) (0.008) 3.553 (0.041) (0.002) SIZE 19868 6.616 6.536 2.132 5.114 8.063 LEV 19868 0.213 0.166 0.240 0.008 0.326 INV 19868 0.104 0.064 0.121 0.005 0.158 ROA 19868 (0.021) 0.036 0.318 (0.020) 0.077 GROWTH 19868 0.146 0.059 0.667 (0.040) 0.181 LLOSS 19868 0.302 0.000 0.459 0.000 1.000 SEG 19868 1.943 2.000 0.767 1.414 2.449 CURR 19868 2.878 2.047 3.058 1.338 3.278 ATURN 19868 1.011 0.822 0.759 0.496 1.327 FOREIGN 19868 0.414 0.000 0.493 0.000 1.000 *All variables are defined in Appendix.
27 Panel B: Variables in Equation (2)
Variables N Mean Median S.D. P25 P75
LAUDF 22250 13.892 13.881 1.243 13.071 14.691 Liq1 22250 (5.066) (4.968) 1.002 (5.588) (4.430) Liq2 22250 (0.024) (0.012) 0.028 (0.032) (0.004) Liq3 22250 (0.686) (0.008) 4.171 (0.041) (0.002) BIG4 22250 0.785 1.000 0.411 1.000 1.000 Specialist 22250 0.247 0.000 0.431 0.000 0.000 SIZE 22250 6.766 6.705 2.165 5.236 8.264 RECINV 22250 0.232 0.200 0.178 0.083 0.335 LEV 22250 0.217 0.177 0.231 0.012 0.336 ROA 22250 (0.023) 0.036 0.304 (0.019) 0.077 GC 22250 0.019 0.000 0.137 0.000 0.000 MERGER 22250 0.247 0.000 0.431 0.000 0.000 RESTRUC 22250 0.311 0.000 0.463 0.000 1.000 SPECIAL 22250 0.988 1.000 0.110 1.000 1.000 MB 22250 2.032 1.483 2.793 1.118 2.224 SEG 22250 1.973 2.000 0.784 1.414 2.449 ROANEG 22250 0.301 0.000 0.459 0.000 1.000 FOREIGN 22250 0.420 0.000 0.494 0.000 1.000 * All variables are defined in Appendix.
28 Table 2 Pearson Correlation
Panel A: Variables in Equation (1)
Variables (1) (2) (3) (4) (5) (6) (7) (8) (9) (10) (11) (12) (13) (14) (15) (1)AC1 1.00 (2)AC2 0.19 1.00 (3)Liq1 0.12 0.06 1.00 (4)Liq2 0.22 0.10 0.32 1.00 (5)Liq3 0.16 0.06 0.33 0.13 1.00 (6)SIZE 0.65 0.30 0.32 0.49 0.22 1.00 (7)LEV (0.18) (0.07) 0.02 0.03 0.01 (0.31) 1.00 (8)INV (0.04) (0.01) (0.06) (0.02) (0.09) 0.04 (0.02) 1.00 (9)ROA 0.26 0.10 0.03 0.17 0.03 0.47 (0.60) 0.07 1.00 (10)GROWTH (0.07) (0.03) 0.06 0.02 0.03 (0.09) 0.00 (0.05) (0.02) 1.00 (11)LLOSS (0.29) (0.13) (0.07) (0.30) (0.07) (0.50) 0.16 (0.13) (0.26) 0.05 1.00 (12)SEG 0.31 0.14 0.08 0.18 0.07 0.50 (0.13) 0.11 0.19 (0.10) (0.27) 1.00 (13)CURR (0.03) (0.03) (0.03) (0.12) (0.01) (0.12) (0.16) (0.09) 0.09 0.02 0.11 (0.10) 1.00 (14)ATURN (0.04) (0.02) (0.05) (0.01) (0.02) 0.04 0.02 0.44 0.07 (0.05) (0.21) 0.05 (0.21) 1.00 (15)FOREIGN (0.04) (0.14) (0.01) 0.10 0.06 0.14 (0.08) (0.02) 0.07 (0.01) (0.01) 0.35 0.04 (0.10) 1.00 *Coefficients in bold indicate significance at P<0.10
29 *Coefficients in bold indicate significance at P<0.10
Panel B: Variables in Equation (2)
Variables (1) (2) (3) (4) (5) (6) (7) (8) (9) (10) (11) (12) (13) (14) (15) (16) (17) (18) (1)LAUDF 1.00 (2)Liq1 0.02 1.00 (3)Liq2 0.19 0.32 1.00 (4)Liq3 0.11 0.33 0.13 1.00 (5)BIG 4 0.68 0.12 0.22 0.15 1.00 (6)Specialist 0.33 0.06 0.10 0.06 0.19 1.00 (7)Size 0.89 0.32 0.49 0.22 0.65 0.30 1.00 (8)RECINV 0.03 (0.11) (0.06) (0.11) (0.09) (0.04) 0.01 1.00 (9)LEV (0.24) 0.02 0.03 0.01 (0.18) (0.07) (0.31) (0.01) 1.00 (10)ROA 0.36 0.03 0.17 0.03 0.26 0.10 0.47 0.07 (0.60) 1.00 (11)GC (0.61) 0.12 0.04 0.02 (0.47) (0.25) (0.40) (0.05) 0.30 (0.36) 1.00 (12)MERGER 0.29 0.00 0.11 0.06 0.18 (0.08) 0.23 0.01 (0.05) 0.08 (0.11) 1.00 (13)RESTRUCR 0.43 0.03 0.10 0.06 0.26 (0.08) 0.33 0.10 (0.05) 0.10 (0.13) 0.27 1.00 (14)SPECIAL 0.59 (0.08) 0.13 0.06 0.28 (0.37) 0.00 0.02 0.01 (0.02) (0.23) 0.26 0.32 1.00 (15)MB (0.31) 0.02 0.03 0.02 (0.20) (0.08) (0.37) (0.07) 0.54 (0.69) 0.30 (0.06) (0.08) 0.00 1.00 (16)SEG 0.55 0.08 0.18 0.07 0.31 0.14 0.50 0.17 (0.13) 0.19 (0.23) 0.20 0.36 0.00 (0.16) 1.00 (17)ROANEG 0.06 (0.08) (0.14) (0.02) (0.01) (0.26) (0.49) (0.16) 0.16 (0.26) 0.00 0.06 0.11 0.54 0.15 (0.21) 1.00 (18)FOREIGN 0.38 (0.01) 0.10 0.06 0.25 (0.14) 0.14 0.02 (0.08) 0.07 (0.16) 0.17 0.26 0.46 (0.07) 0.35 0.25 1.00
30 Table 3 Univariate Analysis
Panel A: AC1 is the proxy for auditor choice AC1=1 AC2=0
Variables mean median mean median p-value Wilcoxon-p Liq1 (4.916) (4.855) (5.642) (5.631) 0.000 0.000 Liq2 (0.020) (0.012) (0.044) (0.036) 0.000 0.000 Liq3 (0.239) (0.005) (2.199) (0.071) 0.000 0.000 SIZE 7.212 7.166 4.645 4.585 0.000 0.000 LEV 0.233 0.197 0.163 0.076 0.000 0.000 INV 0.094 0.053 0.128 0.082 0.000 0.000 ROA (0.016) 0.037 (0.115) 0.016 0.000 0.000 GROWTH 0.136 0.059 0.170 0.058 0.000 0.830 LLOSS 0.285 0.000 0.430 1.000 0.000 0.000 SEG 2.014 2.000 1.669 1.414 0.000 0.000 CURR 2.765 1.960 3.780 2.419 0.000 0.000 ATURN 0.947 0.760 1.075 0.924 0.000 0.000 LAUDF 14.260 14.169 12.649 12.567 0.000 0.000 MERGER 0.263 0.000 0.169 0.000 0.000 0.000 RESTRUC 0.353 0.000 0.152 0.000 0.000 0.000 SPECIAL 0.988 1.000 0.990 1.000 0.942 MB 2.023 1.497 2.168 1.335 0.000 0.000 ROANEG 0.285 0.000 0.430 0.000 0.000 0.000 FOREIGN 0.447 0.000 0.292 0.000 0.000 0.000
*Statistical significance of the difference in the means and medians is based on a two-tailed test. P-value in bold indicate significance.
31 Panel B: AC2 is the proxy for auditor choice
AC2=1 AC2=0
Variables mean median mean median p-Value Wilcoxon-p Liq1 (4.913) (4.869) (5.136) (5.030) 0.000 0.000 Liq2 (0.019) (0.012) (0.027) (0.016) 0.000 0.000 Liq3 (0.181) (0.004) (0.848) (0.011) 0.000 0.000 SIZE 7.424 7.372 6.371 6.268 0.000 0.000 LEV 0.238 0.212 0.210 0.158 0.000 0.000 INV 0.098 0.056 0.103 0.060 0.005 0.142 ROA (0.007) 0.037 (0.049) 0.032 0.000 0.000 GROWTH 0.120 0.057 0.151 0.060 0.002 0.324 LLOSS 0.273 0.000 0.333 0.000 0.000 0.000 SEG 2.056 2.000 1.896 1.732 0.000 0.000 CURR 2.575 1.869 3.132 2.107 0.000 0.000 ATURN 0.959 0.773 0.982 0.798 0.026 0.075 LAUDF 14.382 14.286 13.735 13.735 0.000 0.000 MERGER 0.260 0.000 0.236 0.000 0.000 0.000 RESTRUC 0.359 0.000 0.291 0.000 0.000 0.000 SPECIAL 0.986 1.000 0.989 1.000 0.024 MB 1.971 1.473 2.083 1.461 0.076 0.348 ROANEG 0.273 0.000 0.333 0.000 0.000 0.000 FOREIGN 0.442 0.000 0.401 0.000 0.000 0.000 *Statistical significance of the difference in the means and medians is based on a two-tailed test. P-value in bold indicate significance.
32 Table 4 Stock Liquidity and Auditor Choice
Panel A: AC1 is the proxy for auditor choice
Variables Liq1 Liq2 Liq3
Coef. t-value Coef. t-value Coef. t-value LiqN 0.053 9.71*** 1.775 7.95*** 0.010 7.89*** SIZE 0.103 25.95*** 0.102 23.18*** 0.110 28.58*** LEV (0.002) (0.07) 0.004 0.54 (0.005) (0.22) INV (0.350) (4.84)*** (0.385) (4.15)*** (0.368) (5.10)*** ROA (0.060) (3.18)*** (0.074) (2.23)*** (0.069) (3.69)*** GROWTH (0.005) (1.12) (0.003) (0.04) (0.001) (0.29) LLOSS 0.030 2.81*** 0.050 5.11*** 0.035 3.31*** SEG (0.011) (1.30) (0.013) (0.30) (0.014) (1.57) CURR 0.002 1.00 0.002 0.40 0.003 1.37 ATURN 0.010 0.93 0.010 0.15 0.012 1.10 FOREIGN 0.048 4.06*** 0.048 1.85* 0.045 3.73*** INTERCEPT 0.374 7.97*** 0.154 5.40*** 0.062 1.87* Industry Fixed
Effects Yes Yes Yes
Year Fixed
Effects Yes Yes Yes
No. of
observations 19868 19868 19868 Adj. R2 31.8% 31.5% 31.2%
*The t-statistics are in parentheses. *, **, *** denote the statistical significance at the 10 percent, 5 percent, and 1 percent levels, respectively (two-tailed test). T-statistics based on standard errors clustered by a firm are shown in parentheses.
33 Panel B: AC2 is the proxy for audit choice
Variables Liq1 Liq2 Liq3
Coef. t-value Coef. t-value Coef. t-value LiqN 0.011 2.01** 0.375 2.31** 0.003 4.71*** SIZE 0.046 12.04*** 0.046 11.65*** 0.047 13.05*** LEV (0.027) (1.21) (0.026) (1.16) (0.028) (1.23) INV (0.051) (0.85) (0.058) (0.98) (0.051) (0.86) ROA (0.025) (2.13)** (0.028) (2.36)*** (0.026) (2.25)** GROWTH (0.005) (1.13) (0.004) (1.07) (0.004) (0.99) LLOSS 0.023 2.28** 0.027 2.71*** 0.024 2.39*** SEG 0.003 0.30 0.002 0.25 0.002 0.26 CURR (0.001) (1.06) (0.001) (0.94) (0.001) (0.97) ATURN 0.014 1.55 0.014 1.56 0.014 1.60 FOREIGN 0.004 0.33 0.004 0.34 0.003 0.25 INTERCEPT (0.024) (0.53) (0.067) (2.13)** (0.084) (2.98)*** Industry Fixed
Effects Yes Yes Yes
Year Fixed
Effects Yes Yes Yes
No. of
Observations 19868 19868 19868
Adj. R2 6.5% 4.6% 6.5%
*The t-statistics are in parentheses. *, **, *** denote the statistical significance at the 10 percent, 5 percent, and 1 percent levels, respectively (two-tailed test). T-statistics based on standard errors clustered by a firm are shown in parentheses.
34 Table 5 Stock Liquidity and Audit Fees (AC1)
Panel A: AC1 is the measure of audit choice, and AC1=1
Variable Liq1 Liq2 Liq3
Coef. t-value Coef. t-value Coef. t-value LiqN 0.050 4.86*** 0.369 1.10 0.017 4.89*** SIZE 0.470 47.63*** 0.476 48.91*** 0.475 40.91*** RECINV 0.696 9.09*** 0.669 8.69*** 0.681 8.94*** LEV 0.036 1.01 0.033 0.93 0.032 0.91 ROA (0.195) (6.55)*** (0.197) (6.50)*** (0.195) (6.47)*** GC 0.147 3.54*** 0.160 3.70*** 0.153 3.55*** MERGER 0.071 4.95*** 0.069 4.83*** 0.070 4.86*** RESTRUC 0.198 12.57*** 0.200 12.58*** 0.197 12.50*** SPECIAL (0.056) (1.10) (0.054) (1.08) (0.051) (1.02) MB 0.005 1.44 0.006 1.41 0.006 1.41 SEG 0.136 9.79*** 0.132 9.49*** 0.134 9.65*** ROANEG 0.113 7.15*** 0.120 7.42*** 0.118 7.38*** FOREIGN 0.028 1.51 0.025 1.33 0.024 1.27 INTERCEPT 11.010 62.52*** 10.736 62.64*** 10.739 65.35*** Industry Fixed
Effects Yes Yes Yes
Year Fixed Effects Yes Yes Yes No. of
Observations 17172 17172 17172 Adj. R2 79.12% 78.97% 79.05%
*The t-statistics are in parentheses. *, **, *** denote the statistical significance at the 10 percent, 5 percent, and 1 percent levels, respectively (two-tailed test). T-statistics based on standard errors clustered by a firm are shown in parentheses.
35
Panel B: AC1 is the measure of audit choice, and AC1=0
Variables Liq1 Liq2 Liq3
Coef. t-value Coef. t-value Coef. t-value LiqN 0.062 4.61*** 1.142 3.03*** 0.005 3.06*** SIZE 0.465 33.08*** 0.468 32.86*** 0.475 34.26 RECINV 0.185 2.12** 0.158 1.81* 0.163 1.87* LEV 0.017 0.31 0.000 0.01 (0.003) (0.05) ROA (0.176) (5.36)*** (0.184) (5.74)*** (0.185) (5.65)*** GC 0.113 1.98* 0.132 2.31* 0.129 2.24** MERGER 0.066 2.36*** 0.072 2.53** 0.070 2.46*** RESTRUC 0.159 5.48*** 0.160 5.48*** 0.159 5.41*** SPECIAL 0.104 1.17 0.124 1.36 0.115 1.26 MB (0.010) (4.52) (0.010) (4.90)*** (0.010) (4.48)*** SEG 0.165 6.37*** 0.161 6.24*** 0.162 6.22*** ROANEG 0.110 4.14*** 0.123 4.57*** 0.114 4.24*** FOREIGN 0.127 3.50*** 0.131 3.57*** 0.130 3.53*** INTERCEPT 9.820 42.81*** 9.487 48.87*** 9.419 48.08*** Industry Fixed
Effects Yes Yes Yes
Year Fixed Effects Yes Yes Yes No. of
Observations 5078 5078 5078 Adj. R2 71.12% 70.83% 70.77%
*The t-statistics are in parentheses. *, **, *** denote the statistical significance at the 10 percent, 5 percent, and 1 percent levels, respectively (two-tailed test). T-statistics based on standard errors clustered by a firm are shown in parentheses.
36 Table 6 Stock Liquidity and Audit Fees (AC2)
Panel A: AC2 the measure of audit choice, and AC2 =1
Variables Liq1 Liq2 Liq3
Coef. t-value Coef. t-value Coef. t-value LiqN 0.052 3.11*** 0.685 1.37 0.019 2.92*** BIG4 0.386 1.71* 0.419 1.93* 0.439 2.04* SIZE 0.488 49.39*** 0.492 49.18*** 0.493 51.09*** RECINV 0.759 7.14*** 0.747 6.95*** 0.755 7.13*** LEV 0.030 0.60 0.023 0.46 0.020 0.41 ROA (0.327) (7.12)*** (0.334) (7.27)*** (0.339) (7.46)*** GC 0.141 2.15** 0.151 2.25*** 0.145 2.18** MERGER 0.062 2.68*** 0.059 2.57*** 0.060 2.59*** RESTRUC 0.199 8.51*** 0.202 8.66*** 0.201 8.62*** SPECIAL (0.059) (0.67) (0.056) (0.66) (0.053) (0.61) MB 0.022 2.77*** 0.024 2.92*** 0.026 3.17*** SEG 0.138 6.55*** 0.135 6.37*** 0.137 6.46*** ROANEG 0.077 2.83 0.087 3.16*** 0.081 2.98*** FOREIGN 0.058 2.00* 0.055 1.89* 0.054 1.86* INTERCEPT 10.450 35.55*** 10.187 37.25*** 10.251 37.72*** Industry Fixed
Effects Yes Yes Yes
Year Fixed
Effects Yes Yes Yes
No. of
Observations 5400 5400 5400 Adj. R2 82.15% 82.02% 82.06%
*The t-statistics are in parentheses. *, **, *** denote the statistical significance at the 10 percent, 5 percent, and 1 percent levels, respectively (two-tailed test). T-statistics based on standard errors clustered by a firm are shown in parentheses.
37
Panel B: AC2 is the measure of audit choice, and AC2 =0
Variables Liq1 Liq2 Liq3
Coef. t-value Coef. t-value Coef. t-value LiqN 0.058 6.64*** 0.920 3.28*** 0.007 5.98*** BIG4 0.379 16.76*** 0.390 17.18*** 0.390 17.22*** SIZE 0.459 65.80*** 0.463 66.30*** 0.467 69.05*** RECINV 0.429 6.90*** 0.396 6.37*** 0.407 6.61*** LEV 0.011 0.35 0.006 0.19 0.005 0.16 ROA (0.152) (6.22)*** (0.156) (6.43)*** (0.130) (6.34)*** GC 0.128 3.33*** 0.149 3.76*** 0.141 3.57*** MERGER 0.078 5.34*** 0.076 5.21*** 0.077 5.29*** RESTRUC 0.202 12.89*** 0.204 12.95*** 0.201 12.81*** SPECIAL (0.014) (0.31) (0.008) (0.18) (0.009) (0.18) MB (0.005) (1.47) (0.006) (1.49) (0.005) (1.37) SEG 0.142 10.49*** 0.138 10.19*** 0.139 10.25*** ROANEG 0.121 8.04*** 0.133 8.66*** 0.126 8.26*** FOREIGN 0.055 3.03*** 0.055 2.97*** 0.052 2.86*** INTERCEPT 10.475 61.42*** 10.164 63.76*** 10.124 63.63*** Industry Fixed
Effects Yes Yes Yes
Year Fixed
Effects Yes Yes Yes
No. of
Observations 16850 16850 16850 Adj. R2 82.08% 82.08% 82.11% *The t-statistics are in parentheses. *, **, *** denote the statistical significance at the 10 percent, 5 percent, and 1 percent levels, respectively (two-tailed test). T-statistics based on standard errors clustered by a firm are shown in parentheses.
38
Table 7 Stock Liquidity and Big 4 Auditor Choice (Effect of Client Firm Size) Panel A: Liq1 is the measure of stock liquidity
Variables Q1: Small Size Q2: Median Size Q3: Large Size Coef. t-value Coef. t-value Coef. t-value LiqN 0.042 4.45*** 0.025 2.50*** 0.006 1.66* SIZE 0.186 14.17*** 0.120 7.41*** 0.008 2.48*** LEV (0.076) (2.00)** (0.031) (0.93) 0.027 1.32 INV (0.456) (4.51)*** (0.173) (1.41) 0.088 1.34 ROA (0.119) (4.55)*** (0.118) (1.99)* (0.005) (0.19) GROWTH (0.002) (0.26) (0.022) (2.11)** (0.018) (2.05)** LLOSS 0.105 5.48*** 0.002 0.10 (0.018) (2.11)** SEG 0.017 0.82 (0.017) (1.18) (0.001) (0.18) CURR 0.002 1.17 0.002 0.63 (0.001) (0.34) ATURN 0.010 0.59 0.029 1.65* 0.002 0.21 FOREIGN 0.087 3.47*** 0.024 1.29 0.003 0.38 INTERCEPT -0.174 (0.78) 0.080 0.35 0.948 18.84*** Industry Fixed
Effects Yes Yes Yes
Year Fixed Effects Yes Yes Yes No. of Observations 6627 6622 6619 Adj. R2 26.2% 10.8% 4.6%
*The t-statistics are in parentheses. *, **, *** denote the statistical significance at the 10 percent, 5 percent, and 1 percent levels, respectively (two-tailed test). T-statistics based on standard errors clustered by a firm are shown in parentheses.
39 Panel B: Liq2 is the