Deliverable D 2.3
Accident causation and pre-accidental driving situations.
Part 3. Summary report
Contractual Date of Delivery to the CEC: M30, June 2008.
Actual Date of Delivery to the CEC: September 2009 (Version 3)
Author(s): A. Molinero, H.Evdorides, C. Naing, A. Kirk, J. Tecl, J.M. Barrios, M.C. Simon, V. Phan, T. Hermitte
Participant(s): CIDAUT, UoB (Department of Civil Engineering), VSRC, CDV, IDIADA, LAB
Workpackage: WP2 – Type of situations.
Validated by WP2 leader: Thierry Hermitte (LAB)
Validated by reviewers: All the authors.
Validated by TRACE Coordinator: Yves Page (LAB).
Est. person months: 1
Security: Public.
Nature: Summary Report.
Version: 3.
Total number of pages: 71
Abstract:
This report aims to present the final results of the descriptive statistical, in-depth and risk analysis performed within TRACE Work Package ‘WP2-Type of situations’, in order to identify the main problems and the magnitude of these problems related to accident causation and risk factors for the following four types of situations: the stabilized situations, the specific manoeuvres, the intersection situations and the degraded situations.
The different analysis (descriptive, in-depth and risk) of each of these five tasks has been performed using the available European accident databases within TRACE (national, in-depth and exposure databases).
The objectives achieved in this WP are:
• Identify and quantify accident causation factors associated to particular types of driving and pre-accidental situations, at a statistical level, by analyzing various available databases in Europe.
• Obtain a focused understanding of accident causation issues related to these types of situations at an in-depth level by analyzing data from available in-depth databases.
• Identify the level of risk associated to these selected types of situation in causing accidents.
Keyword list:
Descriptive analysis, in-depth databases, risk factors, accident causation, type of situations, stabilized situation, specific manoeuvre, intersection situations, degraded situation.
September 2009 - 2 -
Table of contents
1
Acknowledgements ...4
2
Introduction ...5
2.1
Objective of the TRACE project ... 11
2.2
The operational work packages in TRACE... 12
2.3
Accident causation and type of situations... 17
2.3.1 The types of situation ...18
2.3.2 The methodology used for the accident causation analysis...20
2.3.3 The Human functional failure analysis...23
2.3.4 Data supply...26
2.3.5 Main issues...27
3
The stabilized situations ...28
3.1
Definition ... 28
3.2
Descriptive analysis... 28
3.3
Accident causes and risk ... 31
3.3.1 Situation ST-1 ...31
3.3.2 Situation ST-2 ...33
3.3.3 Situation ST-3 ...37
4
The situations involving specific manoeuvres ...41
4.1
Definition ... 41
4.2
Descriptive analysis... 41
4.3
Accident causes and risk ... 44
4.3.1 Situation SP-1 : Overtaking manoeuvre ...44
4.3.2 Situation SP-2: Turning left manoeuvre...45
4.3.3 Situation SP-3: U-turning manoeuvre ...46
4.3.4 Situation SP-4: Changing lane ...47
5
The intersection situations ...48
5.1
Definition ... 48
5.2
Descriptive analysis... 48
5.3
Accident causes and risk ... 52
5.3.1 Scenario IN-1 ...53
5.3.2 Scenario IN-6 ...57
5.3.3 Risk factors...58
6
The degraded situations...59
6.1
Definition ... 59
6.2
Descriptive analysis... 59
6.3
Accident causes and risk ... 60
6.3.1 Accidents where degradation was a causation factor ...62
6.3.2 Findings of analysis using HFF methodology...63
6.3.3 Potential solutions ...65
6.3.4 Risk Analysis ...65
6.3.5 Overall Conclusions and Recommendations...66
7
Conclusions and perspectives...68
September 2009 - 4 -
1
Acknowledgements
The Trace Partners have access to national and in-depth accident databases. The results presented in this report are based on the work performed by the according organisations keeping the databases.
No guarantee can be given on the correctness of the interpretations of the results. The conclusions drawn might not reflect the views of the organisations and partners, respectively.
This report is mainly based on in-depth accidents databases coming from Spain, UK, Germany, Italy and France.
The analysis describes in this report would not have been possible without the kind permission of the organisations responsible for these databases and the authors would like to acknowledge their support. In particular, acknowledgement is given to those who provided information via the WP8 data supply process, including the following:
From UK:
National Accident Data for Great Britain (STATS19) is collected by police forces and collated by the UK Department for Transport. The data are made available to the Vehicle Safety Research Centre at Loughborough University by the UK Department for Transport. The Department for Transport and those who carried out the original collection of the data bear no responsibility for the further analysis or interpretation of it.
The UK OTS project is funded by the UK Department for Transport and the Highways Agency. The project would not be possible without help and ongoing support from many individuals, especially including the Chief Constables of Nottinghamshire and Thames Valley Police Forces and their officers. The views expressed in this work belong to the authors and are not necessarily those of the UK Department for Transport, Highways Agency, Nottinghamshire Police or Thames Valley Police.
Acknowledgement is also given to Martin Maguire at Loughborough University, who assisted with the analysis of UK OTS in this study.
From Spain:
Spanish Road Accidents database is carried out by a public organisation called DGT, dependent of the Ministry of the Interior. Information contained in DGT Spanish Road Accidents Database is collected by police forces, when an accident occurs. The data are made available for CIDAUT since 1993. The Department for Transport and those who carried out the original collection of the data bear no responsibility for the further analysis or interpretation of it.
‘DIANA’ database: CIDAUT counts with spanish accident investigation teams in the region of Valladolid (Spain) that travel immediately to the accident scene to perform an ‘in-depth investigation’, in close cooperation with police forces, medical services, forensic surgeons, garages and scrap yards. All information gathered is stored in an own ORACLE database (called DIANA) for further exploitation jointly with access to other accident databases, as for example the national one coming from the DGT (Dirección General de Tráfico) which provide information on every injury accident.
From France:
BAAC (Bulletin d’Analyse des Accidents Corporels): National accident database for France collected by police, CRS and Gendarmerie forces and provided by ONISR (Observatoire National Interministériel de Sécurité Routière). The data are made available to the Laboratory of Accidentology, Biomechanics and human behaviour PSA Peugeot-Citroën, Renault.
September 2009 - 5 -
2
Introduction
According to the World Health Organization and other sources, the total number of road deaths, while not completely accurate, is estimated at 1.2 million, with a further 50 million injured every year in traffic accidents. Two thirds of the casualties occur in developing countries. 70 % of casualties in these countries are vulnerable road users such as pedestrians, cyclists and motorcyclists.
From major studies published by the World Health Organization, many publications have identified the growing importance of road crashes as a cause of death, particularly in developing and transitional countries. Murray (1996) showed that in 1990 road crashes as a cause of death or disability were by no means insignificant, lying in ninth place out of a total of over 100 separately identified causes. However, by the year 2020 forecasts suggest that as a cause of death, road crashes will move up to sixth place and in terms of years of life lost (YLL) and ‘disability-adjusted life years’ (DALYs) will be in second and third place respectively.
These Projections show that, between 2000 and 2020, road traffic deaths will decline by about 30% in high-income countries but increase substantially in low and middle-income countries.
The European Community has been trying for many years to promote initiatives through the different Framework Programs in order to contribute to the safety effort. However, without a real target, the progress is difficult to evaluate. This is why, in 2001, the European Commission published its “White Paper” on transport policy (European Commission 2001), in which the main research axes to be improved and quantified targets are determined for road traffic safety.
The short-term strategic objective is to halve the number of fatalities by 2010 compared to 2001. The medium term objective is to cut the number of people killed or severely injured in road accidents by around 75% by 2025, while the long-term vision is to render road transport as safe as all other modes. It is hoped that supporting research addressing human, vehicle and infrastructure environment could achieve this last strategic target. Research should also combine measures and technologies for prevention, mitigation and investigation of road accidents paying special attention to high risk and vulnerable user groups, such as children, handicapped people and the elderly. However, since 2001, the European Union has grown from 15 member states1, to 25 members2 in
2002 and 27 countries3 in 2007, and unfortunately, the road safety target is not a criterion of
eligibility for the integration of the new countries.
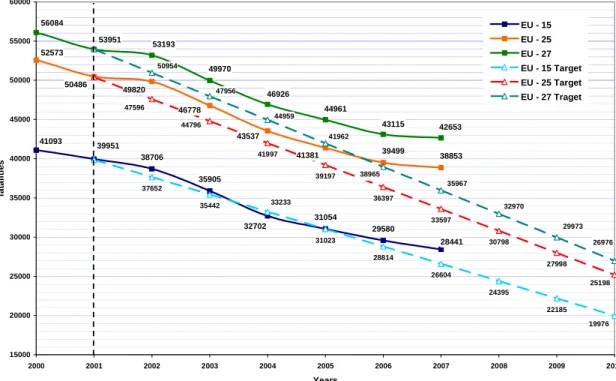
Figure 1 shows the difference between the real fatality curve and the predicted one considering the different composition of the Europe (EU15 in blue, EU25 in red and EU27 in green).
Up to 2005, only EU15 was on the way to reach the EC target. But the last results (even if the numbers for 2007 are not completely fixed) show that in spite of a decline of the road fatalities, we deviate more and more from the target (+7% for EU15, +15% for EU25 and +19% for EU27).
If nothing is done today, the deadline cannot be reached at all. 2010 is tomorrow.
If current trends continue, the EU-27 is likely to reach its target only in 2019 and in 2017 for the EU25. The EU-15 countries, which originally set the target, are likely to halve the number of deaths in 2013 as the estimations (based on linear decreasing on 2001-2007 period) shows in Figure 2.
1 EU15 was composed by Austria, Belgium, Denmark, Finland, France, Germany, Greece, Ireland, Italy, Luxembourg, Netherlands, Portugal, Spain, Sweden and United Kingdom.
2 EU25 was composed by the EU15 associated to the 10 new members: Czech Republic, Estonia, Cyprus, Latvia, Lithuania, Hungary, Malta, Poland, Slovakia and Slovenia.
September 2009 - 6 - Figure 1: European road traffic fatalities from 1995 to 2007
(Source CARE, IRTAD, IRF, ETSC, and National Databank statistics).
Estimation based on the average annual percentage reductions fatalities over the period 2001-2007
Figure 2 : Expected year of reaching the target for EU27, EU25 and EU15 (Source CARE, IRTAD, IRF, ETSC, and National Databank statistics).
29580 31054 32702 35905 39951 38706 28441 39499 38853 41381 50486 49820 43537 46778 42653 43115 44961 46926 49970 53193 53951 15000 20000 25000 30000 35000 40000 45000 50000 55000 60000 2001 2002 2003 2004 2005 2006 2007 2008 2009 2010 2011 2012 2013 2014 2015 2016 2017 2018 2019 2020 Years fa ta li ti e s EU - 15 EU - 25 EU - 27 EU15 estimation EU25 estimation EU27 estimation 31054 29580 37652 35442 31023 28814 26604 24395 22185 41997 39197 36397 33597 30798 27998 28441 38706 41093 39951 35905 32702 46778 43537 49820 50486 52573 41381 39499 38853 56084 53951 53193 49970 46926 44961 43115 42653 33233 19976 25198 47596 44796 32970 35967 50954 47956 26976 29973 44959 41962 38965 15000 20000 25000 30000 35000 40000 45000 50000 55000 60000 2000 2001 2002 2003 2004 2005 2006 2007 2008 2009 2010 Years fa ta li ti e s EU - 15 EU - 25 EU - 27 EU - 15 Target EU - 25 Target EU - 27 Traget
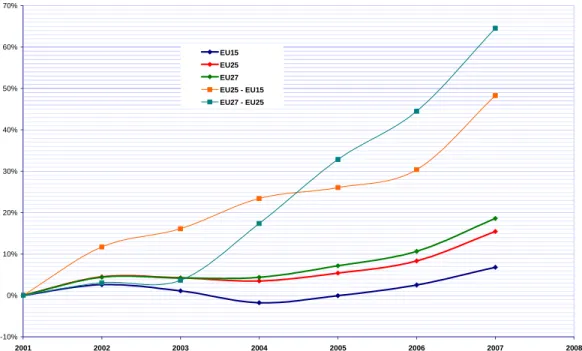
September 2009 - 7 - However, these global results hide the real problem. Due to the high contribution of the EU15 in the total number of fatalities (74%), the efforts in the western European countries compensates the worth results from the eastern countries. Now, if we consider the contribution of the different clusters composing the EU27, the deviations to the target are in 2007, +7% for EU15, +48.2% for EU25-EU15 and +64.5% for EU27-EU25.
Figure 3: Evolution in time of the deviation to the target from 2001 to 2007 (Source CARE, IRTAD, IRF, ETSC, and National Databank statistics).
By fixing a target at the European level, the EC proved its commitment for decreasing the mortality on the European roads. But this objective is maybe too much abstracted for certain countries, not knowing well how to spread it inside. Specific indicators by country should have been proposed. With a global target, we can judge only the performance at the European level. These can be enough when the results go in the right way, but in case of deviation, it could be difficult to identify where the weaknesses are and how to solve them.
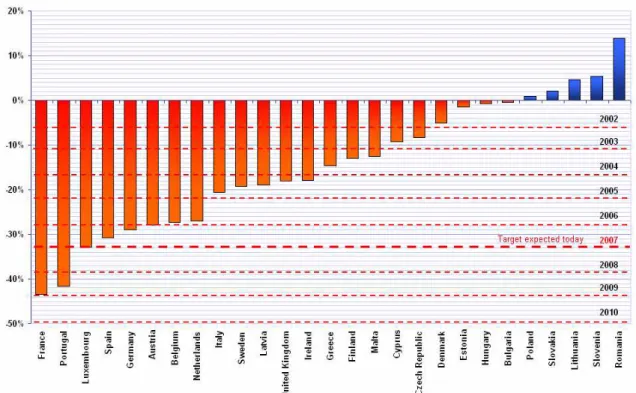
A first analysis can be based on the evolution of the fatalities, applying the target (halved the number of fatalities in 2010 compared to 2001) at each country. For example in France, the target for 2010 is to decrease the number of road fatalities at least to 4081 deaths. Knowing the final target (-50%) and the deadline (9 years), we can calculated for each year an intermediate target. Each year, the country performance is given by the gap compared to the corresponding target (Figure 4). In this figure, the dash lines (in red) describe the intermediate targets at each time step. If we look at the results country by country, for the majority of them the total number of fatalities in 2007 decreased compared to 2001, with all the EU15 states included in this set. Leaving the basic idea that the rate of decrease of the road fatalities should be the same for all countries (independently of its contribution on the total number of road fatalities in EU27), only 3 countries (France, Portugal and Luxembourg) are on the way. The situation can be raised for 5 countries (Spain, Germany, Austria, Belgium and Netherlands, worrying for 5 (Italy, Sweden, Latvia, UK and Ireland) inaccessible for 3 (Greece, Finland and Malta) and impracticable for the rest (Cyprus, Czech Republic, Denmark, Estonia, Hungary, Bulgaria, Poland, Slovakia, Lithuania, Slovenia and Romania). -10% 0% 10% 20% 30% 40% 50% 60% 70% 2001 2002 2003 2004 2005 2006 2007 2008 EU15 EU25 EU27 EU25 - EU15 EU27 - EU25
September 2009 - 8 - Figure 4 : Distribution of the road fatalities evolution in 2007compared to 2001
for European states (Source CARE, IRTAD, IRF, ETSC, and National Databank statistics). If this first indicator has merit to be simple and easy to set up, it does not take into account the contribution of the country to the total number of road fatalities in Europe.
In Table 1 are given the classification of the countries in decreasing order following its contribution to the European road fatalities in 2001 and 2007.
On the right side of this table (colored columns) are given the tendency in 2007 compared to 2001, first in percentage (increasing , stable or decreasing ) and then in ranking (increasing ,
stable ⊳ or decreasing ).
Table 1 : Ranking of the country following its contribution to the number of fatalities in EU27 (Source CARE, IRTAD, IRF, ETSC, and National Databank statistics).
Rank Country Contribution Cumulated Rank Country Contribution Cumulated %
1 France 15,13% 15% 1 Poland 13,09% 13% -3
2 Germany 12,93% 28% 2 Italy 12,46% 26% -1
3 Italy 12,40% 40% 3 Germany 11,62% 37% 1
4 Poland 10,26% 51% 4 France 10,83% 48% 3
5 Spain 10,23% 61% 5 Spain 8,96% 57% ⊳⊳⊳⊳ 0
6 United Kingdom 6,67% 68% 6 United Kingdom 6,91% 64% ⊳⊳⊳⊳ 0
7 Romania 4,55% 72% 7 Romania 6,55% 70% ⊳⊳⊳⊳ 0
8 Greece 3,48% 76% 8 Greece 3,76% 74% ⊳⊳⊳⊳ 0
9 Portugal 3,10% 79% 9 Hungary 2,88% 77% -3
10 Belgium 2,75% 81% 10 Czech Republic 2,86% 80% -1
11 Czech Republic 2,47% 84% 11 Belgium 2,53% 82% 1
12 Hungary 2,30% 86% 12 Bulgaria 2,36% 85% -2 13 Netherlands 2,01% 88% 13 Portugal 2,28% 87% 4 14 Bulgaria 1,87% 90% 14 Netherlands 1,85% 89% 1 15 Austria 1,78% 92% 15 Lithuania 1,73% 91% -1 16 Lithuania 1,31% 93% 16 Austria 1,62% 92% 1 17 Slovakia 1,14% 94% 17 Slovakia 1,47% 94% ⊳⊳⊳⊳ 0 18 Sweden 1,08% 95% 18 Sweden 1,10% 95% ⊳⊳⊳⊳ 0 19 Latvia 0,96% 96% 19 Latvia 0,98% 96% ⊳⊳⊳⊳ 0 20 Finland 0,80% 97% 20 Denmark 0,96% 97% -1 21 Denmark 0,80% 98% 21 Finland 0,88% 98% 1 22 Ireland 0,76% 99% 22 Ireland 0,79% 99% ⊳⊳⊳⊳ 0 23 Slovenia 0,52% 99% 23 Slovenia 0,69% 99% ⊳⊳⊳⊳ 0 24 Estonia 0,37% 100% 24 Estonia 0,46% 100% ⊳⊳⊳⊳ 0 25 Cyprus 0,18% 100% 25 Cyprus 0,21% 100% ⊳⊳⊳⊳ 0 26 Luxembourg 0,13% 100% 26 Luxembourg 0,11% 100% ⊳⊳⊳⊳ 0 27 Malta 0,03% 100% 27 Malta 0,03% 100% ⊳⊳⊳⊳ 0 Evolution Rank Situation in 2001 Situation in 2007
September 2009 - 9 - From this table, we can see that 80% of the total road fatalities in Europe rely only on 9 countries among which 5 have a contribution superior to 10 %. A solution would have been able to be to fix an objective of -36% for the 20% (representing an annual average decrease of 4%) and of a target to -54% for the others 80% (annual average decrease of 6%). The global objective so spread would have certainly asked a supplementary effort the countries where the road fatalities is high and a more realistic objective for the others (20% * 36% + 80% * 54% = 50%).
However, this type of classification based on the fatalities contribution at the EU27 level does not take into account the real risk associated to the population (road deaths per million of population). A strong correlation exists between a high fatality contribution and the number of population. For example, the 7 first countries ranking in table 1 are also the 7 first one for those the total number of inhabitants in the highest.
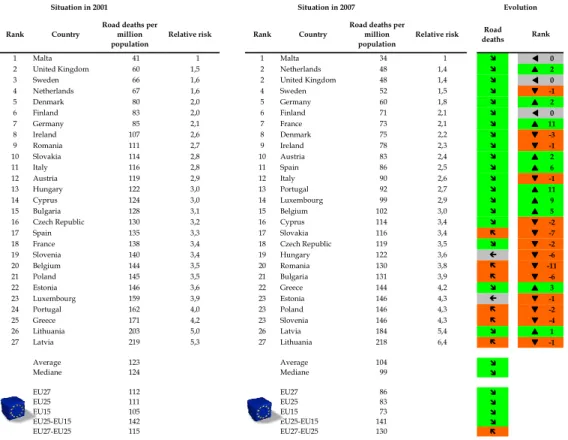
In the following table the situation in 2001 and 2007 for European countries ranked by road deaths per million of population is given. In 2007, we can see that some progresses have been done, especially in the EU15 countries. The situation worsened for 6 countries: Slovakia, Romania, Bulgaria, Poland, Slovenia and Lithuania, this last one having taken the last place. One of the reasons is due to the double effects of an increase of the road fatalities increased with a clear slowing down of the number of inhabitants. Certainly a variation of the number of deaths on roads plays on the number of inhabitants but this contribution remains negligible with regard to the other demographic parameters.
Table 2 : Ranking of the country following the road deaths per population in EU27 (Source CARE, IRTAD, IRF, ETSC, and National Databank statistics).
Let us return on the situation in 2001. If we put the hypothesis of an increase of the European population of 3 % in 2010 with regard to 2001 (it is at present 2 % in 6 years), then the reduction by 2 of the road fatalities leads an average of 43 deaths per million of inhabitants. In 2007, this average is 104 (+142%).
All these results show that the distance between the western countries and the eastern ones in Europe increase time after time.
Rank Country
Road deaths per million population
Relative risk Rank Country
Road deaths per million population
Relative risk Road deaths
1 Malta 41 1 1 Malta 34 1 ⊳⊳⊳⊳ 0
2 United Kingdom 60 1,5 2 Netherlands 48 1,4 2
3 Sweden 66 1,6 2 United Kingdom 48 1,4 ⊳⊳⊳⊳ 0
4 Netherlands 67 1,6 4 Sweden 52 1,5 -1 5 Denmark 80 2,0 5 Germany 60 1,8 2 6 Finland 83 2,0 6 Finland 71 2,1 ⊳⊳⊳⊳ 0 7 Germany 85 2,1 7 France 73 2,1 11 8 Ireland 107 2,6 8 Denmark 75 2,2 -3 9 Romania 111 2,7 9 Ireland 78 2,3 -1 10 Slovakia 114 2,8 10 Austria 83 2,4 2 11 Italy 116 2,8 11 Spain 86 2,5 6 12 Austria 119 2,9 12 Italy 90 2,6 -1 13 Hungary 122 3,0 13 Portugal 92 2,7 11 14 Cyprus 124 3,0 14 Luxembourg 99 2,9 9 15 Bulgaria 128 3,1 15 Belgium 102 3,0 5
16 Czech Republic 130 3,2 16 Cyprus 114 3,4 -2
17 Spain 135 3,3 17 Slovakia 116 3,4 -7
18 France 138 3,4 18 Czech Republic 119 3,5 -2
19 Slovenia 140 3,4 19 Hungary 122 3,6 -6 20 Belgium 144 3,5 20 Romania 130 3,8 -11 21 Poland 145 3,5 21 Bulgaria 131 3,9 -6 22 Estonia 146 3,6 22 Greece 144 4,2 3 23 Luxembourg 159 3,9 23 Estonia 146 4,3 -1 24 Portugal 162 4,0 23 Poland 146 4,3 -2 25 Greece 171 4,2 23 Slovenia 146 4,3 -4 26 Lithuania 203 5,0 26 Latvia 184 5,4 1 27 Latvia 219 5,3 27 Lithuania 218 6,4 -1 Average 123 Average 104 Mediane 124 Mediane 99 EU27 112 EU27 86 EU25 111 EU25 83 EU15 105 EU15 73 EU25-EU15 142 EU25-EU15 141 EU27-EU25 115 EU27-EU25 130
Situation in 2001 Situation in 2007 Evolution
September 2009 - 10 - To show that there is problem is the easy step; find solutions to solve it can be more difficult because the problem is complicated by itself: many actors, many factors, several cultures, …, and it can be different from a country to another one.
Everyone at different level has a role to play. For example:
At European level:
• To update knowledge on road safety; • to fix targets and deadlines;
• To spread the European target to the countries by fixing realistic objective; • To define performance indicators to follow the progress;
• To develop the necessary tools of help to the safety diagnosis (common databases, causation model, etc.);
• To develop the tools useful for the evaluation of the safety measures • To accompany countries on the safety improvement
• Etc. At country level:
• To define with the Europe a realistic target;
• With the “local” actors (government, road maker, car manufacturer, politicians, associations, etc.) to define a safety policy
• To define the safety measures
• To define their own safety indicators adapted to the measures • Set up the tools delivered by the Europe;
• To report to the Europe • Etc.
Of course this list is not complete.
But, it is clear that before to launch anything, a complete diagnostic have to be set up (or update) in order to identify the problems.
The European Commission is therefore very keen to acquire an understanding of accident and injury causes, and research activities aimed at developing and assessing support tools such as accident causation research and impact assessment analysis. It appears that the Commission has expressed two kinds of interest as regards accident analysis (cf. Strategic Objectives 2005-2006: 2.4.12: eSsafety – Co-operative systems for road Transport):
“In support of the eSafety initiative, and as a pre requisite for diagnosis and evaluation of the most promising active safety technologies:
• Research in consistent accident causation analysis to gain a detailed knowledge about the real backgrounds of European traffic accidents using existing data sources.
• Research to assess the potential impact and socio-economic cost/benefit, up to 2020, of stand-alone and co-operative intelligent vehicle safety systems in Europe”.
TRACE addresses the first concern (accident causation) and the benefit part of the second (impact assessment of technologies).
The main objectives of the TRACE project are to improve road safety and to reduce or avoid road accidents in Europe by identifying two main issues:
• The determination and the continuous up-dating of the aetiology, i.e. causes, of road accidents under three different but complementary research angles: road users, types of situations and types of factors.
• The identification and the assessment (in terms of saved lives and avoided accidents), among possible technology-based safety functions, of the most promising solutions that can assist the driver or any other road users in a normal road situation or in a emergency situation or, as a last resort, mitigate the violence of crashes and protect the vehicle occupants, the pedestrians, and the two-wheelers in case of a crash or a rollover.
September 2009 - 11 -
2.1
Objective of the TRACE project
The general objective of TRACE project (TRaffic Accident Causation in Europe) is to provide the scientific community, the stakeholders, the suppliers, the vehicle industry and the other Integrated Safety program participants with an overview of the road accident causation issues in Europe, and possibly overseas, based on the analysis of any current available databases which include accident, injury, insurance, medical and exposure data (including driver behaviour in normal driving conditions). The idea is to identify, characterise and quantify the nature of risk factors, groups at risk, specific conflict driving situations and accident situations; and to estimate the safety benefits of a selection of technology-based safety functions.
To carry out these objectives, TRACE is broken down into three series of Work packages:
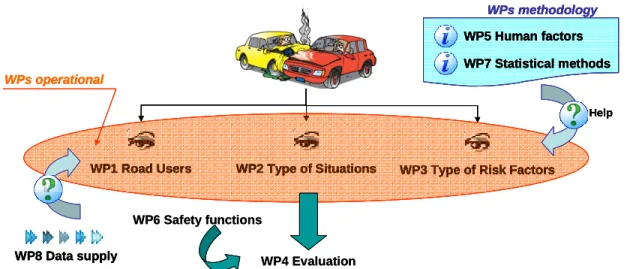
• The operational work packages are dedicated to accident causation and the evaluation of the safety benefits of safety functions. Because accident causes depend on research objectives, the original aspect proposed in TRACE was to propose three different views of the accident: the road user (WP1), the situation (WP2) and the human factors (WP3). These three axes of research should normally cover the main aspects. The evaluation of the safety benefits of safety functions (WP4) lies on the estimation of the effectiveness of these safety systems in terms of expected (or observed) accidents avoided and lives saved
• The methodology work packages, as suggested by their name, cover the methodological aspects needed by the operational and evaluation groups. Three work packages are concerned: WP7 (statistical methods) with the twin objective of improving statistical methodology in empirical traffic accident research and providing statistical services and methodological advice to other work packages, WP5 (Human Function Failure) looking at the role played by the human component in the traffic system, which is innovative and WP6 (Safety functions) which is to make a comprehensive overview of the safety functions available or under development.
• The data supply work package (WP8) provides data obtained from the sources available to the TRACE project to support data analysis activities in the other work packages (principally Work Packages 1, 2, 3 and 4) and the eIMPACT project. The objective is not to produce a common database, but to combine results coming from different countries in answer to the requests made by the operational work packages.
Figure 5: Organisation of the TRACE project.
WP1 Road Users WP2 Type of Situations WP3 Type of Risk Factors
WPs operational
WP1 Road Users WP2 Type of Situations WP3 Type of Risk Factors
WP1 Road Users WP2 Type of Situations WP3 Type of Risk Factors
WP1 Road Users
WP1 Road Users WP2 Type of SituationsWP2 Type of Situations WP3 Type of Risk FactorsWP3 Type of Risk Factors
WPs operational WPs operational WP8 Data supply WP8 Data supply WP8 Data supply Help WPs methodology WP5 Human factors WP7 Statistical methods Help WPs methodology Help WPs methodology WPs methodology WP5 Human factors WP7 Statistical methods WP5 Human factors WP5 Human factors WP7 Statistical methods WP7 Statistical methods WP4 Evaluation WP6 Safety functions WP4 Evaluation WP6 Safety functions
September 2009 - 12 -
2.2
The operational work packages in TRACE
The main objective of the operational work packages is to propose a detailed and a comprehensive study on accident causation, providing a framework to define accident causation and analysing European traffic accidents using existing data sources.
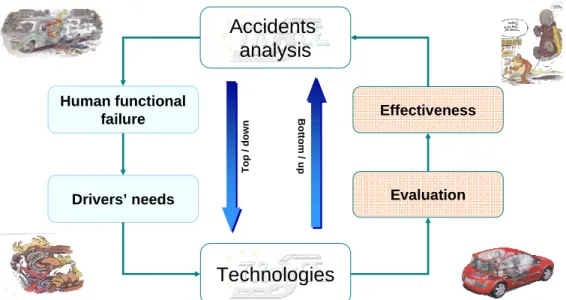
Today, accident analysis is a central point in a road safety approach. It allows either to identify solutions (technologies or safety measures) that well fit to the problems revealed by the analysis (top/down approach) or to quantify the effectiveness or such or such technology (or safety package) in face of the “real world” (bottom/up approach).
Figure 6 : Road safety approach using Top/down and Bottom/Up process In road safety, the identification of the accident causes is necessary for the following reasons:
• To fight the disease it is necessary to be able to identify it, to quantify it (its magnitude) and to give its main characteristics (its frame). This is the safety diagnostic.
• Because the problems are several, their kinds different and their interaction varied, accident causation allows to define the road safety priorities according to the real life. These priorities can be different as we are responsible for public health (the states responsible of our security and safety), car manufacturer and suppliers to improve the safety of vehicles or road makers to build safer roads.
• To define performance key indicators in order to be able to measure their evolution and to be more reactive before the things get worse;
• To evaluate the a priori effectiveness of the most promising counter-measures; • To measure the effectiveness of safety actions set up
• To prepare the future regulations in relationship with the real safety;
• To develop some performance tests to assume that the safety systems well answer to the regulations and the real safety;
• To know for each actor its responsibility part of the disease;
• In a competitive world, to be able to place oneself in relation to the others. For example make comparison between countries or regions, or between products proposed by the industrials;
• To identify the lack in the data collection displayed by the analysis and make propositions for the update.
• To anticipate the future problems on the road.
Accidents
analysis
Technologies
Drivers’ needs Evaluation
Effectiveness Human functional failure T o p / d o w n Bo tt o m / u p
September 2009 - 13 - To reach the objective, several challenges have to be raised. Among these, the most important questions where we have to bring some elements of answer are the following:
• What is “accident causation”? • What can we do with existing data? • How can we update our knowledge? • Can we represent the EU27?
• How can findings assist safety benefit analyses?
Of course, the first question remains the key of vault of this study, even if the others can have an influence on the orientations for the methodology to be applied.
In “accident causation”, the causes are related to the notion of accident. An accident can be defined as an unplanned event, generally associated with negative consequences such as fatalities, injuries, near misses, damaged materials or … shattered nerves.
To understand the causes of accidents in order to be able to identify effective means for their prevention, several theories of accident causation have been proposed coming for most of them from accident prevention in enterprise:
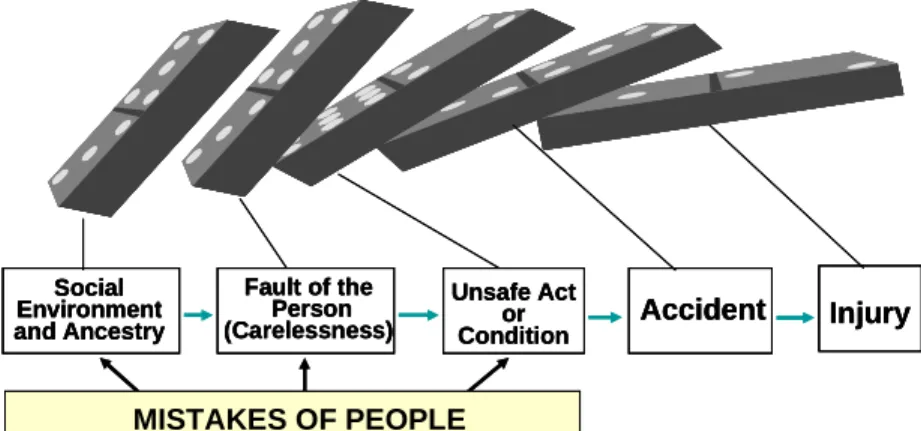
• The Domino theory: developed in 1931 by H. W. Heinrich; itstates that an accident is only one of a series of factors, each of which depends on a previous factor in the following manner (Heinrich 1980):
1. Accident causes an injury.
2. Individual's negligent act or omission, or a faulty machine, causes an accident. 3. Personal shortcomings cause negligent acts or omissions.
4. Hereditary and environment cause personal shortcomings.
The model relies on the facts that 88% of accidents caused by unsafe acts, 10% by unsafe conditions and 2% are unavoidable. The more remote causes of accident consisted of the environmental and social conditions, controlled by the management, within with the accident occurred. On this basis an accident investigation model can be developed. A salient feature of most of these immediate cause categories is the inclusion in their description of the characterization of the actions or conditions (e.g.: unsafe, inadequate, dangerous, etc.). These notions require definitions that except in specific cases (laws, regulations, etc.) are very difficult to catch, letting the investigator’s subjective judgment (after the accident has occurred) to decide of what is safe and what is unsafe.
Figure 7: The domino theory developed by Heinrich H. Social Environment and Ancestry Fault of the Person (Carelessness) Unsafe Act or
Condition Accident Injury
MISTAKES OF PEOPLE Social Environment and Ancestry Social Environment and Ancestry Fault of the Person (Carelessness) Fault of the Person (Carelessness) Unsafe Act or Condition Unsafe Act or
Condition AccidentAccident InjuryInjury
September 2009 - 14 - • The “Human Factors” theory: The accident causation can be attributed to a chain of events ultimately caused by human error, driven by overload (due to environmental factors such as noise, distraction, or internal factors - personal problems, emotional stress- or situational factors - unclear instructions, risk level), inappropriate response/compatibility (like identifying hazard but not correcting it, remove safeguards, ignoring safety , etc.) or inappropriate activities (performing tasks without the requisite training, misjudging the degree of risk involved with a given task, etc.).
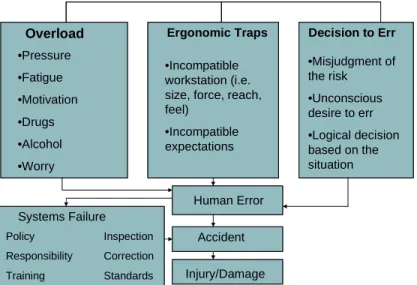
• The “Accident/Incident” model: It is an extension of Human Error Theory by adding ergonomic traps and decision to err. This theory also includes system failure as a cause of accident. Petersen developed this model (Petersen D. 1975).
Figure 8 : Illustration of the Accident/incident theory developed by Petersen D.
• The Epidemiological theory: Traditionally, safety theories and programs focused on accidents and injuries. However, a broader perspective that includes industrial hygiene must also be considered. Industrial hygiene concerns environmental factors that can lead to sickness, disease, or other forms of impaired health. Epidemiological theory studies the relationship between environmental factors and accidents or diseases. The model is based on the identification on two characteristics :
- Predisposition characteristics related to susceptibility of people, perceptions or environmental factors;
- Situational characteristics such as risk assessment by individuals, peer pressure, priorities of the supervisor, or attitude, etc.
The two characteristics, taken together, can result in or prevent conditions that might result in accident or illness. For example, a worker who is susceptible to peer pressure is more likely to have an occupational accident or illness.
• The “Systems” theory: The notion consist to consider accident causation as a system, a system being a group of regularly interacting and interrelated components that together form a unified whole.System theory views a situation in which an accident might occur as a system comprised of three components:the person (host), the machine (agency) and the environment. The likelihood of an accident is determined by how the three components interact. In industrial environment, 5 factors have to be considered: job requirements, the worker’ abilities and limitations, the gain if the task is successfully accomplished, the loss if the task is attempted but fails, and the loss if the task is not attempted.
Overload •Pressure •Fatigue •Motivation •Drugs •Alcohol •Worry Ergonomic Traps •Incompatible workstation (i.e. size, force, reach, feel) •Incompatible expectations Decision to Err •Misjudgment of the risk •Unconscious desire to err •Logical decision based on the situation Overload •Pressure •Fatigue •Motivation •Drugs •Alcohol •Worry Ergonomic Traps •Incompatible workstation (i.e. size, force, reach, feel) •Incompatible expectations Decision to Err •Misjudgment of the risk •Unconscious desire to err •Logical decision based on the situation Systems Failure Policy Inspection Responsibility Correction Training Standards Systems Failure Policy Inspection Responsibility Correction Training Standards Human Error Accident Injury/Damage Human Error Accident Injury/Damage
September 2009 - 15 - Figure 9 : Illustration of the « Systems » theory.
• The “Combination” theory: This theory starts from the fact that for some accidents, a given model can explain why accident happened and for others, the model cannot explain. According to the combination theory, the actual cause may combine parts of several different models. This theory is suitable for accident prevention and investigation.
• The “Behavioural” theory: Often referred to as behaviour-based safety (BBS). It is based on the 7 following principles:
1. Intervention
2. Identification of internal factors
3. Motivation to behave in the desired manner
4. Focus on the positive consequences of appropriate behaviour 5. Application of the scientific method
6. Integration of information 7. Planned interventions
All these theory allow to establish models which must be then sustained by investigations on the scene and by the elaboration of databases including the relevant parameters for the analysis. This is the process used for in-depth investigations now.
Most of these theories have been used in road safety, still today, focusing in one specific point of view. But the road accident remains more complex than in other domain, because the human is at the centre of the regulation. He has to interact with the machine (drive his car: hold the steering wheel, change direction, brake, change gear, declutch, accelerate, look at mirrors, etc.), to interact with an unsettled environment (lighting conditions, weather conditions, road surface, road geometry, road signs, etc.), to interact with the other users (pedestrian, 2 wheelers users, etc.). All these factors and interactions make that the accident causes are multiple, not unique, can be independent each others, not having the same end, with different degree of implication, can be different following who makes the analysis, etc. in others words a not predictable system.
The analytic approach that allows decomposing into understandable elements a complicated system (which is predictable even if several iterations are useful to describe its behaviour) cannot be applicable to a complex system. The challenge is to build a model for a system, which is a priori not foreseeable.
A solution consists to use the theory based on the systemic approach. The target is to represent the systems as a “general system”, i.e. not as an aggregate of independent and understandable entities but rather as a system which is organized, which works, which evolves and which is finalized. The theory of the systems was based by Ludwig von Bertalanffy (Bertalanffy 1950, 1968, 1974), William Ross Ashby and the others between 1940s and 1970s and takes its inspiration from the previous works on the cybernetic (Wienner, 1950). Since, this theory evolved in several movements in United States and in France.
Machine Person Environment Interaction Task to be performed Collect information Weigh risks Make decision Feedback loop
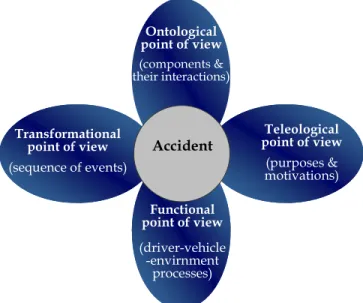
September 2009 - 16 - All the interest of this new concept relies on the various points of view allowing to define an object. In this theory a system can be viewed by four fundamental axles (see Figure 10):
• The ontological axle which define all the component of the studied object.
• Teleological axle which allows to define the purposes and the motivations associated to the object.
• Functional axle which define its function or process
• Transformational axle, which take into account the development of the object.
Figure 10 : A new framework for accident description based on systemic approach
In fact, if we look at this approach in details for the road safety field, we can see this theory as a “meta model” which contains all the models usually used in accident research:
For the ontological axle, we can find the HVE model (Human, Vehicle, and Environment) allowing to describe the three main components of the accident.
For the transformational axle, we have the Sequential model, which allows to describe the dynamic aspect of the accident process (see Figure 11);
For the functional axle, we have the Human functional failure model which allows to analyse the process of the human malfunction;
For the teleological axle, different elements more or less structured (social aspects, driver tasks, etc.) but a real model is missing for the moment.
Its applications can be numerous in road safety, in particular to analyze databases and to report weaknesses on points of view not well documented (Ben Ahmed 2003).
Another more interesting application is for the accident causation analysis. Even if this theoretical model is not clearly visible in TRACE, it used as the frame of the analysis proposed in operational work-packages.
Firstly, as a “user” of a data accident collection defined on the different points of view as we seen before. For example, the risk factors analysis (WP3) starts with a review on the state of art and the identification of the factors (ontological), then looks for the contextual and underlying elements which can explain the presence of the factor (teleological), such as cultural or social aspects for example, and look at how these factors contribute (functional), what is their role during the accident process (transformational).
Transformational point of view (sequence of events) Transformational point of view (sequence of events) Functional point of view (driver-vehicle -envirnment processes) Functional point of view (driver-vehicle -envirnment processes) Teleological point of view (purposes & motivations) Teleological point of view (purposes & motivations) Ontological point of view (components & their interactions) Accident
September 2009 - 17 - Secondly, as theoretical base allowing to carry out a complete analysis:
• Teleological aspect: the objectives of the accident causation analysis in TRACE are on one hand to update our knowledge on the road safety problems in Europe and on the other hand to identify the most effective counter-measures.
• Ontological aspect: the three work packages (WP1: Road users, WP2: type of situations, WP3: risk factors) are the main components of the accident causes and are complementary. • Functional aspect: Different approaches (or models) exist to identify the accident causes
(see the different theories exposed above). In TRACE, this analysis relies on a common methodology based on three steps: descriptive analysis (define the stake and magnitude of the problems), in-depth analysis (understand how the problems occur) and risk analysis (identify the most exposed “population” to the problem). During each analysis, the interactions between the different components (road users, type of situations and risk factors) are also taken into account.
• Transformational aspect: the change of the road safety context, the contribution of each study and the availability of the data sources make that the knowledge on the topic evolves. Especially in TRACE, the use of the statistical tools brought by the WP7, the type of data supplies by WP8, the new approach HFF (Human Functional Failure) developed by the WP5, and the progress made on the evaluation methods carried out under WP4 contribute to the evolution of the topic.
It is this theoretical frame that we tried to use for the analysis of the accident causes in Europe.
2.3
Accident causation and type of situations
As previously seen, the accident can be considered as a complex object, and consequently the study of its causes too. A way to dread this scientific challenge is either to work on a more simplified problem (Cartesian model) or to divide the problem into understandable, controllable and complementary elements describing entirely4 the object (Systemic approach).
The first approach gives the opportunity to have an immediately update using By using a tried methodology but which can be incomplete and reveal only a part of the “iceberg”, the other part being either not visible or not accessible with this theory.
The second approach much more theoretical allows to improve the representation of the studied object, to take into account new approaches, and to make progress on the data collection putting finger on the weaknesses. This approach (described in the previous chapter) is the one addressed by TRACE for the part dedicated to the improvement and the update of the knowledge on accident causation.
From the state of art, 3 research angles have been proposed to cover the accident causation in TRACE:
- The study of the accident causation related to the road users (WP1 – Road users). Because problems are often different for each type of road users, this angle is particularly appropriate to identify specific and dedicated safety measures or actions.
- The study of the accident causation related to the situation in which a road user is involved (WP2 - type of situations). Starting from the principle that the accidental mechanism can be different according to the accident situation, it is important to be able to identify them to find adequate solutions well fitted with the needs of the driver/rider.
- The study of accident causation from the main risk factors (WP3 – Risk factor). Most of these accidental risks are known and have already studied (alcohol, speed, distraction, etc.). However their consideration in the in-depth data collections are specific to each study, and their joint analysis can raise some problems mainly due in interpretations which can be different. This approach allows to target the safety measures regarding the most important risk factors independently (at least at the beginning of the analysis) of the road users or the accidental situation, and also to be able to identify the future ones.
September 2009 - 18 - These 3 views only define the “vital lead” of the accident causation in TRACE, the first door of the analysis and we can guess that the respective classifications which will ensue from it will be richer and complementary.
These various analyses allow to raise a good diagnosis of the current road safety problems and so to help in the selection of the actions to set up.
Another point is that they can be applied as well at the European level (to define general orientations) as at the level of every country where locally the problems can be different.
The WP2 is one of the 3 operational work packages of TRACE. Its objective is to improve the knowledge on the accident causes by analyzing the accident from the point of view of the pre-accidental situation in which the road users were involved just before the collision.
2.3.1
The types of situation
First, we need to clarify what we understand here by situation.
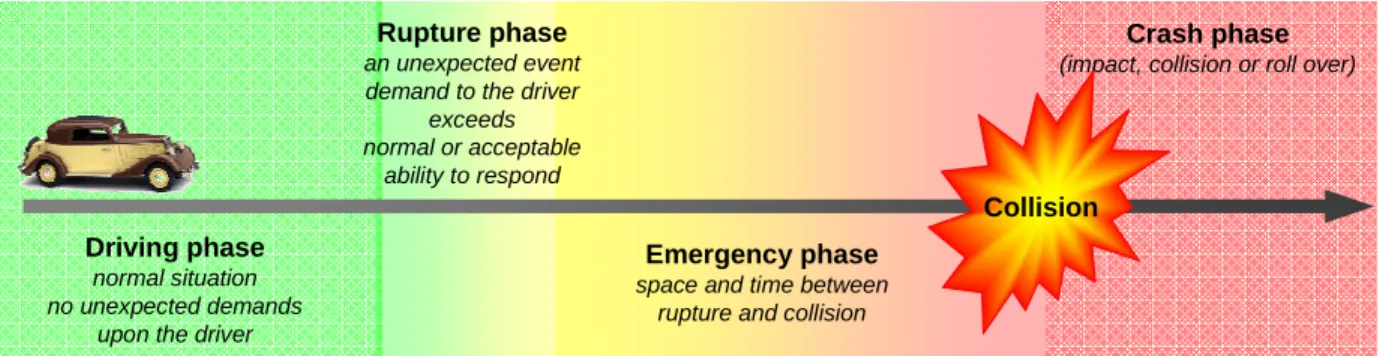
A way of drawing up the accident scenario is to determine the sequence of events. These ones are divided into four phases, connected one to the others:
• The driving phase: the driving situation can be described as the one in which the user is before a problem arises. It is the'normal' situation, which is characterised for the driver by the performance of a specific task in a given context, with certain objectives, certain expectations, and so on. It is 'normal' because no unexpected demands are made upon him. • The rupture phase: the 'rupture' is an unexpected event that interrupts the driving situation
by upsetting its balance and thus endangering the system.
• The emergency phase: it is the period during which the driver tries to return to the normal situation by carrying out an emergency manoeuvre.
• The crash phase: the crash phase comprises the crash and its consequences. It determines the severity of the accident in terms of material damage and bodily injury.
Figure 11: Accident view as a sequential event
In this report a situation is defined as a pre-accidental situation to which the driver/rider/pedestrian is confronted in normal driving conditions just before it turns into an accident situation5 (corresponds to the end of the green area in the previous figure) . It is assumed
that there are specific accident causation factors related to these situations that deserve to be studied. The types of situation can include one or more accident scenarios6 which contributed to
the accident.
By this definition, we can see that a situation can be directly related to a road user. In other words, there are as much situations as number of road users involved in injury accidents (pedestrian included).
5A situation is linked to a vehicle. One accident whit two vehicles count two situations 6 A scenario clusters several similar situations according to predefined criteria.
Driving phase
normal situation no unexpected demands
upon the driver
Rupture phase
an unexpected event demand to the driver
exceeds normal or acceptable
ability to respond
Emergency phase
space and time between rupture and collision
Crash phase
(impact, collision or roll over)
September 2009 - 19 - It is very important to well distinguish the notions of accident and situation. Let us see the following example.
This case represents the pre-accidental scene between a car (noted A, in blue) a motorcycle (noted B, in red) and a truck with trailer (noted C, in grey). The driver decides to overtake the truck moving ahead, changes the lane and the car collides the motorcycle coming in the opposite direction. In this case, 3 road users are present (the car, the motorcycle and the truck + trailer) but only 2 are involved in this accident (the car and the motorcycle). For the accident causation analysis only these 2 road users will be studied, each of them with its own corresponding situation.
Figure 12 : Example of road accident with 2 different situations
Four specific groups of situations, which correspond either to normal driving situations with no specific driver solicitation, or to driving manoeuvres where the driver is specifically solicited, have been identified:
• Stabilized Traffic Scenarios: The idea is to analyze the accident causation in situations that
would not be considered as hazardous per se. Normal driving situations can become risky due to specific failures (e.g. guidance errors) or sudden conflict situations with other road users. For example, this scenario consists of a road user driving normally on a straight road or entering a curve, etc. This type of situation corresponds to the motorcycle one in the previous example.
• Intersection Scenarios: The target is to analyze the accident causation for each road users
involved in accident at intersection. Statistical and in-depth analyzes provide the task with an overview of the conditions under which accidents at crossings and intersections occur. The magnitude of intersection accidents and the most relevant accident situations will be defined based on the pre-accidental manoeuvres. Distributions of the main pre-crash parameters will be established for each situation.
• Specific Manoeuvre Scenarios: This task investigates accidents due to scenarios created by
performing specific driving manoeuvres (e.g. overtaking, U-turning, car-following, joining a carriageway, etc.). Some driving manoeuvres can increase accident risk in relationship with a particular highway characteristic. This task will address scenarios on all road types.
• Degradation Scenarios:This task is concerned with the presence of factors which degrade
the road way, the environment (fog, heavy rain) and trigger accidents. Among the factors which will be considered are night time, lighting issues and conspicuity; weather conditions which affect visibility and speed leading to loss of control; deteriorated highway conditions as result of obstruction, surface contamination; etc.
A
B
C
September 2009 - 20 - These four types of situations has been defined as the beginning of the project and they should be covering the majority of the real situations which may occur in road injury accidents. Certain atypical accidents or situations will never fit neatly into a fixed classification.
The first three situations (Stabilized, Intersection and Specific Manoeuvres) are mutually exclusive without overlap (see next figure). The degradation scenarios are however a subset of the other scenarios. We can find so degraded situations at intersection for example.
Figure 13 : Scope of each situation studied in TRACE
Of course, other choices would have been possible. The present choice is based on the following arguments:
• Most of the promising safety devices are relied on active safety, i.e. on events prior to the crash. It is important to take into account situations corresponding to the pre-accidental phase to identify the problems at the “source” of the accident.
• The selected situations have to be as generic as possible and do not have to answer to a specific technology. In this top/down approach (see Figure 6) the most important is to identify the problems.
• Because accident process is sequential, all phases have to be taken into account, not only one. Others contributing factors (some are news, others were presents but not “active”) can play a role in this process. The pre-accidental situation is only the “root” of the analysis. • The complementarily of the selected situations. They cover the majority of the situations
without any overlap. Regarding the estimation of the effectiveness of safety device, avoid overlaps, facilitates the selection of the corresponding accidents. This is the case for the 3 first types, but not for the “degradation situations”. However, it is important to identify this type of situation because the accidental mechanisms occurring in these cases are different from those of 3 other groups (ex: visibility, perception, surface conditions, etc.).
2.3.2
The methodology used for the accident causation analysis
The objective of this study is to identify the main accident causes from the pre-accidental situation in which each road users was involved.
Degraded situation Degraded situation Situations Situations Injury Accidents Injury Accidents Stabilized situation Stabilized
situation IntersectionIntersection
Specific manoeuvres
Specific manoeuvres
September 2009 - 21 - Given that several causes can exist for a given accidental situation and that there are so many situations as road users involved in these same accidents, we see that without a good methodology this study can become very hard.
Rather than to study the causes situation by situation, we chose to group together the situations having resemblances in scenario then to identify the causes from each scenario (see Figure 14). The concept of scenario allows to simplify the analysis by working only on monograms where only the most frequent causes will be held.
Injury Injury Injury
Injury accidentsaccidentsaccidentsaccidents
Situation 1 Situation 2 … Situation i
Scenario 1A … Scenario 1j Scenario 1A … Scenario 1j Scenario 1A … Scenario 1j Causation a Causation b Causation c … … Causation x
Figure 14 : Methodology applied to the accident causation analysis To do that we propose to work on the following scheme:
1. Classification of the accident situations into 4 representatives clusters. These 4 types have already been defined at the beginning of the project. They are: stabilized situations, intersection, specific manoeuvres and degraded situations. In this first step, the main idea is to convert injury accident cases into situations.
2. Identification and description of scenarios for each type of situations. Inside the 4 pre-defined types of situations, the target is to gather in a same monograms (or class) situations having similarities. These similarities have to be defined not only with the help of the available variables from accident databases, but also have to take into account the specificity of the studied situation, the accident process, the manoeuvres and the knowledge of the expert. The number of scenarios depends of the degree of the similarities researched. One of the criteria is that the identified scenarios have to be consistent, i.e. they have to be few and to represent a non neglected part of the situations inside the considered type. From this step, only the most representative scenario will be studied.
3. Identification of the main causes for each important scenario. From the previous step, the idea here is to analyse in details each scenario in order to identify and to characterize the problems having been at the origin of the accident. The idea is to identify relevant indicators and to use the Human Functional Failure analysis developed by WP5.
4. Identification of the risks of being involved in this type of situations. For each scenario the idea is to identify among the included road users a population where the risk of involvement would be more important than for the others.
September 2009 - 22 - In this scheme, the first step represents the criteria to select the corresponding sample that will have to be studied. For the situations occurring at intersection, this sample will be composed by every road users involved in injury accident at intersection.
The only issue in this step relies only on a clear definition of the scope of each type of situations and on its translation in criteria of selection.
These basic elements will be defined at the beginning of each part dedicated to the results for each type of situations.
The next 3 steps represent the core of this study (see Figure 15). They are based on 3 types of analyses very different due to their objective and the type of data used:
• The descriptive analysis. It corresponds to the 2nd step. For each predefined situations, 3
main objectives are looked for here: which are the associated stakes, which are the most represented scenarios and which are their main characteristics. This analysis essentially relies on descriptive statistics. As regards the data to be used it has to allow defining the stakes as well as general characteristics at the European level. This support must thus be the most representative as possible of the road injury accidents in Europe and to include some descriptive variables rather “rough” to be easily mixed but rather relevant for the elaboration of the scenarios. We shall thus appeal to said "extensive" (or descriptive) injury accidents databases based on the national data of every European country (CARE, IRTAD, other).
• The in-depth analysis. It corresponds to the third step. After the identification of the main scenarios defined in the previous step, this analysis details each of them providing information on their accident mechanisms, their main causes and other relevant factors characterizing them.(such as precipitating event, contributing factors, driver failures, etc.). This analysis requires the use of in-depth databases.
• The risk analysis. It corresponds to the last step. The objective is to identify among the appropriate samples for each scenarios if a particular population (or group of individuals) has a risk more or less raised to be involved in this kind of situations. The idea is not to evaluate and to compare the risk for each population, but rather to identify those who distinguish themselves by either an over-risk or an under-risk of being involved in an injury accident. This analysis requires the use of exposure data (related to the exposed population) and in-depth data also.
September 2009 - 23 -
2.3.3
The Human functional failure analysis
There are many ways to analyze accidents and accident mechanisms. For example, LAB developed its own accident analysis model in order to understand the production of the accidental situation. This model was inspired by previous work and especially those carried out by INRETS at the beginning of the nineteen eighties in the south of France and identify:
• The sequential description of the accident circumstances,
• The events that could have contributed to convert a driving situation into an accident situation,
• The nature of the driver functional failure (e.g. perception, comprehension, decision, action)and the mechanism of the human failure (e.g. driving errors, unavailability of information, under-activation to driving),
• An identification of manoeuvres carried out by the drivers and the trajectories of the vehicles. • And finally the sequential correspondence between car kinematics parameters and human
cognitive parameters, from the initial conflict situation to the impact. This is the final step of the accident analysis: its reconstruction.
The use of such a model has already produced interesting results. For example, INRETS has examined French in-depth accident data and has proposed to set a classification of accidents based on the production of human failure. The fundamental idea of this approach is to consider the human error not as a cause of the accident but rather as a consequence of malfunctions occurring in the interactions between the driver and his environment. Some causes of the error are considered to be internal to the driver whereas other causes are considered to be external. In this research, the error is exclusively studied, just before the accident situation, from the driver perspective. It could actually be argued that part of the cause of an accident could be nested within the organization of traffic, production of vehicles, individual proneness to be involved in accidents, economical context, urban management, or other complex multi-factorial factors.
We propose now to detail the different concepts that we will use in this analysis.
The in-depth analysis will focus on the rupture phase in which an event interrupted the driving situation. This event will be considered as the cause of the accident and it will be named “Key event”. Moreover, we will consider too, all factors which contribute to convert a driving situation into an accident situation and which give any chance to the driver to convert an emergency situation into a driving situation. These factors will be named “contributing factors”.
The key event and the contributing factor are classified by categories and sub-categories and are the results of the literature review and the current data collection system (TRACE-WP5-D5.2, 2007). The categories are defined as follow:
• Internal condition of the task: it is related to the task that the driver is performing, but refers more specifically to the ‘conditioning’ of the driver to the task (i.e. the informal rules the driver follows, either consciously or sub-consciously, the driver adopts a non adapted speed considering its driving situation).
• Driver behaviour: behaviour of the road user can affect the way they control their vehicle and respond to both their internal and external surroundings. This category refers to a problem of inattention, distraction or perception.
• Driver state: The ‘state’ of the user includes physical, physiological or psychological conditions, either pre-existing or brought on by substances taken, such as alcohol or drugs. • Experience: The user’s prior exposure to the task in hand or their surroundings will affect
the way they process information. Experience can be related to the non experience of the situation or of the driving task or to the over experience of the driver.
September 2009 - 24 - • Road environment: it deals with factors linked to infrastructure such as a visibility limited
by infrastructure or a road layout not adapted to the situation.
• Traffic condition: it refers to the conditions in which the user is driving. The flow, speed or density of the traffic on the road will potentially affect the road user’s ability to undertake their journey
• Vehicle: This category involves the equipment or devices the user is interacting with in the task such as the maintenance of the vehicle, all mechanical or electro-mechanical problems or the load.
2.3.3.1
The human functional failure
These failures are related to the functions that a driver must do in loops in order to ensure the driving task: perception, diagnostic, prognostic, decision, action. Of course, functions are not independent and can eventually be performed simultaneously.
Perception is related to the situation as a whole. There is a problem of perception whenever the driver did not perceive something that he should have perceived whatever the thing not perceived (opponent, road signs, information, danger, etc.). Actually, problem of perception does not exclusively mean lack of perception. It could also be a late perception or an incorrect perception. This last statement (late or incorrect) also holds for the other functional failures.
Diagnostic refers to the determination of values of parameters (distance to other vehicles, other vehicle speed, road width, curve radius…) that the driver needs to drive correctly and adapt his own trajectory and speed to its environment.
Prognostic refers to the comprehension process of the driving situation: once the situation is perceived and evaluated, is it correctly interpreted and anticipated? Here is an example of the articulation between evaluation and interpretation: let's say that a driver is driving up to a junction. He's got the right of way. He is looking at the secondary road as well and sees a vehicle on this road: he perceives the vehicle. He evaluates the speed of this vehicle. He feels like the vehicle is slowing down while coming to the stop sign. He interprets the situation as a normal situation: the other vehicle is slowing down. He could then make an interpretation failure by considering that the other driver is going to stop because he is slowing down whereas he is going to slide the stop without stopping.
Decision refers to a problem while perception, diagnostic and prognostic were correctly performed: once he has perceived, evaluated and interpreted, the driver can make a decision failure: he does not decide or decides incorrectly or decides too late what the situation requires from him. For example, he sees a bend, evaluate its radius and adherence, interprets it as risky but decides to slow down too late.
Action: needless to say: there is a problem in the action itself: for example, let us assume in the previous situation that he decides to slow down in time. He can brake hard instead of slowing down. This is an action failure.
September 2009 - 25 - Human functional failures find explanation with “Explanatory elements” including endogenous elements related to the driver (state, behaviour, task) and exogenous elements related to the driver environment (traffic conditions, road, vehicle) as described below:
Figure 17: Human functional failure and explanatory elements More details can be found in report TRACE-WP5-D5.1.
2.3.3.2
Degree of involvement of the driver
This analysis allows us to identify the role played by the driver in the genesis of the accident. Close to the notion of 'responsibility', it differs from this latter by the reference not to a legal code but by the recourse to a strictly behavioural reference ('code'). In an ergonomic approach, this information tries only to clarify the respective degree of participation of the various users involved in the same accident, from the point of view of the degradation of the situations. Four modalities are so defined which show in a decreasing way the degree to which the driver participates by his behaviour to the fact that the critical situation turned to an accident:
Primary active: this modality designates the drivers who 'provoke the disturbance'. They have a determining functional involvement in the genesis of the accident: they are directly at the origin of the destabilization of the situation.
Secondary active: these drivers are not at the origin of the disturbance which precipitates the conflict, but they are however part of the genesis of the accident by not trying to resolve this conflict. Potentially able to anticipate whereas they do not, they so contribute to the genesis of the accident by the absence of adapted preventive strategies. Examples: absence of behavioural adaptation because they expect an adjustment from the other user, no anticipation of a possible conflicting pathway with others although alarming indications, etc.
Non-active: these drivers are confronted with an atypical manoeuvre of others that is hardly predictable, whether it is or not in contradiction with the legislation. They are not considered as 'active' subjects because the information they had did not enable them to prevent the failure of others.
Passive: these drivers are not involved in the destabilization of the s