University of North Dakota
UND Scholarly Commons
Education, Health & Behavior Studies Faculty
Publications
Department of Education, Health & Behavior
Studies
9-2019
Efficacy of Open Textbook Adoption on Learning
Performance and Course Withdrawal Rates: A
Meta-Analysis
Virginia Clinton
University of North Dakota, [email protected]
Shafiq Khan
Follow this and additional works at:
https://commons.und.edu/ehb-fac
Part of the
Education Commons
This Article is brought to you for free and open access by the Department of Education, Health & Behavior Studies at UND Scholarly Commons. It has been accepted for inclusion in Education, Health & Behavior Studies Faculty Publications by an authorized administrator of UND Scholarly
Commons. For more information, please [email protected].
Recommended Citation
Clinton, Virginia and Khan, Shafiq, "Efficacy of Open Textbook Adoption on Learning Performance and Course Withdrawal Rates: A Meta-Analysis" (2019).Education, Health & Behavior Studies Faculty Publications. 42.
AERA Open July-September 2019, Vol. 5, No. 3, pp. 1 –20 DOI:https://doi.org/10.1177/2332858419872212
Article reuse guidelines: sagepub.com/journals-permissions © The Author(s) 2019. http://journals.sagepub.com/home/ero
Creative Commons Non Commercial CC BY-NC: This article is distributed under the terms of the Creative Commons Attribution-NonCommercial 4.0 License (http://www.creativecommons.org/licenses/by-nc/4.0/) which permits non-commercial
TexTbooks are useful and ubiquitous teaching and learning resources in education (Behnke, 2018). Commercial text-books have been frequently criticized for their high prices, which have increased substantially in the past few decades (Blomgren, 2018; Perry, 2015). These prices contribute to the financial cost of education that is shouldered by taxpay-ers and students. As an alternative to commercial textbooks, open textbooks, which are electronically accessible without charging the user, have been developed (Smith, 2009). Many studies have examined differences in learning performance as well as course withdrawal rates between open and com-mercial textbooks (see Hilton, 2016, 2018, for reviews). However, results have been mixed with some showing posi-tive results (Colvard, Watson, & Park, 2018; Hilton, Fischer, Wiley, & Williams, 2016), some showing negative results (e.g., Gurung, 2017), and some showing no difference between commercial and open textbooks (Allen et al., 2015; Grissett & Huffman, 2019; Medley-Rath, 2018). The pur-pose of this article is to meta-analyze the research findings comparing learning performance and course withdrawal rates between open and commercial textbooks. The findings from this meta-analysis may be used to inform instructors and institutions with their choice of textbooks.
Literature Review
The development of open textbooks is part of a broader movement in open educational resources (OER). OER is an umbrella term for a variety of learning materials, including
textbooks, videos, online modules, music, brief readings, and music (Butcher, 2015). According to the William and Flora Hewlett Foundation (2019), which has supported OER for decades, OER are
teaching, learning, and research resources that reside in the public domain or have been released under an intellectual property license that permits their free use and re-purposing by others. (para. 7) Textbooks were the focus of this manuscript for three rea-sons. One is that textbooks are commonly used learning resources throughout postsecondary education (Illowsky, Hilton, Whiting, & Ackerman, 2016). Another reason is that open textbooks are a type of OER that has a notable body of research on its efficacy (Weller, de los Arcos, Farrow, Pitt, & McAndrew, 2015). Finally, by focusing the analyses on a single type of OER (in this case, textbooks), the compari-sons between OER and commercial resources are clearer.
A survey of postsecondary faculty found that many fac-ulty express frustrations with the high costs of commercial materials, and a majority of faculty agreed that the high cost of commercial materials was a problem (Seaman & Seaman, 2018). However, the same survey indicated that one of the major concerns that faculty have about adopting open text-books is whether their quality is comparable with commer-cial textbooks (Seaman & Seaman, 2018). Concerns about quality have been noted as a barrier to open textbook adop-tion in other surveys of faculty as well (Belikov & Bodily, 2016; Jhangiani, Pitt, Hendricks, Key, & Lalonde, 2016).
Efficacy of Open Textbook Adoption on Learning Performance
and Course Withdrawal Rates: A Meta-Analysis
Virginia Clinton Shafiq Khan
University of North Dakota
Open textbooks have been developed in response to rising commercial textbook costs and copyright constraints. Numerous stud-ies have been conducted to examine open textbooks with varied findings. The purpose of this study is to meta-analyze the findings of studies of postsecondary students comparing learning performance and course withdrawal rates between open and commer-cial textbooks. Based on a systematic search of research findings, there were no differences in learning efficacy between open textbooks and commercial textbooks (k = 22, g = 0.01, p = .87, N = 100,012). However, the withdrawal rate for postsecondary courses with open textbooks was significantly lower than that for commercial textbooks (k = 11, OR (odds ratio) = 0.71, p = .005, N = 78,593). No significant moderators were identified. Limitations and future directions for research, such as a need for more work in K–12 education, outside of North America, and that better examine student characteristics, are discussed.
Keywords: open textbooks, course withdrawal, open educational resources, meta-analysis
872212EROXXX10.1177/2332858419872212Clinton and KhanOpen-Source Textbook Efficacy
Clinton and Khan
These concerns are not unwarranted. Indeed, in two studies comparing performance on researcher-developed, objective learning measures, students enrolled in courses with com-mercial textbooks outperformed students enrolled in courses with open textbooks (Gurung, 2017). However, there have been numerous studies on open textbooks indicating no meaningful differences in learning compared with commer-cial textbooks (e.g., Clinton, 2018; Engler & Shedlosky-Shoemaker, 2019; Jhangiani, Dastur, Le Grand, & Penner, 2018; Medley-Rath, 2018) that need to be considered along-side Gurung’s (2017) findings. For this reason, a meta-anal-ysis in which the overall efficacy of open textbooks across studies were summarized would be informative for instruc-tors, administrainstruc-tors, and policymakers.
There are reasons to expect that students in courses with open textbooks would outperform those in courses with
commercial textbooks. According to the access hypothesis,
many students do not purchase the textbook because of the cost (Grimaldi, Basu Mallick, Waters, & Baraniuk, 2019). Therefore, the use of an open-source textbook would allow more students to have access to the textbook, which would logically improve student performance on learning measures dependent on textbook access (e.g., quiz performance on required readings). In addition, having access to a textbook also provides students with a resource to help them better understand the content covered in class. Following this hypothesis, students should do better in courses with open textbooks than commercial textbooks.
Examinations of studies on open textbook efficacy have been the topic of two systematic reviews (Hilton, 2016, 2018) as well as nonsystematic, narrative reviews (Clinton, 2019a; Wiley, Bliss, & McEwen, 2014). In these reviews, the overall conclusions based on qualitative analyses were that OER, including open textbooks, were as effective for student learn-ing as commercial materials. These reviews provide thought-ful, in-depth thematic analyses of the research on the topic. However, there are no published meta-analyses on this topic, to our knowledge, and conducting meta-analyses would build on these reviews by combining the effects of multiple studies to get overall quantitative effect sizes.
Given that random assignment is generally not feasible for comparing textbooks, nearly all of the research has involved quasi-experiments with varying levels of quality in terms of controlling for confounders, such as comparing courses taught by different instructors. These methodological limita-tions constitute a significant limitation in research on the effi-cacy of open textbooks (see Griggs & Jackson, 2017; Gurung, 2017, for discussions). A meta-analysis could examine some of the potential effects of these confounders by including moderator analyses based on study quality variables. The use of the same instructor in courses with open textbooks com-pared with commercial textbooks is important given the vari-ability in grading practices and pedagogical quality across individual instructors (de Vlieger, Jacob, & Stange, 2017). Another confounder to consider is whether student prior
achievement or knowledge varied when comparing courses. This is important to consider given that prior academic per-formance is a clear predictor of future perper-formance on learn-ing measures (Cassidy, 2015). Furthermore, in one study, a course with an open textbook had higher average grades than the same course with the same instructor using a commercial textbook, but the students in the course with the open text-book had stronger academic backgrounds based on high school grade point averages (Clinton, 2018). In addition, many studies used different instruments to measure learning (e.g., different exams and quizzes that contributed to final grades). The use of different instruments is a clear confounder when comparing learning efficacy from open and commer-cial textbooks as different instruments would likely yield dif-ferent scores due to measurement error.
The availability of an open textbook could potentially influence postsecondary students’ decisions on whether to complete a course or withdraw from it. One reason postsec-ondary students state for withdrawing from a course is that they cannot afford the textbook (Michalski, 2014). Indeed, approximately 20% of postsecondary students report that the expense of a textbook motivated their decision to withdraw from a course (Florida Virtual Campus, 2016). These course withdrawals lead to losses of time and tuition for students and increase the amount of time it takes to complete a degree, making the overall cost of a postsecondary education higher (Boldt, Kassis, & Smith, 2017; Nicholls & Gaede, 2014). Students have indicated that having an open textbook for the course was a reason they completed that course (Hardin et al., 2019). It is possible that postsecondary students who are behind in a course may be more likely to complete the course if there is an open-access textbook they can use to access the material rather than spend hundreds of dollars for a commer-cial textbook. This could potentially lead to courses with open textbooks having lower withdrawal rates than courses with commercial textbooks. However, it should be noted that post-secondary students withdraw from courses for a multitude of reasons that are unrelated to finances, such as stressors in their personal lives or dislike of the instructor (Hall, Smith, Boeckman, Ramachandran, & Jasin, 2003; Michalski, 2014).
Research Questions
Three research questions guided this meta-analytic research:
Research Question 1: What is the efficacy of open text-books compared with commercial texttext-books in terms of student learning?
Research Question 2: What are the differences in with-drawal rates for courses with open textbooks com-pared with commercial textbooks?
Research Question 3: Do differences in confounders in the methodology moderate the results for Research Questions 1 and 2?
Open-Source Textbook Efficacy
Method
A search and analysis plan for this meta-analysis was pre-registered prior to beginning this project (Clinton, 2019b).
Inclusion Criteria
In order to be included in this meta-analysis, the report needed to meet certain criteria. First, the report needed to have findings comparing student learning performance and/ or withdrawal rates between open and commercial text-books. It needed to report sufficient information to be used
in the meta-analysis (e.g., means and standard deviations, t
tests, withdrawal rate, number of students for each textbook type), or the authors provided the necessary information on request (e.g., Grewe & Davis, 2017; Lawrence & Lester, 2018). The report needed to be in English. Postsecondary students needed to be the participants because they are expected to purchase their course materials and are more directly affected by cost. There were no restrictions regard-ing the type of dissemination (e.g., journal articles, disserta-tions, conference presentations), and unpublished findings that were available to the authors of this meta-analysis were eligible.
Search Procedure
A systematic search for studies comparing learning mea-sures and/or withdrawal rates between students using open and commercial textbooks was conducted in multiple steps. First, scholarly dissemination was searched for in the fol-lowing databases: Scopus, DOAJ (Directory of Open Access Journals), ProQuest, PSYCinfo, and ERIC using the search
terms open source textbook* and OER AND textbook were
conducted in August of 2018 (see Appendix A for search terms used). This yielded 578 citations, of which 117 dupli-cates were removed. The titles and abstracts of these 461 citations were screened by the first author, and 97 were determined to be relevant (the internet-based tool Abstrackr was used for screening; Wallace, Small, Brodley, Lau, & Trikalinos, 2012). The full texts of the remaining 97 reports were examined. Based on examinations of the full texts, 20 reports were determined to be relevant (however, further on in analyses, three reports from this list had to be removed because the necessary statistics were not available, but there were backward and forward searches of citations for these reports as described in the following paragraph).
A list of these relevant reports found at this stage was compiled and sent to the Community College Consortium for Open Educational Resources–Advisory listserv, the authors of these reports were emailed, and a tweet was posted on this manuscript’s first author’s Twitter page with the hashtags #oer and #opensource requesting any additional reports or unpublished data (this yielded one additional report). The research reports posted on “The Review Project” of the Open
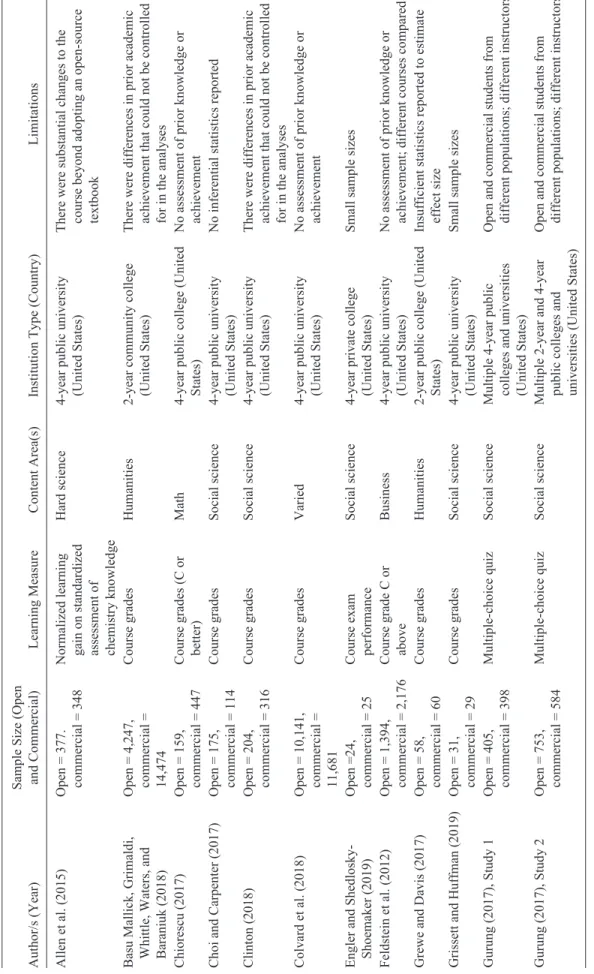
Education Group’s website (https://openedgroup.org/) were also examined, which yielded one more report. After these relevant reports were identified, a backward search of the ref-erence lists of these reports was conducted (no new reports were identified in this way). Then, a forward search of the citations of the relevant reports in Google Scholar was con-ducted, which identified one more report. The titles and abstracts of all presentations at Open Education 2018 were examined, which led to the identification of one more report. The systematic reviews of OER conducted by Hilton (2016, 2018) were examined, but no additional relevant studies were found. This led to a total of 22 reports with 23 independent studies (Gurung, 2017, reported two independent studies). This process ceased in October 2018. Twenty-two of these studies were analyzed in the learning efficacy meta-analysis (Table 1). Eleven of these studies were analyzed in the course withdrawal meta-analysis (Table 2).
Coding of Studies
To provide descriptive information, assess study quality, and obtain information for moderator analyses, the studies were coded using the criteria found in Appendix B. Items pertaining to study quality were based on the Study Design and Implementation Assessment Device (Valentine & Cooper, 2008). The Study Design and Implementation Assessment Device provides researchers with questions to study quality regarding construct, internal, external, and sta-tistical conclusion validity. The studies were coded and dou-ble-coded by the first author. In addition, research assistants coded 25% of the reviews (interrater reliability was good, κ = 0.78; see Follmer, 2018, for a similar approach). The first author resolved disagreements.
Statistical Procedures
To summarize the findings across learning measures,
Hedges’s g was used. Hedges’s g is a standardized mean
dif-ference metric that is bias-corrected based on sample sizes
(Enzmann, 2015; Hedges, 1981). To calculate Hedges’s g for
each learning measure, either descriptive statistics (e.g., means and standard deviations, number of students passing
a course) or inferential statistics (e.g., t tests) in addition to
sample sizes entered into Comprehensive Meta-Analysis software (Version 3; Biostat, Englewood, NJ; note that some effect sizes based on dichotomous dependent variables were converted from the odds ratio to standardized mean differ-ences following Polanin and Snilstveit, 2016). Corresponding authors contacted with requests for any missing statistical information that was necessary. If the relevant statistics could not be obtained, the study was not included (as shown in Figure 1, this was the case for one full text report). A
posi-tive Hedges’s g indicates that the mean values for open
TABLE
1
Descriptions of Studies for Learning Performance Meta-Analysis Author/s (Year) Sample Size (Open and Commercial)
Learning Measure
Content Area(s)
Institution Type (Country)
Limitations
Allen et al. (2015)
Open = 377. commercial = 348 Normalized learning gain on standardized assessment of chemistry knowledge
Hard science
4-year public university (United States) There were substantial changes to the course beyond adopting an open-source textbook
Basu Mallick, Grimaldi, Whittle, Waters, and Baraniuk (2018) Open = 4,247, commercial = 14,474
Course grades
Humanities
2-year community college (United States) There were differences in prior academic achievement that could not be controlled for in the analyses
Chiorescu (2017)
Open = 159, commercial = 447 Course grades (C or better)
Math
4-year public college (United States) No assessment of prior knowledge or achievement
Choi and Carpenter (2017)
Open = 175, commercial = 114
Course grades
Social science
4-year public university (United States)
No inferential statistics reported
Clinton (2018)
Open = 204, commercial = 316
Course grades
Social science
4-year public university (United States) There were differences in prior academic achievement that could not be controlled for in the analyses
Colvard et al. (2018)
Open = 10,141, commercial = 11,681
Course grades
Varied
4-year public university (United States) No assessment of prior knowledge or achievement
Engler and Shedlosky- Shoemaker (2019) Open =24, commercial = 25 Course exam performance
Social science
4-year private college (United States)
Small sample sizes
Feldstein et al. (2012)
Open = 1,394, commercial = 2,176 Course grade C or above
Business
4-year public university (United States) No assessment of prior knowledge or achievement; different courses compared
Grewe and Davis (2017)
Open = 58, commercial = 60
Course grades
Humanities
2-year public college (United States) Insufficient statistics reported to estimate effect size
Grissett and Huffman (2019)
Open = 31, commercial = 29
Course grades
Social science
4-year public university (United States)
Small sample sizes
Gurung (2017), Study 1
Open = 405, commercial = 398
Multiple-choice quiz
Social science
Multiple 4-year public colleges and universities (United States) Open and commercial students from different populations; different instructors
Gurung (2017), Study 2
Open = 753, commercial = 584
Multiple-choice quiz
Social science
Multiple 2-year and 4-year public colleges and universities (United States) Open and commercial students from different populations; different instructors
Author/s (Year) Sample Size (Open and Commercial)
Learning Measure
Content Area(s)
Institution Type (Country)
Limitations
Hardin et al. (2019)
Open = 1,014, commercial = 2,237
Exams
Social science
4-year public university (United States) Different instructors taught courses with OER and commercial textbooks
Hendricks, Reinsberg, and Rieger (2017) Open = 755, commercial = 1,492
Final exam
Hard science
4-year public university (Canada) Limited inferential statistics reported; no analysis of possible differences in prior knowledge
Hilton, Gaudet, Clark, Robinson, and Wiley (2013) Open = 2,043, commercial = 4,164 Course grade of C or better
Math
2-year community college (United States) Confound of changes in course placement policies; inferential statistics not reported
Hilton et al. (2016)
Open = 2,014, commercial = 43,223
Course grade
Varied
2-year community college (United States) Different instructors taught courses with OER and commercial textbooks
Jhangiani et al. (2018)
Open = 94, commercial = 83
Exams
Social science
4-year public university (Canada) Different instructors taught courses with OER and commercial textbooks; summer terms were compared with academic year, may be a different population
Lawrence and Lester (2018)
Open = 178, commercial = 200
Course grades
Social science
4-year public university (United States) Limited reporting of descriptive and inferential statistics for grades; no assessment of prior knowledge or achievement
Medley-Rath (2018)
Open = 23, commercial = 24 Improvement on posttest course grade
Social science
2-year community college (United States) Online courses were mentioned, but not included in analyses; small sample sizes
Robinson (2015)
Open = 1,908, commercial = 1,908
Course grade
Varied
Multiple: 2-year community colleges, 4-year private college, and 4-year public college (United States) Different instructors; no assessment of prior knowledge or achievement
Westermann Juárez and Venegas Muggli (2017) Open = 31, commercial = 30
Course grades
Mathematics
Postsecondary, details N/A (Chile)
Small sample sizes
Winitzky-Stephens and Pickavance (2017) Open = 329, commercial = 1,120
Course grades
Varied
2-year community college (United States) Different courses compared; no assessment of prior knowledge or achievement
Note.
OER = open educational resources; N/A = not applicable.
TABLE
1 (
CONTINUED
For the learning measure, if course grades and learning measures included in the overall course grades were reported (e.g., exam scores), then only course grades were used in the meta-analysis. This was to avoid redundant effect sizes because course grades are inclusive of performance on learn-ing measures within a course (note that Medley-Rath, 2018, had a posttest measure that was not included in the final grade). One exception is Allen and colleagues (2015), because the information to calculated effect sizes based on a standardized learning measure was available, but such infor-mation was not available for course grades. However, there were studies in which multiple measures were reported that had separate scores (e.g., Hardin et al., 2019; Jhangiani et al., 2018). These measures were not independent because they came from the same samples. To account for these multiple
measures that were from the same study (but were separate measures), robust variance estimation (RVE) was used. RVE is a method of incorporating correlations of dependent effect sizes within studies. This approach is more accurate for esti-mating effect sizes than the traditional approach of aggregat-ing multiple effect sizes within a study (Tanner-Smith, Tipton, & Polanin, 2016). Also, a small sample correction was used (Tipton, 2015; see Tipton & Pustejovsky, 2015). The package “robumeta” was used (Fisher & Tipton, 2014). There were 22 studies with 26 measures (and subsequently 26 effect sizes) assessing learning efficacy.
For the withdrawal information, the odds ratio was used to compare the odds of withdrawal in a course that uses com-mercial textbooks compared with one that uses open text-books (see Freeman et al., 2014, for a similar approach). The
TABLE 2
Descriptions of Studies for Withdrawal Rate Meta-Analysis
Author/s (Year)
Sample Size (Open and Commercial) Content Area(s) Institution Type (Country) Limitations Chiorescu (2017) Open =159, commercial = 447
Math 4-year public college (United States)
No assessment of prior knowledge or achievement
Clinton (2018) Open = 232, commercial = 435
Social science 4-year public university (United States)
No subgroup analyses Colvard et al. (2018) Open = 10,141,
commercial = 11,691
Varied 4-year public university No assessment of prior knowledge or achievement
Grewe and Davis (2017)
Open = 95, commercial = 95
Humanities 2-year public college (United States)
No subgroup analyses; different instructors
Grissett and Huffman (2019)
Open = 36. commercial = 34
Social science 4-year public university (United States)
Small sample sizes Hendricks et al.
(2017)
Open = 787, commercial = 1,583
Hard science 4-year public university (Canada)
No analysis of possible differences in scientific attitudes
Hilton and Laman (2012)
Open = 370, commercial = 370
Social science 2-year community college (United States)
Inferential statistics not reported; no assessment of prior knowledge or achievement; courses were redesigned along with adoption of an open-source textbook
Hilton et al. (2013) Open = 2,043, commercial = 4,164
Math 2-year community
college (United States)
Confound of changes in course placement policies; inferential statistics not reported
Hilton et al. (2016) Open = 2,014, commercial = 43,223
Varied 2-year community
college (United States)
Different instructors taught courses with OER and commercial textbooks
Jhangiani et al. (2018)
Open = 139, commercial = 105
Social science 4-year public university (Canada)
Summer terms were compared with academic year, may be a different population
Lawrence and Lester (2018)
Open = 193, commercial = 243
Social science 4-year public university (United States)
Limited reporting of descriptive and inferential statistics for grades; no assessment of prior knowledge or achievement Note. Sample size may vary between withdrawal rate and learning performance measures for the same studies depending on who was included in the authors’ samples and differences in available data.
odds ratio was chosen because findings regarding with-drawal rates, unlike learning measures, were always reported as dichotomous variables. Because there was only one mea-sure of withdrawal rate (and subsequently only one effect size) per the study, RVE was not used. The odds ratio indi-cates the relative odds of withdrawal rate associated with the type of textbook used. An odds ratio less than 1 indicates that the use of open textbooks in courses was associated with a lower withdrawal rate compared with commercial text-books. The withdrawal rate was reported in five studies and provided by authors on request for an additional six studies (i.e., the withdrawal rate not stated in the dissemination, but six authors whose reports were included in the learning effi-cacy meta-analysis were able to locate and share the relevant numbers regarding course withdrawals).
The I2 index was used to report the heterogeneity of effect
sizes. The I2 index ranges from 0 to 100 and indicates the
percentage of heterogeneity across studies not due to chance or sampling error—higher levels indicating a greater degree of heterogeneity. Moderator analyses were appropriate if the
I2 index is more than 20% (Bloch, 2014).
Results
Learning Efficacy
See Appendix C for R code used in analyses and for data sets. A data dictionary for the data sets is also provided in Appendix C.
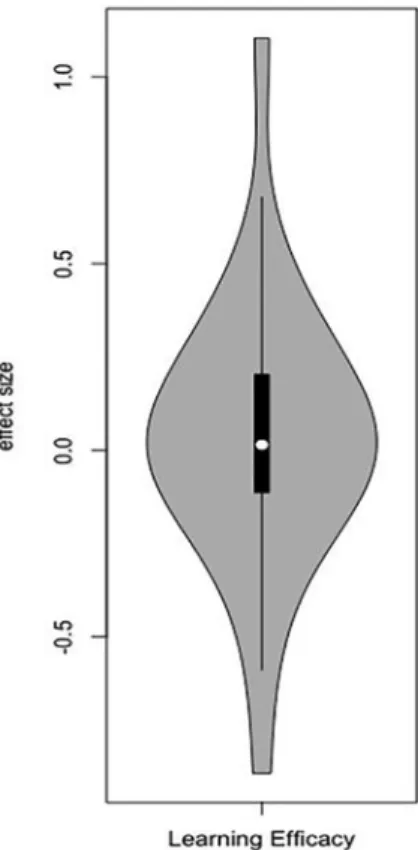
Outliers in the effect sizes were examined using a violin plot prior to synthesizing effect sizes in RVE (see Tanner-Smith et al., 2016). To construct the violin plot, the package vioplot was used (Adler & Kelly, 2018). A violin plot is a combination of a box plot, which displays a measure of cen-tral tendency (either mean or median) and interquartile
Clinton and Khan
FIGURE 2. Violin plot for learning performance studies.
range, and a kernel density plot, which has a smooth curve to indicate the probability density of a variable in a manner similar to a histogram (Hintze & Nelson, 1998). This allows for a visual display of the distribution of the data as well as the summary statistics. The violin plot, shown in Figure 2, has a white circle to indicate the mean and the thin black line to represent the interquartile range. Weights were not used,
but the data displayed in the violin plot, Hedges’s g, were
themselves biased correct for sample size. The violin plot, shown in Figure 2, is normally distributed and slightly left skewed. The effect sizes outside of the thin gray line indicate that there were outliers. However, this was approximately evenly distributed on both sides, and all effect sizes were included so as not to lose information (e.g., Kong, Seo, & Zhai, 2018).
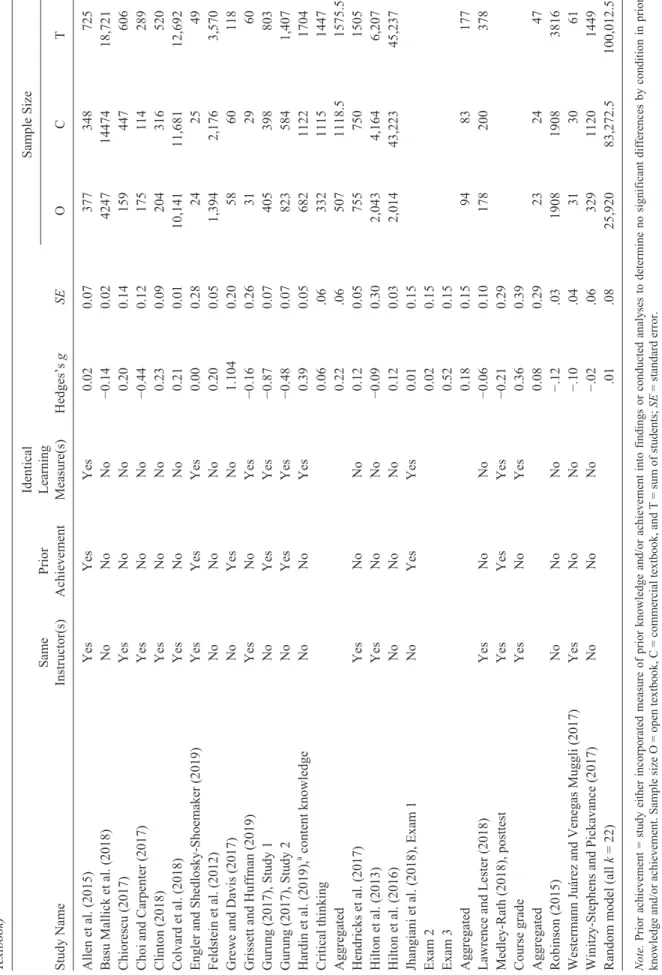
The learning performance overall was first examined,
and the I2 was 98.17, which would indicate a substantial
amount of heterogeneity. Based on the results of the RVE meta-analysis assuming correlated effects of .8, there were no reliable differences in learning performance between dents in courses with open textbooks compared with
stu-dents in courses with commercial textbooks, g = 0.01, SE
(standard error) = 0.08, 95% CI (confidence interval) =
[−0.16, 0.19], p = .87 (see Table 3 for findings by study).
To further examine the null effect found, two approaches were used. The first was a power analysis (Harrer & Ebert,
2018). Based on a small effect size of Cohen’s d = 0.2, the
average number of participants in each study, the number of studies, and a high degree of heterogeneity, the power was 1—indicating a great likelihood that there was sufficient power to detect a small effect. However, there was substan-tial variability with the number of participants in each study. Given this, the analysis was redone with the same variables except that the median number of participants in each study was used. Again, the power was 1.
The second examination was an equivalence test using the package “toster” in R (Lakens, Scheel, & Isager, 2018).
The equivalence test was significant, Z = −2.25, p = .01,
assuming a small effect size of Cohen’s d = 0.2. An
interpre-tation of this finding was that the main effect of learning performance in courses with open textbooks compared with those with commercial textbooks was statistically equivalent to zero.
Publication bias, which is the increased likelihood that statistically significant findings were reported, was assessed in two manners using aggregated effect sizes because there currently is not a validated measure of publi-cation bias with RVE (Friese, Frankenbach, Job, & Loschelder, 2017). The first was the graphical technique of the funnel plot. A funnel plot shows studies graphed
accord-ing to their size along the y-axis in which smaller studies
were toward the bottom, and the effect sizes were along the
x-axis. The line in the middle represents the mean effect. If
there were an asymmetrical distribution on the sides of the
middle line and/or if the distribution of studies was broader at the bottom, then publication bias was likely (Egger, Smith, Schneider, & Minder, 1997). Based on the funnel plot in Figure 3, there did not appear to be publication bias. Publication bias was also tested quantitatively using Egger’s test of the intercept, which did not differ significantly from
zero, β = −1.49, 95% CI [−5.12, 2.13], p = .40, indicating
unlikely publication bias (Cooper, 2015; see Follmer, 2018; Koponen, Georgiou, Salmi, Leskinen, & Aro, 2017, for similar approaches for testing publication bias).
Moderator Analyses. To test for potential moderators, a meta-regression model with each of the moderators as coef-ficients was estimated (see Tipton & Pustejovsky, 2015). Following Borenstein, Hedges, Higgins, and Rothstein (2009), a minimum of six effect sizes per potential modera-tor category was required to conduct moderamodera-tor analyses (see Elleman, 2017, for a similar approach). Therefore, potential moderators such as the same course being com-pared and whether the learning measure was part of a course grade or only for a research study (e.g., for the studies in Gurung, 2017) were not examined.
The moderators examined were whether the instructor was the same for open and commercial conditions, whether prior knowledge or prior student achievement was consid-ered or controlled in the analyses, and whether the learning measure was identical (e.g., the same exam was used) for
TABLE
3
Learning Efficacy Statistics for Each Study and Model Statistics (Positive Hedges’
s g Indicates Better Performance W
ith an Open-Sour ce T extbook Compar ed W ith a Commer cial
Textbook) Study Name
Same
Instructor(s)
Prior
Achievement
Identical Learning Measure(s)
Hedges’s g SE Sample Size O C T Allen et al. (2015) Yes Yes Yes 0.02 0.07 377 348 725
Basu Mallick et al. (2018)
No No No −0.14 0.02 4247 14474 18,721 Chiorescu (2017) Yes No No 0.20 0.14 159 447 606
Choi and Carpenter (2017)
Yes No No −0.44 0.12 175 114 289 Clinton (2018) Yes No No 0.23 0.09 204 316 520 Colvard et al. (2018) Yes No No 0.21 0.01 10,141 11,681 12,692
Engler and Shedlosky-Shoemaker (2019)
Yes Yes Yes 0.00 0.28 24 25 49 Feldstein et al. (2012) No No No 0.20 0.05 1,394 2,176 3,570
Grewe and Davis (2017)
No Yes No 1.104 0.20 58 60 118
Grissett and Huffman (2019)
Yes No Yes −0.16 0.26 31 29 60 Gurung (2017), Study 1 No Yes Yes −0.87 0.07 405 398 803 Gurung (2017), Study 2 No Yes Yes −0.48 0.07 823 584 1,407 Hardin et al. (2019), a content knowledge No No Yes 0.39 0.05 682 1122 1704 Critical thinking 0.06 .06 332 1115 1447 Aggregated 0.22 .06 507 1118.5 1575.5 Hendricks et al. (2017) Yes No No 0.12 0.05 755 750 1505 Hilton et al. (2013) Yes No No −0.09 0.30 2,043 4,164 6,207 Hilton et al. (2016) No No No 0.12 0.03 2,014 43,223 45,237
Jhangiani et al. (2018), Exam 1
No Yes Yes 0.01 0.15 Exam 2 0.02 0.15 Exam 3 0.52 0.15 Aggregated 0.18 0.15 94 83 177
Lawrence and Lester (2018)
Yes No No −0.06 0.10 178 200 378 Medley-Rath (2018), posttest Yes Yes Yes −0.21 0.29 Course grade Yes No Yes 0.36 0.39 Aggregated 0.08 0.29 23 24 47 Robinson (2015) No No No −.12 .03 1908 1908 3816
Westermann Juárez and Venegas Muggli (2017)
Yes No No −.10 .04 31 30 61
Winitzy-Stephens and Pickavance (2017)
No No No −.02 .06 329 1120 1449
Random model (all
k = 22) .01 .08 25,920 83,272.5 100,012.5 Note.
Prior achievement = study either incorporated measure of prior knowledge and/or achievement into findings or conducted
analyses to determine no significant differences by condition in prior
knowledge and/or achievement. Sample size O = open textbook, C = commercial textbook, and T = sum of students;
SE
= standard error.
a Some students took both measures and some were randomly assigned to only take one. In the interests of being conservative, the
aggregated sample size consists of the mean of the sample sizes for the
open and commercial conditions. Each of these potential moderators pertains to methodological quality. Note that Clinton (2018) was coded as “does not consider prior knowl-edge or prior academic performance” because the measure of student prior knowledge was significant between condi-tions and could not be covaried out of the effect size (data were only available at the course level, it was not possible to get student-level data). As can be noted in Table 4, none were significant. However, there were fewer than 4 degrees of freedom for the results with prior knowledge or prior stu-dent achievement as well as for whether the learning mea-sure was identical. With fewer than 4 degrees of freedom, the results cannot be trusted, and therefore, it was inconclu-sive whether these two moderators have effects. In addition, it is not good practice to conduct a power analysis for mod-erators in a meta-regression (Pigott, 2012); therefore, it is uncertain whether the findings for instructor indicated that
there is truly no difference or if there was simply a lack of power to detect a difference.
Withdrawal Rate
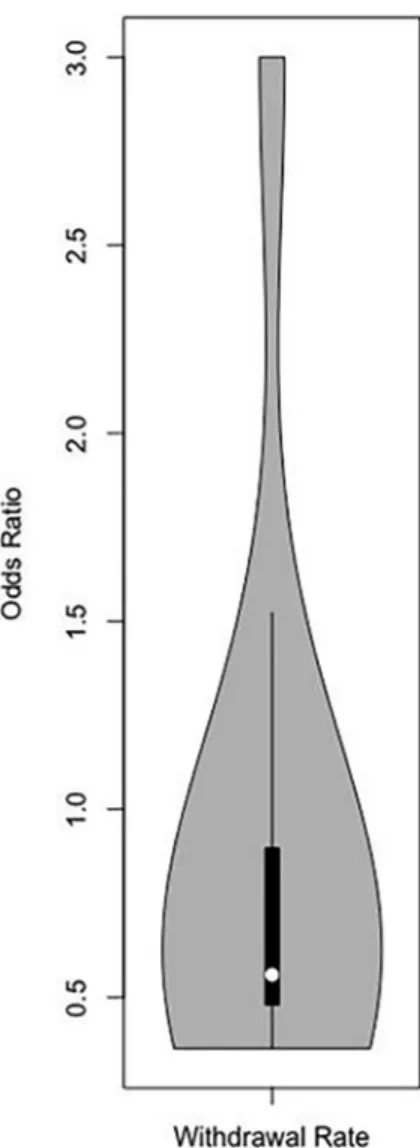
For the withdrawal rate, the heterogeneity of effect sizes
was substantial, with an I2 of 83.09, which indicated that the
findings varied considerably. Based on the random-effects model using the package “meta” (Schwarzer, 2007), the withdrawal rate for students in courses with open textbooks was lower than that of students in courses with commercial
textbooks; OR (odds ratio) = 0.71, k = 11, 95% CI [0.56,
0.90], p = .005 (see Table 5 for statistics by study). As with
learning efficacy, a violin plot was made to examine outliers. As can be seen in Figure 4, the distribution of effect sizes was quite negatively skewed, indicating likely outliers. However, the outliers were opposite the direction of the
FIGURE 3. Funnel plot for learning performance studies.
TABLE 4
Meta-Regression Results for Learning Efficacy
β SE T df p 95% CI Lower 95% CI Upper Intercept −0.03 0.1 −0.26 13.27 .80 −0.24 0.19 Prior 0.22 0.52 0.43 3.54 .69 −1.30 1.74 Instructor −0.02 0.15 −0.122 14.81 .91 −0.35 0.31 Measure −0.39 0.46 −0.83 3.34 .46 −1.78 1.01
Note: Prior = study either incorporated measure of prior knowledge and/or achievement into findings or conducted analyses to determine no significant
dif-ferences by condition in prior knowledge and/or achievement. Instructor = whether or not the same instructor taught the courses with open or commercial
textbooks. Measure = whether or not the measure for learning efficacy was identical for courses with open or commercial textbooks. SE = standard error; T
main effect. Therefore, the overall finding (that the with-drawal rate is lower for students in courses with open text-books compared with commercial texttext-books) was not affected by the outliers. For that reason and to not lose infor-mation, the outliers were kept in the analyses.
For withdrawal rate, over half of the studies did not report this information (it was obtained from the authors). Therefore, examining publication bias in a manner similar to what was done with learning efficacy (i.e., funnel plot and Egger’s test of the intercept) would be inappropriate given that half of the findings were not published.
Discussion
The purposes of these meta-analyses were to summarize the efficacy of open textbooks compared with commercial textbooks on learning performance and withdrawal rate. Based on the findings of 22 independent studies, there appeared to be no effect on learning performance in courses with open textbooks compared with courses with commer-cial textbooks. This effect did not appear to vary between studies based on having the same instructors for the courses with open and commercial textbooks. However, it should be noted that the absence of a significant effect from a modera-tor may be due to a lack of power rather than a true null effect (Hempel et al., 2013). The moderator analyses for incorporating prior student performance into the analyses or using identical instruments for measuring learning for open and commercial textbook conditions were inconclusive. The withdrawal rate from courses with open textbooks, based on
11 independent studies, was reliably lower than that for courses with commercial textbooks.
The null results for learning performance from open com-pared with commercial textbooks supports the notion that open textbooks save students money without a detrimental effect on learning. This quantitative summary of the findings converges with conclusions based on qualitative systematic reviews comparing learning in courses with open and com-mercial textbooks (Hilton, 2016, 2018). Furthermore, this meta-analysis builds on these previous reviews by compar-ing effect sizes based on study quality through moderator analyses. These moderator analyses indicated that control-ling for the confounder of whether or not the instructor was the same did not significantly vary the results. Therefore, although many studies on open textbooks have been justifi-ably critiqued for methodological quality (see Griggs & Jackson, 2017; Gurung, 2017, for critiques), this particular confounder did not appear to be skewing the findings on open textbook efficacy. However, this could be due to lack of power, and there was not sufficient power to trust the results for the other potential moderators examined (identi-cal learning measure and whether or not student prior achievement was controlled).
Based on the access hypothesis, students in courses with open textbooks should be academically outperforming their peers in courses with commercial textbooks. This is because every student would have access to open textbooks, but some students would not be able to afford access, or at least reliable access, to a commercial textbook. However, the findings from this meta-analysis do not provide support for
TABLE 5
Withdrawal Rate Statistics for Each Study and Model Statistics (Odds Ratio <1 Indicates Lower Withdrawal Rate With an Open Textbook Than a Commercial Textbook)
Study Name Withdrawal Published Odds Ratio 95% CI Lower Limit, Upper Limit p Sample Size O C T Chiorescu (2017) Yes 0.5 0.23, 1.08 .08 159 447 606 Clinton (2018) Yes 0.36 0.23, 0.57 <.001 232 435 667 Colvard et al. (2018)a No 0.82 0.73, 0.93 .002 10,141 11,681 21,822
Grewe and Davis (2017) No 0.56 0.25, 1.26 .16 95 95 190
Grissett and Huffman (2019) No 3.00 0.30, 30.35 .35 36 34 70
Hendricks et al. (2017) No 0.75 0.48, 1.17 .21 787 1,583 2,370
Hilton and Laman (2012) Yes 0.46 0.28, 0.76 .002 370 370 740
Hilton et al. (2013) Yes 1.23 1.09, 1.38 .001 2,043 4,168 6,211
Hilton et al. (2016) Yes 0.97 0.84, 1.12 .68 2,014 43,223 45,237
Jhangiani et al. (2018) No 0.44 0.10, 1.89 .27 139 105 244
Lawrence and Lester (2018) No 0.51 0.25, 1.03 .06 193 243 436
Random model (k = 11) 0.71 0.56, 0.90 .005 16,209 62,384 78,593
Note. Withdrawal published is whether or not the withdrawal rate was reported in the publication (Yes) or the authors provided the withdrawal rate on request
(No). Sample size O = open textbook, C = commercial textbook, and T = sum of students.
aWithdrawal rate was published as part of a composite measure including grades of D and F (DFW rate), but specific withdrawal rate analyses were not
this hypothesis. One reason could be that having free access to a textbook may only have a benefit for learning for a small number of students. For example, Colvard and colleagues (2018) found that students eligible for federal assistance grants based on low household income yielded greater learn-ing benefits from open textbooks relative to their peers with higher household incomes. It could be that if the information on student socioeconomic status (SES) were available, SES would be a significant moderator in which students with lower SES backgrounds would have benefits not seen with students of higher SES who can more easily afford and access commercial textbooks. Alternatively, it is possible that the open and commercial textbooks compared were of similar quality and perhaps access was not necessarily an issue, so the learning findings were similar. Another possible reason, based on conjecture, is that postsecondary instruc-tors may be aware that not all of their students have the com-mercial textbook and adjust their pedagogy accordingly. For example, instructors may be less likely to require reading or
assignments requiring the use of the textbook if they are con-cerned about the financial impact on some of their students. Finally, it could also be possible that the type of textbook simply has little influence on student learning. For example, one experiment comparing commercial textbooks from dif-ferent publishers found no differences between types in learning from reading them (Durwin & Sherman, 2008). This possibility is supported by findings from studies on open textbook efficacy (not eligible for this meta-analysis) in which all students had access to the commercial text-books, but there were either no differences or a small benefit in learning performance with open textbooks (Clinton, Legerski, & Rhodes, 2019; Robinson, Fischer, Wiley, & Hilton, 2014).
Although there was no benefit of open textbooks on the performance of students who completed courses, there was a significant reduction in the likelihood of students withdraw-ing from the course. The most common reason students state for course withdrawal is that they anticipate failing the course or receiving a low grade (Wheland, Butler, Qammar, Katz, & Harris, 2012). It is possible that having access to a textbook may help a student who is behind to cover missed material and not withdraw from the class. In this way, stu-dents who are struggling in a course may be less likely to withdraw if they can access an open textbook for free as opposed to paying hundreds of dollars for a commercial textbook to succeed in the course. However, there should be caution with interpreting withdrawal findings because some studies compared courses with different instructors (e.g., Hilton et al., 2016; Wiley, Williams, DeMarte, & Hilton, 2016), and there were not enough studies in each cell to con-duct moderator analyses.
Although not identified as an outlier in analyses, there was one study in which the withdrawal rate was signifi-cantly higher in a mathematics course with an open text-book than with a commercial texttext-book (Hilton et al., 2013). In the discussion of this finding, Hilton and colleagues (2013) describe how institutional policy changes for place-ment in mathematics courses coincided with the adoption of an open textbook for that course. This led to students with different levels of preparedness in mathematics in the pared courses, which creates a clear confounder for com-paring withdrawal rates.
Limitations and Future Directions
There are a number of limitations in these meta-analyses as well as in research on open textbooks more generally that should be acknowledged. One limitation of this learning efficacy meta-analysis was the focus on postsecondary stu-dents. As with postsecondary education, the adoption of open textbooks in K–12 education can yield significant cost savings, even with the time involved with modifying curri-cula and pedagogy (Wiley, Hilton, Ellington, & Hall, 2012).
Open-Source Textbook Efficacy
Furthermore, one study found that K–12 teachers rated open textbooks as better quality than commercial textbooks (Kimmons, 2015) and another found that K–12 teachers saw open textbooks as helpful when personalizing student learning (de los Arcos, Farrow, Pitt, Weller, & McAndrew, 2016). However, there is only one study that examined K–12 student learning that we know of that would have oth-erwise met the criteria to be included in this meta-analysis (Robinson et al., 2014). The increased focus on open text-books in postsecondary education may be because the costs of commercial materials are more obvious to postsecondary students who typically have direct expenses for course materials, whereas the cost to public K–12 students are indirectly supported through taxpayers. That said, with more OER being developed for and used in K–12 schools (Pitt, 2015), more inquiry in their efficacy is needed (see Blomgren & McPherson, 2018, for a review of K–12 OER research on a variety of issues).
The geographic scope of this meta-analysis was not rep-resentative of OER use. The reports in this meta-analysis were based on studies set in the United States and Canada, with one exception of a study based in Chile (Westermann Juárez & Venegas Muggli, 2017). The advocacy and use of OER, including open textbooks, is international (Bliss & Smith, 2017). Furthermore, teaching and learning practices with textbook use vary considerably by geographic region, partly due to textbook availability (Milligan, Tikly, Williams, Vianney, & Uworwabayeho, 2017). It is unclear if open text-books would ameliorate difficulties with textbook availabil-ity in regions in which access to the internet and electronic devices may be limited (Butcher, 2015). For these reasons, more inquiry into open textbook efficacy is needed outside the United States and Canada.
One limitation in the methodology of this meta-analysis is the use of a single screener for abstract screening. Logically, more than one screener would certainly reduce the likelihood a relevant citation was missed. Therefore, it is possible a relevant report was missed during abstract screen-ing due to the use of a sscreen-ingle screener. That said, an assess-ment of Abstrackr, the abstract screening software used in this meta-analysis, used only one screener (Gates, Johnson, & Hartling, 2018). Moreover, other possibly relevant reports were searched for in alternative methods (e.g., backward and forward citations searches) that may have compensated for the use of a single screener.
There were no significant moderators identified in the meta-regression analyses. However, there was substantial variability in the findings that would indicate the possible existence of sig-nificant moderators. It is possible that as more research is con-ducted in OER, there would be sufficient power to find that the proposed moderators related to study methodological quality explained some of this variability. In addition, future research could consider possible moderators, such as student back-ground and how the textbook is used by the instructor and stu-dents, to determine sources of variability in findings.
Another reason for the variability could be that the stud-ies themselves were quite different. Although all studstud-ies compared students enrolled with courses with open text-books with those with commercial texttext-books, there was a broad range of content areas and sample sizes. Moreover, grading criteria vary considerably among instructors and institutions. Regarding course withdrawals, each institution in this study had an initial drop period without a withdrawal on the transcript at the beginning of the term and a deadline at some point in the term to receive a W and not an F. However, the specific deadlines and policies varied.
The noted differences in the course withdrawal rates for open and commercial textbooks may have subsequently led to the characteristics of the students who completed the courses to be different. Although it is possible that students opted not to withdraw because they had access to an open textbook that allowed them to perceive a better chance of success in the course, in general, students who withdraw tend to have weaker academic backgrounds than those who persist in courses (McKinney, Novak, Hagedorn, & Luna-Torres, 2019). It is possible that this could lead to student differences in the courses that cannot be accounted for in the data available for these meta-analyses.
A potential issue is the medium (paper or screen) from which students read their course textbook. In Gurung’s (2017) second study, the performance between students in courses using open textbooks was lower than students in courses using commercial textbooks. However, the differ-ence was much smaller when only examining students who accessed their textbooks only electronically (thus reading from screens). Because open textbooks are free to access electronically but involve costs for hard copies, it may be that students may be more likely to read their open textbooks electronically than commercial textbooks (that involve costs in any medium; Clinton, 2018). This issue of reading medium used may be worth considering given that meta-analyses have been published indicating a small benefit in learning performance when reading from paper compared with read-ing from screens (Clinton, 2019c; Kong et al., 2018).
Conclusion
Open-source textbooks have been developed primarily in response to the rising costs of commercial materials. Concerns over quality and effects on learning have prompted numerous studies in this area. Based on the meta-analytic findings here, there are no meaningful differences in learn-ing efficacy between students uslearn-ing open textbooks and stu-dents using commercial textbooks. However, stustu-dents in courses with open textbooks appear to be less likely to with-draw. There are several limitations in research on open text-books that indicate future research should consider K–12 students, the needs of students outside of the United States and Canada, and the potential moderating factors of student characteristics.
Clinton and Khan
Appendix A
Search Terms Used for Each Database Scopus
“open source textbook*” “OER” + textbook*
ERIC
“open source textbook*” “OER” + textbook*
DOAJ
“open source textbook*” “OER” + textbook*
ProQuest
“open source textbook*” “OER” textbook*
PSYCinfo
“open source textbook*” “OER” textbook*
Appendix B
Coding of Studies
If the information was not available in the report, the cor-responding author was contacted with a request for the infor-mation. If the information was not or could not be obtained, then the code “N/A” for “not available” was used.
Descriptive Information
See Tables 1 and 2
1. Bibliographic information: Authors, year of publica-tion, and title
2. Dissemination type: Peer-reviewed journal article, master’s thesis or dissertation, conference presenta-tion or proceedings, or unpublished data
3. Year of publication: The year it was published or the necessary statistical information was provided 4. Sample size: Number of participants in each
condi-tion
5. Type of learning measure: Exam scores, course grade, researcher development measure, other 6. Content area: Social sciences, mathematics, hard
sciences, humanities, vocational/business education, multiple, other
7. Institution type: K–12, public 2-year postsecondary, private 2-year postsecondary, public 4-year postsec-ondary, private 4-year postsecondary
8. Country: The country in which the study took place
Study Quality
See Table B1
1. Were the participants in the open textbook condition comparable with the participants in the commercial textbook condition? If yes, then there was a pretest or prior academic measure that was found to be similar across conditions or statistically controlled for in the analyses.
2. Were the participants in each condition receiving similar instruction? Specifically, the following three questions were asked:
a. Were the courses in the open and commercial conditions the same?
b. Were the instructors in the open and commercial conditions the same?
c. Were the course modalities the same (online, face to face, blended)? Whenever possible, only courses of the same modality were included (e.g., Hendricks et al., 2017, involved one online course section with an open textbook, but all other courses were face to face so only courses of the same modality, face to face, were included).
3. To what extent was the intervention tested for effec-tiveness within important subgroups of participants? Specifically, were participant subgroups, such as variation in socioeconomic status or prior academic achievement examined?
4. Were the outcomes measured in a way that is consis-tent with the proposed effects of the intervention? If yes, the outcome measure (grades, exam scores, withdrawal rate) was relevant to the course(s) being compared in the study.
5. Did the description of the study give any other indi-cation of the strong plausibility of other intervention contaminants? If yes, there was evidence of potential contaminants such as substantial course redesign or changes in institutional policies.
6. Were the sample sizes adequate to provide suffi-ciently precise estimates of effect sizes? If yes, there were at least 50 participants per condition.
7. To what extent were sample sizes reported (or esti-mable) from statistical information presented? If yes, sample sizes for each condition were explicitly reported.
8. To what extent could the direction of effects be identified for important measured outcomes? Spe-cifically, were the direction of effects explicitly reported?
9. Were statistical tests adequately reported? If yes, the
inferential statistics (e.g., F statistic, t tests, p values)
10. Could estimates of effect sizes be computed using a standard formula (or algebraic equivalent)? If yes, the necessary information was reported. If not, the corresponding author was contacted for the informa-tion. If the information for necessary effect sizes
could not be obtained, the study could not be included in the meta-analysis.
11. Was the assessment measure for learning the same for stu-dents with open textbooks and those with commercial textbooks? If yes, the learning measure was identical.
TABLE B1
Study Quality Coding for Each Study
Authors (date) 1 2a 2b 2c 3 4 5 6 7 8 9 10 11
Allen et al. (2015) Yes Yes Yes No No Yes No Yes Yes Yes Yes For one
measure
Yes
Basu Mallick et al. (2018) No Yes No Yes No Yes No Yes Yes Yes Yes Yes No
Chiorescu (2017) No Yes Yes Yes No Yes No Yes Yes Yes Yes Yes No
Choi and Carpenter (2017) No Yes Yes Yes No Yes No Yes Yes Yes No Yes No
Clinton, 2018 No Yes Yes Yes No Yes No Yes Yes Yes Yes Yes No
Colvard et al. (2018) No Yes Yes Yes Yes Yes No Yes Yes Yes Yes Yes No
Engler and Shedlosky-Shoemaker (2019) Yes Yes Yes Yes No Yes No No Yes Yes Yes Yes Yes
Feldstein et al. (2012) No No No Yes No Yes No Yes Yes Yes Yes Yes No
Grewe and Davis (2017) Yes Yes No Yes No Yes No Yes Yes Yes Yes No No
Grissett and Huffman (2019) No Yes Yes Yes No Yes No Yes Yes Yes Yes Yes Yes
Gurung (2017), Study 1 Yes Yes No Not stated No Yes No Yes No Yes Yes No Yes
Gurung (2017), Study 2 Yes Yes No Not stated No Yes No Yes Yes Yes Yes Yes Yes
Hardin et al. (2019) No Yes No Yes No Yes No Yes Yes Yes Yes Yes Yes
Hendricks et al. (2017) No Yes Yes Yes No Yes No Yes Yes Yes Yes Yes No
Hilton and Laman (2012) No Yes No Yes No Yes Yes Yes Yes Yes No For withdrawal
rate
N/A
Hilton et al. (2013) No Yes Yes Yes No Yes Yes Yes Yes Yes No Yes No
Hilton et al. (2016) No Yes No Yes No Yes No Yes Yes Yes Yes Yes No
Jhangiani et al. (2018) Yes Yes No Yes No Yes No Yes Yes Yes Yes Yes Yes
Lawrence and Lester (2018) No Yes Yes Yes No Yes No Yes Yes Yes Yes Yes No
Medley-Rath (2018) Yes (for one
measure)
Yes Yes Yes No Yes No No Yes Yes Yes Yes Yes
Robinson (2015) No Yes No Yes No Yes No Yes Yes Yes Yes Yes No
Westermann Juárez and Venegas Muggli (2017)
No Yes Yes Yes No Yes No No Yes Yes Yes Yes No
Winitzky-Stephens and Pickavance (2017)
No No No Yes Yes Yes No Yes Yes Yes Yes No No
Note. 1 = pretest or prior achievement measure indicate participants had similar backgrounds/preparation; 2a = same courses; 2b = same instructors; 2c = same modalities; 3 = subgroup analyses; 4 = relevant outcome measures; 5 = intervention contaminants; 6 = more than 50 participants per condition; 7 = sample sizes explicitly reported; 8 = direction of effects explicitly reported; 9 = inferential statistics explicitly reported; 10 = effect sizes could be computed; 11 = same assessment measure.
Clinton and Khan
Appendix C
Data Dictionary
R Code for Analyses
install.packages(“robumeta”) install.packages(“devtools”) install.packages(“vioplot”) install.packages(“grid”) install.packages(“meta”) install.packages(“vioplot”) install.packages(“TOSTER”) library(robumeta) library(devtools) library(vioplot) library(grid) library(meta) library(vioplot) library(TOSTER)
data <- read.csv(“learning.csv”) #reading in the data
names(data) #reads off the variable names in your dataset is.numeric(data$Follow.Up) levels(data$Follow.Up) is.numeric(data$prior) summary(data$prior) is.numeric(data$instructor) summary(data$instructor) is.numeric(data$measure) levels(data$measure)
#RVE analyses for main effect testing of learning efficacy #Fisher Z., Tipton E. (2014). robumeta: An R-package for robust variance estimation in meta-analysis. Retrieved from arXiv preprint arXiv:1503.02220
learning <- robu(formula = effect.size ~ 1, data = data, stu-dynum = stustu-dynum, var.eff.size = var, rho = .8, model-weights = “CORR”, small = TRUE)
print(learning)
####POWER ANALYSIS
#####Harrer, M. & Ebert, D. D. (2018). Doing Meta-Analysis in R: A practical Guide. PROTECT Lab Friedrich-Alexander University Erlangen-Nuremberg. https://bookdown.org/ MathiasHarrer/Doing_Meta_Analysis_in_R/ power.analysis.random<-function(d,k,n1,n2,p,heterogen eity){ n1<-n1 n2<-n2 d<-d k<-k p<-p heterogeneity<-heterogeneity if(heterogeneity==“low”){ v.d<-((n1+n2)/(n1*n2))+((d*d)/(2*(n1+n2))) v.m<-v.d/k v.m<-1.33*v.m lambda<-(d/sqrt(v.m)) plevel<-1-(p/2) zval<-qnorm(p=plevel, 0,1) power<-1-(pnorm(zval-lambda))+(pnorm(-zval-lambda)) return(power) } if(heterogeneity==“moderate”){ v.d<-((n1+n2)/(n1*n2))+((d*d)/(2*(n1+n2)))
Learning Data Set
Variable Name Description
studynum Study number ES.ID Effect size ID number
Author Study author
Measure Effect size description effect.size Hedges’s g effect size var Variance of effect size
prior Prior knowledge measured (0 for no, 1 for yes) Instructor Instructor was the same for open textbook and
commercial textbook (0 for no, 1 for yes) measure Measure was the same for open textbook and
commercial textbook (0 for no, 1 for yes)
Withdrawal Data Set
Variable Name Description
studynum Study number
esnumber Effect size ID number
Author Study author
Ee Number of withdrawals for commercial textbook
Ne Total participants for commercial textbook Ec Number of withdrawals for open textbook Nc Total participants for open textbook
OR Odds ratio
log Log odds ratio
SE Standard error
Open-Source Textbook Efficacy v.m<-v.d/k v.m<-1.67*v.m lambda<-(d/sqrt(v.m)) plevel<-1-(p/2) zval<-qnorm(p=plevel, 0,1) power<-1-(pnorm(zval-lambda))+(pnorm(-zval-lambda)) return(power) } if(heterogeneity==“high”){ v.d<-((n1+n2)/(n1*n2))+((d*d)/(2*(n1+n2))) v.m<-v.d/k v.m<-2*v.m lambda<-(d/sqrt(v.m)) plevel<-1-(p/2) zval<-qnorm(p=plevel, 0,1) power<-1-(pnorm(zval-lambda))+(pnorm(-zval-lambda)) return(power) } } power.analysis.random(d=0.20,k=22,n1=1178,n2=3785,p=0.05, heterogeneity = “high”) power.analysis.random(d=0.20,k=22,n1=353,n2=423,p=0.05, heterogeneity = “high”)
####non equivalence test
###Lakens, D., Scheel, A. M., & Isager, P. M. (2018). Equivalence Testing for Psychological Research: A Tutorial. Advances in Methods and Practices in Psychological Science, 1(2), 259-269. https://doi.org/10.1177/251524591 8770963 TOSTmeta(ES = 0.0136, se = 0.0827, low_eqbound_d=-0.1, high_eqbound_d=0.1, alpha=0.05) print(TOSTmeta) TOSTmeta(ES = 0.0136, se = 0.0827, low_eqbound_d=-0.2, high_eqbound_d=0.2, alpha=0.05) ####META REGRESSION
data$prior_c <- data$prior - mean(data$prior)
data$instructor_c <- data$instructor - mean(data$instructor) data$measure_c <- data$measure - mean(data$measure) res_4<-robu(formula = effect.size ~ prior_c + instructor_c + measure_c, var.eff.size=var, studynum =
studynum, modelweights = “CORR”, rho =
0.8, small=TRUE, data=data)
print(res_4)
Wald_test(res_4, constraints = 2:3, vcov=“CR2”)
####OUTLIER learning efficacy, Daniel Adler and S. Thomas Kelly (2018). vioplot: violin plot. R package ver-sion 0.3.0 https://github.com/TomKellyGenetics/vioplot vioplot(data$effect.size, col=“grey”, names=“Learning Efficacy”)
title(ylab=“effect size”) ###Odds ratio
##package meta Schwarzer, G. (2007). Meta: An R package for meta-analysis. R News, 7(3), 40–45. https://cran.r-proj-ect.org/doc/Rnews/Rnews_2007-3.pdf
data <- read.csv(“withdrawal.csv”) #reading in the data WOR <- metabin(Ee, Ne, Ec, Nc, sm=“OR”, data = data) summary(WOR)
vioplot(data$OR, col=“grey”, names=“Withdrawal Rate”) title(ylab=“Odds Ratio”)
Acknowledgments
Michael Burd and Jennifer Duffy are thanked for their assistance on this project.
ORCID iD
Virginia Clinton https://orcid.org/0000-0002-4705-2217
References
*References marked with an asterisk were used in the meta-analysis. Adler, D., & Kelly, S. T. (2018). vioplot: violin plot. R pack-age (Version 0.3.0). Retrieved from https://github.com/ TomKellyGenetics/vioplot
*Allen, G., Guzman-Alvarez, A., Smith, A., Gamage, A., Molinaro, M., & Larsen, D. S. (2015). Evaluating the effectiveness of the open-access ChemWiki resource as a replacement for tra-ditional general chemistry textbooks. Chemistry Education Research and Practice, 16, 939–948. doi:10.1039/C5RP00084J *Basu Mallick, D., Grimaldi, P. J., Whittle, J., Waters, A. E., &
Baraniuk, R. G. (2018, October). Impact of OER textbook adop-tion on student academic outcomes. Paper presented at the 15th Annual Open Education Conference, Niagara Falls, NY. Behnke, Y. (2018). Textbook effects and efficacy. In E. Fuchs
& A. Bock (Eds.), The Palgrave handbook of textbook stud-ies (pp. 383–392). New York, NY: Palgrave Macmillan. doi:10.1057/978-1-137-53142-1_28
Belikov, O. M., & Bodily, R. (2016). Incentives and barriers to OER adoption: A qualitative analysis of faculty perceptions.
Open Praxis, 8, 235–246. doi:10.5944/openpraxis.8.3.308 Bliss, T. J., & Smith, M. (2017). A brief history of open educational
resources. In R. S. Jhangiani & R. Biswas-Diener (Eds.), Open: The philosophy and practices that are revolutionizing educa-tion and science (pp. 9–27). London, England: Ubiquity Press. doi:10.5334/bbc.b
Bloch, M. (2014). Meta-analysis and moderator analysis: Can the field develop further? Journal of the American Academy of