High Performance Residential
Retrofits for Affordable
Housing in the Hot Humid Climate
FSEC-PF-448-10
August, 2010
Original PublicationMcIlvaine, J., Sutherland, K., Schleith, K., and Chandra, S., “Exploring Cost-Effective, High Performance Residential Retrofits for Affordable Housing in the Hot Humid Climate”, Seventeenth Symposium on Improving Building Systems in Hot and Humid Climates,
August 24-26, 2010, in Austin, TX.
Authors
Janet McIlvaine Karen Sutherland
Kevin Schleith
Florida Solar Energy Center
Subrato Chandra
Pacific Northwest National Laboratory
Copyright ©2009 Florida Solar Energy Center/University of Central Florida All Rights Reserved.
Disclaimer
The Florida Solar Energy Center/University of Central Florida nor any agency thereof, nor any of their employees, makes any warranty, express or implied, or assumes any legal liability or responsibility for the accuracy, completeness, or usefulness of any information, apparatus, product, or process disclosed, or represents that its use would not infringe privately owned rights. Reference herein to any specific commercial product, process, or service by trade name,
trademark, manufacturer, or otherwise does not necessarily constitute or imply its endorsement, recommendation, or favoring by the Florida Solar Energy Center/University of Central Florida or any agency thereof. The views and opinions of authors expressed herein do not necessarily state or reflect those of the Florida Solar Energy Center/University of Central Florida or any agency thereof.
Exploring Cost-Effective, High Performance Residential Retrofits for Affordable Housing in the Hot Humid Climate
Janet McIlvaine Senior Research Analyst
Karen Sutherland Research Analyst
Kevin Schleith Project Specialist
Subrato Chandra Senior Buildings Engineer Florida Solar
Energy Center Cocoa, Florida, USA
Florida Solar Energy Center Cocoa, Florida, USA
Florida Solar Energy Center Cocoa, Florida, USA
Pacific Northwest National Laboratory Richland, Washington, USA
ABSTRACT
In 2009, a Department of Energy Building America team led by the Florida Solar Energy Center began working with partners to find cost-effective paths for improving the energy performance of existing homes in the hot humid climate. A test-in energy audit and energy use modeling of the partner’s proposed renovation package was performed for 41 affordable and middle income
foreclosed homes in Florida and Alabama. HERS1
Indices ranged from 92 to 184 with modeled energy savings ranging from 3% to 50% (average of 26%). Analyses and recommendations were discussed with partners to encourage more efficient retrofits, highlight health and safety issues, and gather feedback on incremental cost of high performance measures. Ten completed renovations have modeled energy savings ranging from 9% to 48% (average 31%.) This paper presents the project’s process including our findings thus far and highlights of the first home to meet the target HERS Index of 70. INTRODUCTION
Cost-effective energy efficiency measures for high performance new homes in the hot humid climate region have been well researched. A cost-benefit analysis on two high performance community home builders in the hot humid climate shows attractive economics for both builders (Fonorow et al. 2007). However, such research has been limited to new construction which has markedly reduced in recent years. Note the number of new housing permits was about 646,000 during the first quarter of 2010, down from 1,556,000 during the same quarter
1 HERS Index: A scoring system established by
the Residential Energy Services Network (RESNET) in which a home built to the specifications of the HERS Reference Home (based on the 2004 International Energy Conservation Code) scores a HERS Index of 100, while a net zero energy home scores a HERS Index of 0. Every point lower than 100 on the scale represents a 1% improvement. Conversely, every point higher than 100 represents 1% worse performance.
of 2007 (U.S. Department of Housing and Urban Development Office of Policy Development and Research, 2007 and 2010) While residential construction as a whole has greatly slowed throughout the nation, and as public desire to decrease energy demand grows (Leiserowitz et al. 2010; Leiserowitz et al. 2010), there is a broad and growing interest in determining cost-effective energy efficient measures for existing homes. Further evidence of this is seen in new private sector projects. Google has recently developed a software tool called Google PowerMeter to provide consumers with a tool to assess, manage, and decrease their energy demand
and save money (www.google.com/powermeter). A
heightened emphasis on energy efficient renovations is understandable, especially considering that existing homes are generally less energy efficient than new construction. This is generally due to progressive improvements in the energy codes, mandatory equipment and appliance efficiency, and the effects of age on a building and its equipment. Also, the number of existing homes is many times that of new construction; the number of new housing permits of a little over 6 million while the number of existing residential units is more than 130 million (U.S. Department of Housing and Urban Development Office of Policy Development and Research, 2010).
Affordable homes are of particular interest in the area of energy retrofit because a) per square foot, these homes have a higher consumption and higher potential savings than other homes, and b)
homeowners in this segment of the population are more financially challenged. An average retrofit for an affordable single family home would cost approximately half of the household’s annual non-core budget (Choi Granade, et al, 2009).
Research on packages of energy efficient retrofit measures is emerging. The National Renewable Energy Laboratory (NREL) recently published a related study for a different climate. The report provides an economic analysis of potential energy efficiency measures appropriate for climate of Kauai Island. (Busche, et al, 2010).
Compared to the new construction sector of the home building industry, the residential remodeling sector may be more difficult to influence. Recent research on residential remodeling highlights the industry as highly segmented and volatile (Will, 2008). It is a fragmented industry with many small volume contractors with high susceptibility to failure (Will and Baker, 2007). Extracting cost data from this fragmented industry is more challenging than documenting new construction costs. Further, retrofitting existing buildings has unique challenges that new construction does not.
The Florida Solar Energy Center leads the U. S. Department of Energy’s (DOE) Building America Industrialized Housing Partnership (BAIHP). In 2009, the BAIHP team of researchers began
conducting research to gain a better understanding of the technical challenges and costs associated with achieving deep energy retrofits in existing, affordable and middle income homes in the hot humid climate. We are currently working with local government and non-profit partners who are managing renovation programs. These partners often have historical cost estimates, but not necessarily actual costs for individual improvements, to guide development of a renovation scope of work within the allowable budget for a given home.
Though the BAIHP study is ongoing, the primary objectives of this paper are to:
• describe the partnerships we formed and the data
collection process,
• present our preliminary findings for the 41 homes that have been audited pre-retrofit,
• identify efficiency expectations of partners’ renovation plans,
• provide a summary of projected cost-effective
energy efficiency measures, and
• showcase two case study homes, including the
first home to meet the target HERS index of 70. A HERS Index of 70 is one of the criteria for achieving the U.S. Department of Energy’s Builders Challenge and a level of performance that has been widely adopted by hundreds of new home builders throughout the U.S. In this field investigation, researchers are also exploring the feasibility of retrofitting the other quality criteria of the Builders Challenge program, such as outside air ventilation and moisture control strategies. Another definition of “deep energy retrofit” has arisen since researchers began this work: 30-50% improvement in efficiency over the test-in condition of the home. Both the HERS Index and projected percentage of
improvement are reported for the retrofits presented here.
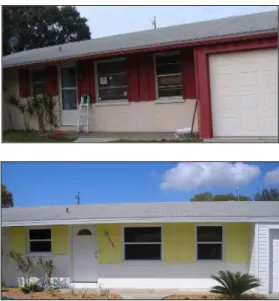
Throughout this paper the terms “as found,” “test-in,” and “pre-retrofit” refer to the condition of study homes prior to renovation. “Test-out” and “post-retrofit” refer to the home after renovation. Pre- and post-retrofit photos of an existing home in Sarasota, Florida in this study are in Figure 1. METHOD
We began our study by developing partnerships with entities involved in retrofit programs; most of which are Florida local governments who have been funded by the U.S. Department of Housing and Urban Development through Neighborhood Stabilization Program (NSP) grants. NSP funds are used to purchase and renovate foreclosed homes to be resold in the affordable housing price range which is determined individually for each locality. To accomplish this work, some of the Florida local government NSP recipients partner with non-profit housing providers such as affiliates of Habitat for Humanity. BAIHP also partnered directly with Habitat affiliates in Florida and Alabama. In all partnerships, the scopes of renovation work
encompass general repairs and renovations needed to bring homes up to market standards which often include components, equipment, and appliances that impact energy efficiency. The investment in
improvements must be balanced against the limits on resale value associated with the program and organizational guidelines. We have taken into consideration that if the useful life of a replaceable component is long, it may be undesirable to replace it. Because the cost of a high performance retrofit may not be within their budget for a given home, it is understood that not all homes will be good candidates for achieving our deep retrofit goals. Our research is designed to determine if and under what
circumstances deep energy retrofits (HERS Index of 70 or 30-50% improvement) can be cost-effectively achieved.
To help potential partners understand the specifications needed to reach deep retrofit performance levels, we used an hourly energy use simulation program, Energy Gauge® USA, to calculate the base case or “as found” HERS Indices for four hypothetical homes of different ages and construction types representative of typical existing affordable homes in Florida. Energy Gauge® USA allows simple calculation and rating of energy use for residential buildings in the United States, using hourly energy simulations to estimate home energy use using the well-verified DOE-2.aE engine (Fairey,
2002). A recent study compared the Energy Gauge® USA to BEopt, another widely used hourly energy simulation software, and found the two agree fairly well on the impact of energy efficiency
improvements (Parker, 2009). We drew upon prior energy audits, historic code requirements, and input from real estate professionals to develop the “as found” characteristics for each hypothetical home.
Figure 1 Renovated study home in Sarasota, Florida pre-retrofit (top) and post-retrofit (bottom)
Using prior experience achieving the performance goal in new construction homes, we developed example specifications needed to reach the goal in the hypothetical existing homes. The analysis included cost-effectiveness calculations based on estimated costs of higher efficiency specifications compared to minimum efficiency specifications that would be necessary to bring the house up to market standards. In presenting this analysis to potential partners, we proposed developing similar analysis for homes they planned to renovate and acquiring true cost data to determine feasibility of cost-effectively reaching our deep retrofit goals.
Homes discussed in this paper come from eight local government and non-profit partners – Sarasota County and the City of Sarasota, FL (including the Florida House Foundation, Community Housing Trust of Sarasota, and Newtown Community
Development); Volusia County, FL; Brevard County, FL; the City of Palm Bay, FL; Orange County, FL; and Habitat for Humanity affiliates in Leesburg, FL, and in Mobile and Birmingham, AL. We have received commitments from each to attempt cost-effective renovations in 10 or more homes to the target HERS Index of 70 or below as part of the
overall scope of work, with an agreement to share cost data with us. As partners acquire homes, full energy audits are performed on the homes in their pre-retrofit state. The test-in energy audit consists of an onsite evaluation to document the condition of the home with pictures, observations, measurements, and air tightness testing of both the whole house and the duct system. Our current data set consists of 41 affordable and middle income foreclosed homes, of which 10 renovations have been completed.
Data collected at the home site were entered into Energy Gauge® USA software to calculate a HERS Index and an estimated annual energy use. Two additional configurations for each home were then created – one based on the energy related aspects of the partner’s proposed scope of work and another incorporating additional improvements to achieve a HERS Index of 70. Using BAIHP experience reaching the target performance level in new homes, researchers conducted a parametric cost-benefit analysis for a set of individual improvements for each home. The improvements already planned by the partner were accepted as part of the base case for the deep retrofit package since most of the energy related improvements were being done for other reasons (e.g. windows replaced for functionality). The cost benefit calculations included simple payback (incremental cost divided by predicted annual energy cost savings) for each individual measure and the whole
improvement package. Researchers also calculated monthly cash flow for the whole package, a metric commonly used in the Building America program. The calculation compares predicted average monthly energy cost savings to the increase in monthly mortgage payment if the total incremental cost of the package was financed for 30 years at a fixed interest rate of 7%. If the monthly savings are greater than the monthly cost, this creates a positive monthly cash flow and is considered cost-effective for the purposes of this analysis.
Costs used for the analyses fell into two broad categories: “first costs” defined as the costs associated with any potentially energy efficient measure that was part of the partner’s scope of work, such as replacing windows, and “incremental costs” defined as costs that go beyond the partner’s scope of work for a given measure. For example, the
incremental cost would be the additional cost to upgrade from a standard window replacement (as needed for functionality) to a high performance window with a lower U-value and solar heat gain coefficient (SHGC). In the event that window replacement is not included in the partner’s package, then the incremental cost for the high performance
windows would be the full cost of the high performance window replacement, which significantly changes the economic implications.
Upon completion of the initial analysis, partners are informed of predicted energy efficiency gains or losses associated with all relevant measures within their scope of work. Next we recommend additional measures for a high performance deep retrofit that provide further energy savings that outweigh costs. After the renovation, researchers conduct the test-out audit of the completed house. Then we revise the analysis to reflect the actual post-retrofit condition and, where possible, replace estimated costs with actual data.
ASSUMPTIONS AND LIMITATIONS
The national discussion of deep energy retrofits often includes an element related to measured improvement, comparing pre-retrofit utility bill data to the post-retrofit bills with a target of achieving 30-50% savings. Because the homes in this field investigation are foreclosed and unoccupied, the opportunity for this type of measurement is lost. The benefit of working with NSP recipient partners is that they are already engaged in major renovation activities and have a financing mechanism in place to cover the incremental cost of efficiency
improvements.
Obtaining reliable cost data has been among the most challenging aspects of our study. Determining labor costs is particularly difficult due to a lack of contractor response to quote requests. This is compounded by regional fluctuations in labor rates. Our partners generally have data from prior retrofit work as a basis for estimating the component first cost for renovating the homes; however, their records do not generally include efficiency data (such as SEER ratings) so developing a comparison of the cost associated with increases in efficiency specifications can not be accomplished with their historical data. Some of the partners provide us with their estimated costs, but these often include an allowance for unforeseen difficulties and do not break out specific elements of general categories of work. For example, replacement of a mechanical system would be estimated as a whole without defining whether or not it includes a duct system replacement. This would likely be decided later by a sub-contractor based on the condition of the ducts. Even when the sub-contractor submits an invoice, it is unlikely to show this level of detail. Other partners have been unwilling to provide us with their cost estimates due to the sensitive nature of the bid process. In the face of these challenges, researchers
calculated incremental costs based on past research, a limited number of contractor quotes, RS Means2 data, and materials costs available in stores and on the internet. These incremental cost estimates were used to calculate cost-effectiveness of improvements toward the goal HERS Index of a 70 or below. Acquiring cost data is a major need in the area of evaluating cost-effectiveness of deep energy retrofits.
Another stumbling block of the study has been that partners are often slow to acquire properties as they are not able to contract to purchase as quickly as their competition. There have also been long delays in starting renovations as they work to get their programs in place. For many properties, the test-out audit and analysis will not be complete for a few more months.
Many of the properties have been severely neglected and some vandalized. Because of these conditions, certain assumptions have been made about the as-found characteristics of the homes. Some have a potentially significant impact on the calculations of test-in whole house efficiency.
Whole house air tightness (ACH50) is calculated as air changes per hour measured at a test pressure of negative 50 pascals with respect to the outside. For homes that were missing either large sections of ceilings or walls, it was not possible to conduct the air infiltration test. In a few homes, rodent
infestation prevented testing. The defaults values for infiltration within Energy Gauge® USA were deemed too conservative for these existing homes in very poor condition. After completing test-in audits for approximately twenty homes, researchers used average or worst case infiltration values at the auditor’s discretion.
Normalized duct leakage to the outside (qn,out) is determined for each home, which is measurement of duct leakage to non-conditioned space at test pressure of negative 25 pascals with respect to outside divided by conditioned area. A normalized duct leakage to the outside of 0.06 indicates leakage of 6 cubic feet of air per minute (cfm) per 100 square feet of conditioned space from the duct system including the air handler. This measure requires depressurizing the home to achieve a zero pressure difference between the duct system and the house, thereby eliminating flow between the two. When the aforementioned problems with the home’s envelope prevented depressurizing the whole house,
2
RSMeans is a published database widely used by contractors for estimating construction costs.
normalized total duct leakage (qn,total) was used in simulations instead of normalized leakage to the outside. When the mechanical system duct work was too leaky to test or, in one case, where the air conditioning coils were coated with paint ingested into the system during spray painting, auditors were unable to test. Researchers again used average or worst case values for duct leakage in the simulations in the same manner described above for the air infiltration.
An assumption for mechanical system efficiency has to be made when manufacturer name plates or the units themselves are missing, not an uncommon problem for abandoned properties. In such cases, the minimum efficiency standard in force at the time of construction was used for modeling. For homes older than 15 years, replacement was assumed to have happened every 15 years with the minimum efficiency standard for that year assumed. To err on the side of underestimating savings and maintain a consistent method of assumption, the efficiency of existing mechanical systems was not de-rated to account for effects of age.
One home in the study was audited only after the retrofit. Working with the partner, we developed a pre-retrofit configuration for comparison.
A majority of the homes use electricity exclusively; however, a few were equipped with natural gas furnaces and/or gas or propane water heaters, especially in the Alabama homes. A scope of work calling for a change in appliance fuel type, e.g. replacing a propane water heater with an electric water heater, can have significant impact on the annual energy cost comparison between pre-retrofit and post-retrofit, because of differences in minimum efficiency as well as fuel costs. The HERS Index comparison is also affected by changes in fuel. Similarly, changes in the conditioned area occurred in several homes where enclosed and conditioned garages and porches were converted back to unconditioned space. This too skewed the level of equipment and envelope improvement by a major reduction in conditioned volume.
PRE-RETROFIT FINDINGS
Test-in audits have been performed on 41 affordable and middle income homes in Florida and Alabama to document energy related conditions prior to renovation. The general characteristics of these homes are:
• single family; detached and two half duplex units,
• concrete masonry unit or frame construction,
• primarily single story,
• built between 1954 and 2004, and
• living area between 780 sq. ft. and 2,408 sq. ft. Typical envelope related findings include single pane casement windows with poor closure, low levels of attic insulation, missing plumbing access covers and other drywall holes causing high levels of air infiltration. The homes typically have old or missing appliances and few, if any, compact fluorescent light bulbs (CFLs). Split-system forced air mechanical systems are the norm. Heat pump and electric resistance configurations are both common in the central Florida homes with gas heating dominating in north Florida and Alabama. Mechanical systems in homes built prior to the 1990’s generally have poor air flow across the conditioning elements, building cavities used as return plenums which are poorly connected to the air handler, undersized return plenums, small air handler closets in the conditioned space but open to the attic, and leaky ducts typically located in the attic. In homes with crawl spaces, primarily in north Florida and Alabama, ducts were typically installed below the frame floor. Homes built after the 1990’s generally have tighter ducts sealed with mastic at the major joints, and more
appropriately sized and ducted return plenums. Air handlers in these newer homes are typically set in the garage. All homes had a single central return, rather than a set of return ducts from each room.
The test-in audits produced HERS Indices ranging from 92 to 184, with a mean of 130. A summary of the test-in HERS Indices broken down by decade is provided in Table 1.
Table 1. Test-In HERS Index by Decade
Decade Built Mean HERS Index n
1950's 158 1 1960's 157 6 1970's 137 10 1980's 129 12 1990's 116 8 2000+ 101 4
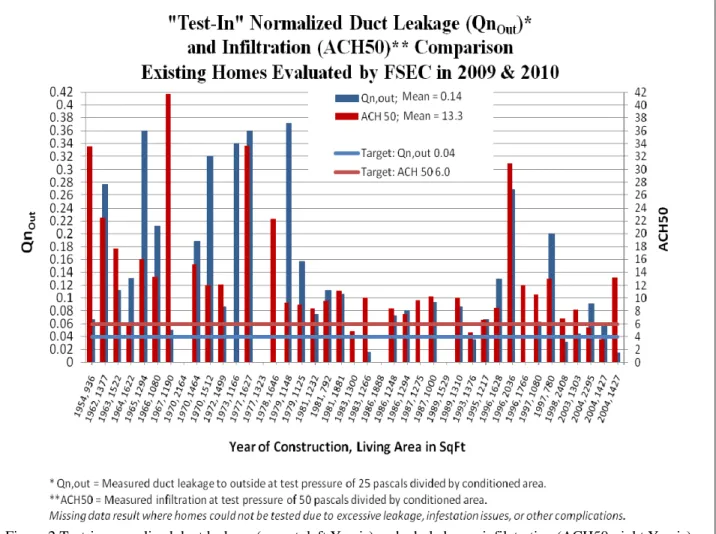
Test results (Table 2) for duct leakage (qn,out) and air infiltration (ACH50) range broadly among our study homes and are significantly higher for older homes, especially those built prior to 1980. This may be a result of Florida energy code improvements.
Figure 2 displays each of the whole house air tightness (ACH50, red) and normalized duct leakage (qn,out, blue) for all study homes. The year of construction is noted on the X axis along with the conditioned area of the home. Missing bars indicate homes where testing was not possible. The as-found duct leakage and infiltration conditions of the homes in the study far exceed the post-retrofit targets (red and blue lines).
Table 2. Test-In Results
Measure Mean Min Max n
Normalized duct leakage to the outside (qn,out)
0.14 0.02 0.37 33
Air changes per hour at 50 pascals (ACH50)
13.3 3.6 41.8 36
The post-retrofit target for normalized duct leakage to outside (qn,out) is 0.04 or less. This translates into 4 cfm of leakage to outside per 100 square feet of conditioned space at the test pressure of negative 25 pascals. This is consistent with DOE’s
Builders Challenge program. The whole house air infiltration goal is to eliminate major air flow paths in the dry wall (e.g. holes and missing plumbing access covers) and achieve estimated whole house natural infiltration of 0.35 air changes per hour, consistent with the Builders Challenge Quality Criteria. This level of envelope leakage is roughly equivalent to an ACH50 of 6.0. Deep retrofit recommendations also include a passive ventilation system that draws a small quantity of outside air (approximately 25 cfm) into the return plenum when the air handler fan is operating
PARTNERS’ PROPOSED SCOPES OF WORK AND BAIHP RECOMMENDATIONS
Simulation models for the energy related aspect of the partner’s proposed scope of work have been created for 36 of the 41 homes in the study. Five homes require additional information to complete analysis. To reiterate, the total scope of work for each house is focused on renovations needed to bring the home up to market standards. Some partners were making more effort than others to choose higher.
Figure 2 Test-in normalized duct leakage (qn,out, left Y axis) and whole house infilatration (ACH50, right Y axis) for 41 existing homes in Florida and Alabama.
efficiency options for replacement equipment, components, and materials. Among the most interesting findings of the preliminary analyses have been the predicted savings from these scopes of work, prior to partners considering our
recommendations. Annual energy savings for the partner’s package in the 36 analyzed homes range between 3% and 50% of predicted annual energy use, with a mean savings of 27%. Even some relatively newer homes achieved higher than expected
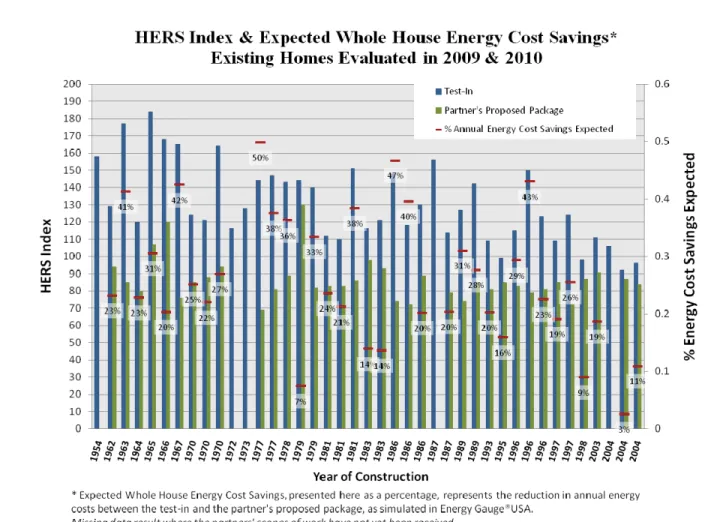
improvements in energy efficiency. It is noteworthy that regardless of the age of the home, most of the partners’ scopes of work produced a HERS Index well below 100, equivalent to the HERS Reference home which meets the 2004 International Energy Efficiency Code. In several homes, the partner’s proposed scope of work produce a HERS Index not far from the goal of 70. Among these motivated partners, many have been eager to incorporate additional cost-effective improvements. Figure 3
presents the HERS Indices for both the test-in audit (blue) and the partner’s proposed package (green) for each home as well as the expected percentage of whole house energy use savings (red). Analyses of the post-retrofit findings are discussed later in this paper.
For each home, researchers used the test-in
simulation model to produce incremental analyses for each energy related improvement in the partner’s scope of work to assess efficiency gains and losses. These simulation results coupled with our partners’ projected cost (when able to collect these data), provide insight into which items are most cost-effective. A deep retrofit model was then created integrating high performance, cost-effective, energy efficient measures based on FSEC research on new home construction in the hot humid climate. Incremental analyses were again run comparing the partner’s proposed package to each of the high
performance measures. In this analysis to develop recommendations, the partner’s proposed scope of work was taken as a given based on need to bring the house up to market standards.
As mentioned in the limitations described above, one complication to our parametric analysis has to do with altered living space. Some pre-retrofit homes had garages and/or porches converted into living space. The simulation model for the parametric analysis of the partner’s individual improvements retained the conditioned area of the pre-retrofit home. The conversion of these conditioned spaces back to unconditioned was run as a single change. However, for some of the parametric runs, the anticipated post-retrofit envelope configuration was used. For example, to model the change in annual energy use from replacing a 10 SEER straight cool air
conditioner with electric resistance heating with a 16 SEER heat pump, the original pre-retrofit living area was used. However, to model the change from replacing windows, it was necessary to adjust the envelope area to reflect the anticipated post-retrofit envelope configuration.
As described, a limitation of our study is not just the difficulty in collecting cost data from our retrofit partners but also, among those partners who have been cooperating, cost data and detail vary widely. Local product availably or labor costs may explain some of this variation. Additionally, the variety in as-found conditions affects the incremental cost for many measures. For example, the cost for adding ceiling insulation to achieve R-30 is related to the insulation level originally found in the home.
Rather than provide payback detail for specific incremental runs in this paper, we have compiled a summary of the measures most commonly
incorporated into our recommended deep retrofits which, taken together, were part of a cost-effective package. Improvements that are cost effective, based on our current cost data include adding CFLs to any number of outlets, installing ENERGY STAR ceiling fans and refrigerators, bringing ceiling insulation levels up to R-30 or R-38, reducing envelope infiltration with air sealing measures, adding spectrally selective window tint to single pane windows, sealing ducts or replacing ducts when exceptionally leaky, replacing the HVAC with a 15 SEER or 16 SEER heat pump when the existing is a 10 SEER or less, installing a programmable thermostat, upgrading from a standard efficiency electric water heater to a heat pump water heater, and using white or light shades if repainting the exterior or replacing an asphalt shingle roof. There have been
a limited number of homes in our study with gas heating and water heating. In these cases, we have recommended direct vent or tankless gas water heaters and high-efficiency gas furnaces. POST-RETROFIT FINDINGS
Renovations for ten study homes have been completed, re-audited, and results analyzed. Modeled savings for actual post-retrofit configurations ranged from 9% to 48%, with an average of 31%. The results closely mirror
projections, with one exception; a home projected to have a savings of 16% has post-retrofit modeled savings of 33%. Energy efficiency measures beyond the original scope were incorporated into this retrofit, the first of our study to score a HERS index of 70 or less. The post-retrofit HERS index was 67. Details of this renovation are discussed later.
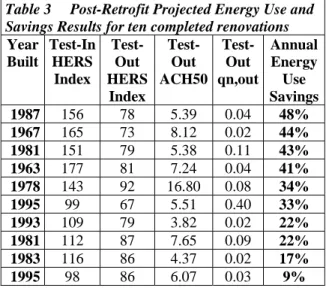
Table 3 presents the pre- and post-retrofit HERS Indices, duct leakage, infiltration, and modeled savings for the post-retrofit homes. Data are ranked by modeled savings, highest to lowest. The largest reductions are realized where the test-in HERS Indices are the poorest. These are typically the older homes.
Table 3 Post-Retrofit Projected Energy Use and Savings Results for ten completed renovations
Year Built Test-In HERS Index Test-Out HERS Index Test-Out ACH50 Test-Out qn,out Annual Energy Use Savings 1987 156 78 5.39 0.04 48% 1967 165 73 8.12 0.02 44% 1981 151 79 5.38 0.11 43% 1963 177 81 7.24 0.04 41% 1978 143 92 16.80 0.08 34% 1995 99 67 5.51 0.40 33% 1993 109 79 3.82 0.02 22% 1981 112 87 7.65 0.09 22% 1983 116 86 4.37 0.02 17% 1995 98 86 6.07 0.03 9%
Poorly sealed return plenums, including building cavities used as ducts (platform returns), are
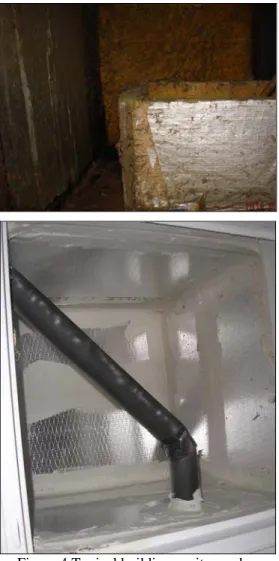
commonly found in both pre-retrofit and post-retrofit energy audits. Unsealed or poorly sealed duct systems degrade mechanical system performance. The mechanical contractors we have worked with have been eager to revisit and seal these returns when we have identified the issue. Figure 4 shows a typical platform return (pre-retrofit) and the improved return plenum which has been lined with duct board. Note that the duct air barrier (foil side of duct board) is installed to the inside of the return
plenum where it is easily accessed, and the heavy use of mastic on all penetrations, joints, and corners to minimize leakage. The next set of photos in Figure 5 depicts a typical attic before and after insulation is added.
It is noteworthy that in a couple of cases renovation measures actually reduced energy efficiency, specifically when the duct leakage increased significantly. The new ducts installed in one case were not sealed appropriately at joints. In the second case, the mechanical contractor had inadvertently disconnected a supply duct in the process of installing the new mechanical system. These errors highlight the importance of post-retrofit testing.
As discussed previously, gathering the actual costs after the renovation is complete has been challenging. This information is critical to
Figure 4 Typical building cavity used as a central return plenum (top) converted to a ducted return sealed with masti (bottom).
conducting cost-benefit analysis and researchers are pursuing it with all of the involved partners. Even when cost data have been provided, they need to be teased apart to be applied in a meaningful way. Air sealing measures, for example, are unlikely to be identified by contractors as an independent measure with associated costs. In only two cases have we collected complete retrofit cost data. Each of the two homes had unique challenges which warrant further discussion. Highlights from these two homes are discussed in the next section.
In May of 2010, based in part on the field experience under this partnership, one encouraging result of this study has been the refinement of one partner’s standard specifications for the retrofit activity under the second round of their Neighborhood Stabilization Program (NSP2) funding. The Sarasota Office of Housing and Community Development adopted energy
conservation standards for their home rehabilitation projects under their NSP2 funding. Among the replacement standards are a 16 SEER air conditioner (as space allows), light or white colored roof and exterior, R-38 attic insulation, ENERGY STAR windows and appliances, 80% ENERGY STAR LED or CLFs or fluorescent light bulbs, and
programmable thermostats. Further, they are
Figure 5 Typical attic insulation pre-retrofit (top) and post-pre-retrofit (bottom)
requiring duct leakage tests to be performed on all homes with a goal of 6 cfm or less leakage per 100 square feet of conditioned space at a test pressure of 25 pascals with respect to outside.
Researchers have identified several needs for reaching high performance levels for homes similar to those in the study. Where air handlers are located in existing interior closets, they are not usually of sufficient size to house a high efficiency replacement which typically has a larger foot print. The alternative is to locate a new, high efficiency air handler in the garage or other unconditioned space which
necessitates new duct work, often in attics with low pitch (typically 3:12). Some partners have opted not to include programmable thermostats in renovations because of concerns over programming complexity. Typical insulation contractors may not be sufficiently aware of the risks involved with recessed lighting fixtures coming in contact with insulation. Likewise, there seems to be little attention to disruption of attic ventilation at the eaves. The low roof pitch of typical homes in the study makes accessing the eave area difficult, unless the soffits are removed. In climates where higher pitches ease access, it may be easier to make attic ventilation provisions, such as installing insulation dams and ventilation baffles.
One area of particular concern was evident in several homes that had atmospheric combustion gas furnaces that needed to be replaced. Whereas the obvious choice in mixed and cold climates would be a high efficiency, closed combustion gas furnace, the relatively small heating demand does not warrant investment in this significantly more expensive option. Indeed, the energy savings would not justify the cost. However, contractors who replace these worn out units with new atmospheric combustion units as part of an overall renovation may be exposing themselves and occupants to combustion safety risks not present in the pre-retrofit house. Whereas the pre-retrofit house may be drafty enough to have adequate make up air drawn through the envelope during depressurization events, such as exhaust fan operation, the post-retrofit home may have significantly lower infiltration. This may create conditions under which a depressurization event may overcome the natural stack effect of the furnace exhaust flue, leading to back drafting of combustion exhaust. In most cases, provision for combustion air does not take into account these depressurization events. Researches in this study will conduct combustion safety testing to ensure that the new furnaces will not be exposed to such risk; however, contractors do not typically retain professionals capable of conducting this testing. Researchers also
made recommendations to install carbon monoxide detectors and to select units with safety mechanisms such as those that prevent electronic ignition when draft can not be established in the flue.
CASE STUDIES
The first of the case study homes exceeded the energy renovation goal by achieving HERS index of 67. Built in 1995, this single story, single family detached home is 1,217 square feet, with three bedrooms and two bathrooms. The structural system is concrete block with wood frame trusses. The home is fueled exclusively with electricity for which the current local rate is $0.13/kWh. Scoring a HERS Index of 99 at the test-in audit, this home was in relatively good condition compared to most of the homes in the study. Thus, this partner was able to allocate funds to energy improvements that may have otherwise been devoted to general repair. The mechanical system had already been upgraded to a 15 SEER heat pump and the windows were tinted. Both characteristics atypical for the foreclosed homes we have seen and helped to produce the lowest HERS index of any single family detached home in our study to date. Our partner facilitated our direct communications with their contractor, an important tenet of Building America’s approach to high performance homes. This made for smoother collaboration for developing an agreed upon package of improvements to achieve our mutual goals.
Having had a fairly efficient envelope and other good characteristics at test-in, this home posed a challenge for us to find the best measures for energy use reduction. For instance, it was not cost-effective to replace the windows or mechanical system even though these measures would have made the home more energy efficient. However, our blower door test revealed that a fluorescent light fixture in the master bath room was installed in a furred down cavity that was open to the attic. Testing also uncovered a missing plumbing access cover in a closet.
The package of improvements to this home was as follows. Given that a roof replacement was identified in the partner’s scope of work, we recommended a white shingle instead of medium or dark color. This generates a small annual savings, but there is no incremental cost increase associated with it. Additional low-cost recommendations for this renovation included extensive use of compact fluorescent lighting, increasing the amount of attic insulation to achieve a total of R-38 instead of R-30, sealing obvious holes in the return plenum, installing a programmable thermostat, and sealing several
major air infiltration paths. Repair of the two leakage paths mentioned brought the ACH50 down from 6.7 to 5.5. The test-in normalized duct leakage to outside (qn,out) was 0.067, slightly higher than the 0.04 called for in the Builders Challenge Quality Criteria (BCQC). The test-out duct leakage met the goal with qn,out of 0.03.
ENERGY STAR appliances were installed instead of standard efficiency models. The largest and most costly upgrade involved the water heater. The home was originally equipped with a solar water heater; however, the equipment was damaged and non-functional. Abundant shade from an adjacent lot to the south limited the viability of solar water heating for this home and meant repair was not a
good option. Instead, a new Rheem EcoSenseheat
pump water heater was installed and provided both a significant reduction in the HERS Index (9 points) and annual energy savings of $176.
The final item addressed was the installation of a passive outside air ventilation system, installed as a ducted, filtered air flow path from an air intake grill to the return side of air handler with a manual damper. This indoor air quality detail is consistent with the BCQC.
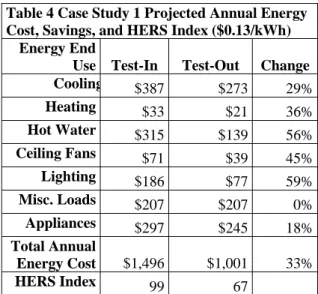
The post-retrofit home had projected annual energy costs of $1,001, a savings of $495 (33%) over the test-in simulation. The total actual incremental cost for the energy efficient renovation measures were $3,327, generating a simple payback of eight years and a monthly net cash flow of $16. The total includes the full cost of the heat pump water heater ($1,700) because the existing electric unit (backup for the solar system) could have met the water heating needs of the home. The partner made the replacement for the sole purpose of improving whole house efficiency. A summary of the annual energy savings by component is provided in Table 4.
The second home is a more typical representation of what we are finding in the pre-retrofit homes. The single family detached, single story home was built in 1967. It has 1,190 square feet of conditioned space with two bedrooms and two bathrooms. The structural system is concrete block with wood frame trusses. This home too is fueled exclusively with electricity for which the current local rate is $0.13/kWh. The test-in audit revealed a very inefficient home with a HERS Index of 165.
The existing mechanical system was a 8.7 SEER split system heat pump. The air handler was located in a closet within the conditioned space; however, it
Table 4 Case Study 1 Projected Annual Energy Cost, Savings, and HERS Index ($0.13/kWh)
Energy End
Use Test-In Test-Out Change Cooling $387 $273 29% Heating $33 $21 36% Hot Water $315 $139 56% Ceiling Fans $71 $39 45% Lighting $186 $77 59% Misc. Loads $207 $207 0% Appliances $297 $245 18% Total Annual Energy Cost $1,496 $1,001 33% HERS Index 99 67
was open to the attic at the ceiling with a platform return (described above). This connection to the attic combined with numerous holes in the drywall and poorly closing single pane awning windows contributed to the extremely high air infiltration (ACH50 = 41.8). In addition to these items, the home also needed extensive general repairs and replacements such as a new roof, appliances, new cabinets, interior doors, floors, and new bathrooms. This posed a challenge because much of the budget was allocated to non-energy related items.
Researchers made recommendations to achieve a HERS Index of 70 including choosing higher efficiency options when available for replacement items, such as appliances. This partner also implemented several of our deep retrofit recommendations. The improvement package included selecting white shingles and light color exterior paint rather than medium or dark colors, ENERGY STAR windows, air sealing details that reduced infiltration (test-out ACH50 = 8.1), total ceiling insulation of R-30, ENERGY STAR appliances, and CFLs in all light fixtures. The mechanical system was replaced with a 15 SEER heat pump and the distribution system tested exceptionally well at qn,out of less than 0.03. The partner did not incorporate the recommended passive outside air ventilation details in this home.
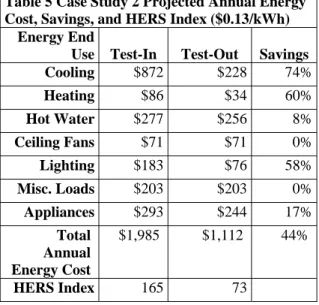
The post retrofit simulation produced a HERS Index of 73 and a projected annual energy savings of $873, a 44% savings over the test-in simulation. Total incremental cost for the energy efficient measures were $3,958, with a simple payback of five years and a monthly net cash flow of $46. A
summary of the annual energy savings by component is provided in Table 5.
Though this home narrowly missed achieving the HERS Index goal of 70, the projected annual energy savings of 44% places it well within the deep retrofit range of 30-50%.
Table 5 Case Study 2 Projected Annual Energy Cost, Savings, and HERS Index ($0.13/kWh)
Energy End
Use Test-In Test-Out Savings Cooling $872 $228 74% Heating $86 $34 60% Hot Water $277 $256 8% Ceiling Fans $71 $71 0% Lighting $183 $76 58% Misc. Loads $203 $203 0% Appliances $293 $244 17% Total Annual Energy Cost $1,985 $1,112 44% HERS Index 165 73 CONCLUSION
Working with eight non-profit and local government partners in this field investigation, researchers have conducted cost benefit analysis for deep retrofit packages for 36 unoccupied foreclosed affordable and middle income homes. Partners have completed renovation, which included general repairs with varying attention to energy efficiency, of ten homes. In six of the ten, partners achieved a post-retrofit HERS Index of 70 and/or 30-50% projected energy savings based on annual energy use
simulation. Three of the four remaining homes saw improvements between 15% and 30%. The
incremental cost is available for two of the homes at this time. One home (built in 1995) had predicted annual savings of $495 (33%), and the HERS Index was improved from 99 to 67 with an associated incremental cost of $3,327. The incremental cost included the full cost of a new heat pump water heater ($1,700) because it was installed strictly for energy efficiency improvement, not because the existing unit needed replacement. The other home (built in 1967) had predicted annual savings of $873 (44%), and the HERS Index was improved from 165 to 73 with an associated incremental cost of $3,958. All incremental costs for efficiency improvements in this house were from choosing higher efficiency options over minimum efficiency options of items that needed to be replaced.
More research is needed to better understand the cost-effectiveness of high performance exiting home
renovation. Older homes score poorly on the HERS index and have significant potential for energy savings; however, they may need more general repairs potentially reducing available funds for energy focused improvements. Finally, a basis for the development of cost-effective, high performance criteria for existing homes has been formed. REFERENCES
Busche, S. and Hockett, S. 2010. Identifying Cost-Effective Residential Energy Efficiency Opportunities for the Kauai Island Utility Cooperative. National Renewable Energy Laboratory, Golden, CO. Accessible at: http//www.nrel.gov/docs/fy10osti/48267.pdf Choi Granade, H., Creyts, J., Derkach, A., Farese, P.,
Nyquist, S., and Ostrowski, K., 2009. Unlocking Energy Efficiency in the U.S. Economy. McKinsey & Company, New York, NY. Accessible at:
http://www.mckinsey.com/clientservice/electric powernaturalgas/US_energy_efficiency/ Fairey, P., Vieira, R., Parker, D., Hanson, B.,
Broman, P., Grant, J., Fuehrlein, B., and Gu, L., 2002. EnergyGauge® USA: A Residential Building Energy Simulation Design Tool.
Proceedings of the Thirteenth Symposium on Improving Building Systems in Hot and Humid
Climates, Houston, TX, May 20-22, 2002.
Fonorow, K., Chandra, S., McIlvaine, J., and Colon, C. 2007. Commissioning High Performance Residences in Hot, Humid Climates.
Proceedings of the 7th International Conference
for Enhanced Building Operations,San
Francisco, Novemeber 1-2, 2007. Accessible at:
http://www.fsec.ucf.edu/en/publications/pdf/FS EC-PF-430-07.pdf
Leiserowitz, A., Maibach, E., Roser-Renouf, C., and Smith, N. 2010. Climate Change in the American Mind: Americans’ Global Warming Beliefs and Attitudes in June 2010. Yale Project on Climate Change Communication, Yale University and George Mason University, New Haven, CT. Accessible at:
http://environment.yale.edu/climate/files/Climat eBeliefsJune2010.pdf
Leiserowitz, A., Maibach, E., Roser-Renouf, C. and Smith, N. 2010. Climate Change in the American Mind: Public Support for Climate & Energy Policies in June 2010. Yale Project on Climate Change Communication, Yale
Haven, CT. Accessible at:
http://environment.yale.edu/climate/files/Policy SupportJune2010.pdf
Parker, D. and Cummings, J., Comparison of the ENERGYGAUGE USA and BEopt Building Energy Simulation Programs, 2009. U.S. Department of Energy, Building America Program Office of Energy Efficiency and Renewable Energy, Contract Report, Cocoa, FL, Accessible at:
http://www.fsec.ucf.edu/en/publications/pdf/FS EC-CR-1814-09.pdf
U.S. Department of Housing and Urban Development Office of Policy Development and Research. 2007. U.S. Housing Market Conditions 1st Quarter 2007. Washington, DC. Accessible at:
www.huduser.org/periodicals/ushmc/spring07/
USHMC_Q1_07national_data.pdf
U.S. Department of Housing and Urban Development Office of Policy Development and Research. 2010. U.S. Housing Market Conditions 1st Quarter 2010. Washington, DC. Accessible at: www.huduser.org/portal/periodicals/ushmc/spri ng10/nat_data.pdf
Will, A., and Baker, K. 2007. The Performance of Remodeling Contractors in an Era of Industry Growth and Specialization. Joint Center for Housing Studies, Harvard University, Cambridge, MA: Accessible at:
www.jchs.harvard.edu/publications/remodeling/ w07-8.pdf
Will, A. 2008. Understanding Remodeling Cycles. Cambridge, MA: Joint Center for Housing Studies, Harvard University, Cambridge, MA: Accessible at:
www.jchs.harvard.edu/publications/remodeling/
W08-6_will.pdf
Acknowledgements
This report was primarily sponsored by the U.S. Department of Energy, Office of Energy and
Renewable Energy, Building America Program under cooperative agreement number DE-FC26-06NT4267. Additional support was provided by the Florida Energy Systems Consortium (FESC). We appreciate the support and encouragement of FESC and our DOE program managers -- Mr. George James, Mr. Ed Pollock and Mr. William Haslebacher. This work would not have been possible without the willingness of our partners to pursue our mutual goals. The partners for the work presented in this paper are Sarasota Office of Housing and Community
Development (Sarasota County and the City of Sarasota, FL); Florida House Foundation; Community Housing Trust of Sarasota; Newtown Housing Trust; Volusia County, FL; Brevard County, FL; the City of Palm Bay; Orange County, FL; and Habitat for Humanity affiliates in Leesburg, FL, and in Mobile and Birmingham, AL.