A Training-Resistant Anomaly Detection System
Steve Muller1, Jean Lancrenon1, Carlo Harpes1, Yves Le Traon2, Sylvain
Gombault3, Jean-Marie Bonnin3
Abstract
Modern network intrusion detection systems rely on machine learning tech-niques to detect trac anomalies and thus intruders. However, the ability to learn the network behaviour in real-time comes at a cost: malicious software can interfere with the learning process, and teach the intrusion detection sys-tem to accept dangerous trac. This paper presents an intrusion detection system (IDS) that is able to detect common network attacks including but not limited to, denial-of-service, bot nets, intrusions, and network scans. With the help of the proposed example IDS, we show to what extent the training attack (and more sophisticated variants of it) has an impact on machine-learning based detection schemes, and how it can be detected.
Keywords: training attack, intrusion detection system, anomaly detection, network security, machine learning
1. Introduction
Intrusion detection is a quite old research topic (the rst papers being pub-lished in the 1980's [1] [2]), yet it still constitutes an actively researched domain of computer security, especially in the eld of cyber-physical systems such as Supervisory Control and Data Acquisition (SCADA) systems or Advanced Me-tering Infrastructures (AMI) [3]. Over the past few years, the increasing interest in machine learning techniques led to the development of more sophisticated,
1itrust consulting s.à r.l., {steve.muller,lancrenon,harpes}@itrust.lu 2University of Luxembourg, [email protected]
so-called anomaly detection systems, which learn the `typical' behaviour of a monitored network or system. That way, they are able to spot deviations from the normal behaviour and thus, to a certain extent, detect previously unseen attacks.
Given the fact that a lot of dierent IDS strategies have been proposed over the years [4] [5], it is important to choose the one that really suits the needs. For instance, anomaly detection systems typically require the monitored network to be suciently static and predictable. While this is not necessarily the case for arbitrary computer networks. cyber-physical systems usually do meet this requirement, so a lot of research [3] has been conducted over the past few years in developing and improving on intrusion detection techniques for cyber-physical systems [6].
In addition, an automated learning system commonly requires a supervised initial training phase, during which it is faced with (manually labelled) benign and malicious data so that it learns the dierence between these two data sets. Naturally, for optimal results, the learning process should be carried out directly in the target network, and not in a lab. Nevertheless, many researchers use recorded data sets (such as the KDD'99 [7] data set) to evaluate the performance of their anomaly detection algorithm. Unfortunately, the latter data sets are too generic to be actually used to train and deploy an intrusion detection system in a real network. This common practise can be explained by the fact that the used protocols are often proprietary or unknown, and that the network infrastructure is too complex, undocumented, or not available as a testing environment.
Moreover, an ideal intrusion detection system would spot undesirable content without requiring a training phase, since it can then be directly deployed in any production environment that is not known beforehand. In the machine-learning domain, some schemes already exist which autonomously tell `normal' data apart from outliers, and which are thus suitable for intrusion detection [8]. For our purposes, clustering-based schemes seem to be the most promising ones, since they are unsupervised, relatively light-weight from a computation point of view (which is important if one wishes to build a real-time intrusion detection
system), and allow multiple behaviours to be modelled at the same time (in contrast to Bayesian statistics, which merely splits the data into `normal' and `abnormal'). Moreover, they yield comprehensible results, in contrast to e.g. neural networks, where it is not so clear why they gave a certain output.
For machine-learning based intrusion detection techniques, a lot of research has been made over the years, that increased their performance, their relia-bility, and their scope. However, attacks are also becoming more and more sophisticated. The most developed of them are referred to as advanced persis-tent threats (APT): they cover all kind of hacking or spying activities that are particularly stealthy and persistent [9]. Given the fact that most networks and computer systems rely on anti-virus agents and intrusion detection systems, a lot of money and eort is put now into evading these security mechanisms [9]. Automated learning systems (and especially those that continuously adapt to live data) are particularly aected by this fact, because their learning process can often be manipulated in such a way to make them progressively used to malicious data. This process is referred to as the training attack.
It is virtually impossible to design an intrusion detection system that de-fends against all modes of operation of APTs (and this is especially true when they are targeted, and thus human-operated). Therefore, in order to better un-derstand how stealthy and long-term attacks act on a computer network, this paper focuses on a concrete example of an evasion technique that may be used by an advanced persistent threat, namely the training attack. To the best of our knowledge, very little research has been done to date, that analyses the robustness of intrusion detection systems against such evasion techniques.
The rest of this paper is organised as follows. Section 2 describes related work. In the following Sections 3 and 4 the threat model and the detection strategies are discussed, respectively. In particular, our proposed IDS is outlined in Section 4.3. The importance of the right parameter values is addressed in Section5, and their choice is evaluated in Section6. The paper concludes with Section7.
2. Related work
Several other authors have adopted the approach of applying clustering tech-niques to a data stream collected from network (meta) data. A related area of research is the realm of stream clustering algorithms, which are able to cluster stream data (such as network meta data) on-the-y. A comprehensive state-of-the-art has been recently composed by Ghesmoune et al. [10], and is out of the scope for this paper. It is, however, not obvious how the resulting clusters can be interpreted in terms of intrusions or anomalies, and the related research area is also comparatively young.
For example, Tomlin et al. [11] propose an IDS based on k-means and fuzzy cognitive maps (FCM) that is applied to security events of a power system. They manage to improve on the detection accuracy of existing clustering-based IDS, but they still require a training data set for initial learning.
Hendry et al. [12] do not design an intrusion detection system per se, but they introduce an algorithm that uses data clustering to create attack signatures from recorded data. Unfortunately the algorithm needs to pre-process the data so that it cannot be used for on-line detection.
Similarly, Leung et al. [13] develop a density-based clustering algorithm (called fpMAFIA), but it also requires a supervised learning session.
In contrast, Zhong et al. [14] use an on-line variant of the k-means algorithm to group meta data of WLAN trac into k clusters, for a xed k. Any data point that is too far away from the center of the largest cluster, is considered an anomaly. While this approach is completely unsupervised, it has comparatively low detection rates of65−82%.
A similar approach is adopted by Alseiari et al. [15], who use a simplied k-means variant (mini-batch k-k-means) to split smart meter readings into clusters; if a cluster is smaller than a given xed value, it is considered anomalous. Most interestingly, they also account for the clusters' evolution by applying a sliding time window to the data. The authors claim to get slightly better detection rates, but also admit that the reported results are sometimes unreliable (100%
false positive rate) and that more research is needed to tackle the issue. An emerging research topic deals with the problem of training attacks that try to fool the intrusion detection systems by progressively manipulating the data they monitor. Wagner and Soto [16] were the rst to raise awareness about the issue; Barreno et al. [17] explored the topic in more detail for intrusion detection systems.
Some authors focused on the related mimicry attack, which consists in evad-ing the IDS, but not manipulatevad-ing it permanently. Among them, Stevanovic et al. [18] disseminate on real-world occurrences of mimicry attacks for the case of anti-DDoS systems. The solution they propose consists in applying two inde-pendent anomaly detection systems: one classical for DDoS detection, and one which particularly focuses on mimicry attacks.
Yen et al. [19] describe an IDS which detects certain `stealthy' malware by monitoring the similarity in behaviour of the hosts in a network. The authors claim that using these techniques, they are able to tell genuine trac apart from mimicked one. The IDS has certain limitations though; for one, it can only detect spreading malware, but not targeted attacks. Secondly, it partly requires plain-text communication (for payload inspection).
3. Attack scenarios
There is no such thing as perfect security; intrusion detection systems cannot detect all kinds of attacks, and will always make mistakes. Therefore it is important to state precisely which attacks shall be detected by the IDS, and which ones are not actively considered. The purpose of this section is to describe the threat model that is targeted by our intrusion detection system.
First of all, our IDS is meant to be deployed in parallel to signature-based detection engines (such as o-the-shelf anti-virus solutions), and will focus on network attacks, only. Due to the expected mass of data, and due to the increas-ing use of encryption in network streams, our IDS does not intend to inspect the payload. Instead, it will examine the meta data obtained by modelling the
`behaviour' of the network ows.
3.1. Network attacks and induced anomalies
Many network attacks induce a change in the characteristics of a network stream, that otherwise would not (or only under rare circumstances) occur. The most prominent example is the distributed denial-of-service (DDoS) attack, which consists in increasing the number of connections to a host, the amount of data sent to a host, the frequency of connecting to a host, or possibly all of them. Note how all of these can be measured independently of the used protocol or of encryption.
Brute forcing is somewhat related, although its goal consists in gaining ele-vated access rights, rather than bringing down a host. It operates similarly to DDoS attacks, but in a less aggressive way (that is to say, with lower data rates and less connections).
Another good example of abnormal behaviour is network scans. Whereas they do not constitute an attack on their own, they still allow an attacker to make out possible targets and collect information about open ports. In order to launch such a scan, one unavoidably has to make a lot of out-going connections, which are not usually seen on the network.
A fourth category covers all kinds of intrusion and routing attacks. They primarily consist in deviating network streams to third parties (`men in the middle'), who sni or manipulate the trac. An IDS could detect such in-truders by keeping track of the connectivity graph, listing all pairs of machines that are known to communicate with each other. In cyber-physical systems, many processes are regular and repetitive, so watching the timely behaviour of connections might also reveal intruders.
Finally, a less frequent, yet important threat is computer worms. They spread over the network by exploiting vulnerabilities of the host machines. De-tecting them is not trivial at all, since the attack pattern depends a lot on the actual exploit; in fact, a single network packet might even suce, but it will go completely unnoticed in the sheer mass of trac in busy networks. However,
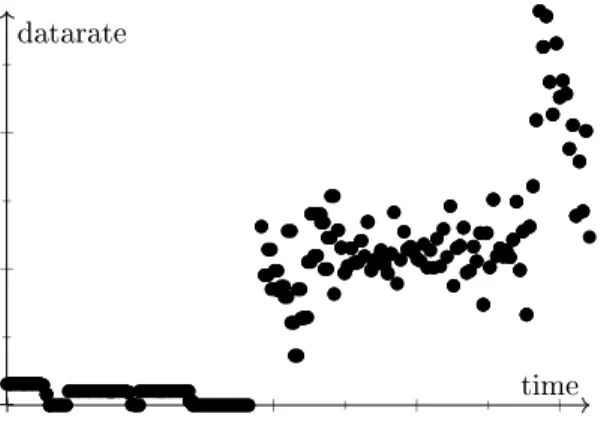
time datarate
Figure 1: Illustration of a typical denial-of-service attack. Note the abrupt `jumps' for the measured data rate. This example is based on the data sets recorded by Garcia et al. [20].
sometimes worms use outdated or unused protocols, the mere presence of which is already suspicious in that case, a somewhat reliable detection is possible.
All of these threats have good chances to be discovered if one monitors the network ows between every two hosts, and watches out for deviations or sudden changes in their behaviour. That behaviour is characterised exactly by the meta data mentioned above. Following the research of Berthier et al. [21], good candidates for being monitored include:
the number of bytes transmitted over a certain time period (e.g. 10 sec-onds);
the average packet size;
the number of concurrent connections; the pause since the last packet.
The rst two are somewhat related and allow the IDS to detect abuse of a network service; the third one is specically meant to detect distributed attacks; the last one will aid in nding injected (irregular) packets.
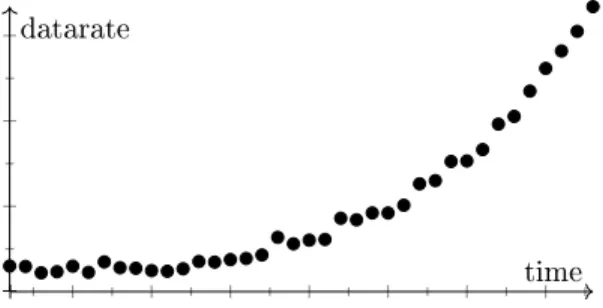
time datarate
Figure 2: Illustration of the training attack over time, for the case of the data rate. An attacker proceeds by progressively injecting more and more packets until he eventually reaches the desired critical threshold.
3.2. Training attack
Once an intrusion system is in place and learns the typical behaviour of the network, attackers can (and will) try to evade it. Among the evasion techniques is (what we call) the training attack, that is closely related to mimicry and IDS evasion attacks ([16, 17]). In contrast to the latter, it does not only consist in hiding from the IDS, but also manipulates the IDS permanently. It does so by injecting packets that progressively increase any of the monitored quantities, until the target objective has been reached. That way, any future malicious trac is also considered as normal. See Figure2for an illustration.
The attack has been thoroughly discussed by Barreno et al. [17], who suggest slowing down the learning process. Although this approach makes a training attack exponentially harder, it will also render the IDS inert. This paper in-troduces another strategy that does not suer from this drawback; it is based on the idea to also consider the long-term evolution of the monitored quantities (see Section4).
3.3. Stealthy training attack
The training attack consists in slowly shifting the network behaviour towards a malicious state. While these progressive and slow changes are barely noticeable in a short term, they become suddenly visible when looked at on a large time scale. However, in order to cover up the training attack even in this scenario,
time datarate
Figure 3: Illustration of the stealthy training attack over time. Instead of only increasing the trac load, an attacker creates enough `normal' data in-between, which outweighs (and thus hides) the malicious trac.
an intruder can hide the malicious trac by accompanying it with additional, but normal data. So instead of shifting the behaviour towards a bad state, he increases the spectrum of behaviours to additionally include the bad state. Figure3illustrates this.
4. Intrusion detection techniques
Several techniques have been proposed for detecting network attacks. Sec-tion2 gives an overview of the state-of-the-art intrusion detection schemes. 4.1. Threshold and metric based
Among them, the most simple strategy is to x a threshold for the monitored quantities in advance. It is to be noted that this approach is not based on machine-learning, and thus requires a human to dene the threshold(s) for each and every ow in the network. Moreover, such a system is completely inert to changes in the network behaviour, so the thresholds need to be continuously reviewed. This, however, makes the IDS also insensitive to the training attack. Instead of xing the thresholds in advance, one could also learn them with the aid of statistical quantities like average and variance. This solution is not as simple as it seems, because it is not so clear what the precise threshold should be. If one assumes that the network load follows a probabilistic distribution, then one can compute the probability that a monitored quantity is according to the probabilistic law, and conversely, if it deviates too much. For instance, for a normally distributed quantityN(µ, σ2), 99.7% of all samples lie withinµ±3σ.
20 40 60
time data rate (kB/s)
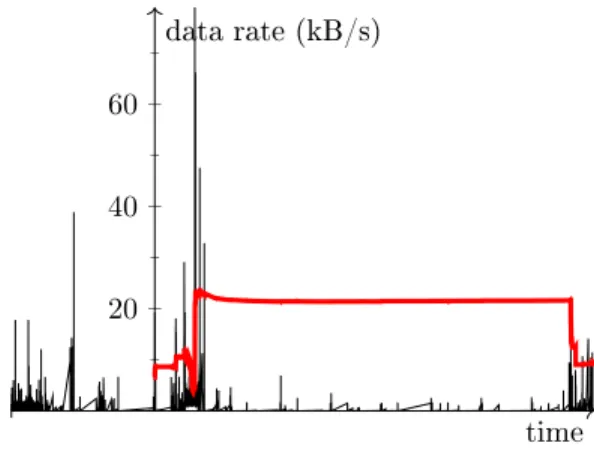
Figure 4: Illustration of typical data rates for HTTP trac (thin black line). Note how the
µ+ 3·σthreshold value (thick red line) is not a good descriptor of `normal' trac and thus a
bad candidate for detecting outliers in the trac. This is due to the fact that HTTP trac is not even closely normally distributed.
Threshold-based approaches suer from several drawbacks. For one, they do not behave well with inhomogeneous trac. Indeed, the data rate of a network ow is typically characterised by (at least) two states: an idling state where no communication is made (so data rate 0), and an active state (with data rate δ). Computing the statistical properties of these two states, one ends up with an average data rate of something in-between, which does not yield the desired threshold at all. Experiments suggest that the situation gets worse if more than two states are involved: Figure 4 depicts the outcome of such an experiment with real-world HTTP trac (taken from [22]).
Other machine-learning approaches (including support vector machines and regression methods) that reduce the data to a single metric value suer from the same issue, for the same reasons.
Second, like any criterion that involves the standard deviationσof statistical data, the strategy adopted here will encounter stability problems if the trac approaches constant behaviour (in which case the standard deviationσis close to zero). One can circumvent the issue by assuming a minimal valueσ, but then one has to fall back upon a hard coded parameter again.
Third, this approach is vulnerable to the training attack: even when an attacker uses the linearly increasing sequence of data pointsδt:=a·t(for any constant a >0), a threshold-based IDS will not detect the attack. The proof requires some tedious calculations and is therefore omitted, but one can readily deduce from the denitions
µ(t) = t X i=t−T δi σ2(t) = 1 T · t X i=t−T (δi−µ)2
that indeedδt+1 < µ(t) + 3·σ(t) for allt, so the IDS does not raise an alert at any time. Here,T denotes the number of elements covered by the mean and variance; its value does not have an inuence on the statement.
4.2. Stream-clustering based
In contrast to many other machine learning techniques, stream clustering algorithms support inhomogeneous trac quite well, since they particularly aim at learning the dierent behavioural classes: from a sequence of data points, they group similar (or close) ones together into a cluster.
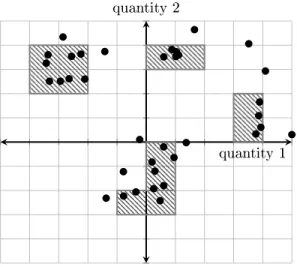
Researchers have already put a lot of eort into designing stream clustering algorithms [23] that categorise data streams in real-time. The algorithm that ts the needs of our set-up best is D-Stream [24], since it is parameter-less and supports arbitrarily-shaped clusters. It proceeds by dividing the state space into a grid, and continuously computes the density of encountered data points per grid cell. A cell is called dense if it contains a certain number of data points; clusters are then dened to be the connected components of dense cells. Figure5
shows an example of such a grid; further details can be found in the original paper by Chen et al. [24].
The clusters account for the several encountered classes of behaviour, whereas outliers (data points which do not match any cluster) account for statistical ab-normalities. It is important to observe that it is not the objective of the IDS to detect the outliers, but changes in the behaviour of the network streams (which manifest themselves by changes in the clusters).
quantity 1 quantity 2
Figure 5: Example of a two-dimensional state space divided into a grid, at a particular time
t. Bullets denote data points; dense cells are hatched. In this example, there exist 4 clusters
at timet.
Udommanetanakit et al. [25] have extensively deliberated the possible op-erations on the set of clusters and their implications. In short, there exist ve operations (appearance, disappearance, evolution, splitting, and merging of clusters). Of those, an appearing cluster signals previously unseen behaviour, which indicates an attack or intrusion. Stream clustering algorithms are typ-ically able to detect new clusters in real-time, and are thus good candidates for detecting the network attacks discussed in Section3.1. Regarding the evo-lution of clusters, the issue is trickier. Although such algorithms account for changes in the input data, they cannot tell small uctuations (e.g. due to sta-tistical abnormalities) from long-term evolutions of a cluster (e.g. caused by the training attack). So, raising an alert whenever a cluster evolves either yields too many false positives, or forces one to introduce a threshold value (which in turn, requires expert knowledge).
In our work, we improve on existing stream clustering techniques to also detect the training attack, without requiring any additional parameters to be set.
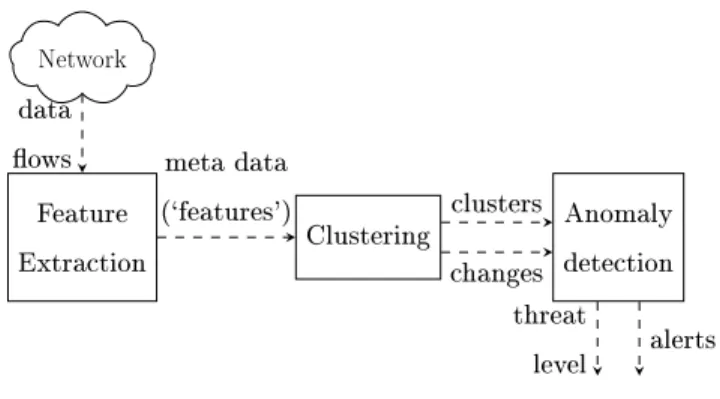
Network Feature Extraction Clustering Anomaly detection data
ows meta data
(`features') clusters
changes threat
level alerts
Figure 6: Work-ow of the intrusion detection system.
4.3. Proposed IDS
The proposed network intrusion detection system (NIDS) operates passively on the whole trac of a network. It processes each ow between any two hosts in the networks independently, extracts the relevant features (see Section3.1) and applies clustering techniques to the latter. In this context, a ow comprises all network packets from all data streams sent from the rst peer to the second one at a specic TCP/UDP port; for instance, the h10.0.0.1,10.0.0.2,80i ow
consists of the whole HTTP trac between10.0.0.1 and10.0.0.2(not just one single HTTP connection).
Figure6shows the work ow of the IDS. An alert is raised whenever a new cluster is created.
The used data clustering algorithm is based on D-Stream [24]. It proceeds by dividing the state space into a grid and keeps track of the density of recorded data points for each obtained cell. The density includes an exponential decaying over time, which enables the system to adapt to changes in the network. The densitydC(t)of a cellC at timetis dened by
dC(t) =
X
p:data point inC λt−tp
wheretp is the time when a data pointpwas recorded. 0< λ <1 is called the decay parameter and controls how fast the IDS forgets old data. Following the
denition in [24], Section 3.2, a cellC is called dense at timetif dC(t)≥
Cm N(1−λ),
where N is the total number of cells in the grid, and Cm is a xed constant. The authors claim that Cm = 3 is a good choice; however, experiments (see Section6) and calculations (see Section 5.3) reveal thatCm:= 10−5serves our purposes much better. The huge dierence can be explained by the fact that they implicitly assume uniform background noise, whereas our data is locally distributed with almost no noise. Finally, a cluster is a maximal connected component of neighbouring dense cells.
The clustering algorithm consists of an on-line phase (during which the den-sities are continuously updated) and an o-line phase (during which the clusters are updated). In particular, alerts are raised only during the o-line phase, since this is the only moment when new clusters may appear or evolve. The latter phase is triggered at intervals of timeΓ. In the following,Γis referred to as the clustering interval.
4.4. Detecting the training attack
Deployed as-is, the proposed IDS is still vulnerable to the training attack. This is mainly due to the fact that it can only detect sudden changes at a certain time scale (controlled by theλandΓparameters).
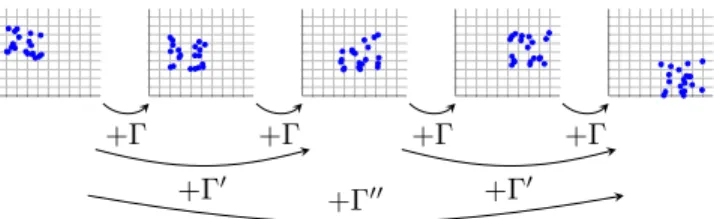
However, if several clones of the IDS are launched in parallel, with dier-entλand Γ parameters respectively, then each instance can detect changes at a dierent scale. When observed at short time periods, the subtle change in behaviour caused by the training attack may be hard to detect. However, for a dierent instance that updates its clusters less often, the otherwise slow evo-lution appears as a deletion together with a creation of a cluster, and is thus detected see Figure7.
4.5. Detecting the stealthy training attack
The classic training attack consists in moving clusters; in contrast, the stealthy version does not touch a cluster, but extends (enlarges) it in such a
+Γ +Γ +Γ +Γ
+Γ0 +Γ00 +Γ0
Figure 7: The several steps of the training attack and how they appear at dierent time scales.
way that it also includes data points associated to malicious behaviour. Since no new cluster is created, no alert will be raised, either regardless of the time granularity.
However, what does change is the size (number of covered cells) of the clus-ters. Monitoring those sizes will allow the IDS to detect the stealthy training attack, as well. One could now dene a threshold size which a cluster should not exceed, but there is a more elegant way. In fact, the same discussion as the one on intrusion detection techniques above also applies here. So the preferred solution is to apply yet another instance of our proposed IDS, but this time on the output (that is, the size of the generated clusters) of the actual IDS. That way, one truly obtains a `dual' IDS.
5. Choice of parameters 5.1. Decay parameter
The decay parameter 0 < λ <1 inuences the learning capabilities of the IDS. The higher its value, the longer a data point will be `present' in the grid cell. Recall that the weight of a data point within its cell decays exponentially with time (t7→λt−t0). Ifλ= 0, learning will be completely disabled. Setting
λ= 1will give every data point ever recorded the same weight, so the IDS will always take the whole history into account when computing the clusters, and never forget anything.
The exact choice of the parameter depends on the environment where the IDS is deployed. In an ideal world, where the infrastructure and behaviours remain
constant, one would indeed setλ:= 1. Real-world set-ups are dierent; devices may join or leave the network, software updates may add new functionality yielding a change in behaviour of the network streams, and so forth.
In order to determine a good value for λ, one needs to take into account the estimated periodT between (expected) signicant changes in the network. Data older thanT should rightfully be `forgotten' by the IDS. For cyber-physical systems, this can be as large as three months. For home networks, several days would be a more reasonable value. Proposition1 provides a maximal value for λgiven T, which will be picked in the implementation of the IDS for optimal results.
In the following, we deem that if a data point has≤1%of the total weight available, it is barely noticeable.
Proposition 1. Let T > 0. Let N be the number of grid cells. Suppose the data points are recorded in regular time intervals. Ifλ≤10−2/T, then all data points older thanT make up, in total,≤1%of the whole weight available in the grid.
Proof. Denote the length of the regular time intervals by f. The cumulative weight of all data points ever recorded is
∞
X
i=0
λi·f = 1 1−λ.
Similarly, the cumulative weight of all data points older thanT is ∞ X i=T /f λi·f =λT · ∞ X i=0 λi·f = λ T 1−λ. By assumption,λT ≤ 1
100, which concludes the proof. 5.2. Clustering interval
The clustering interval parameter controls how often the data is clustered and scanned for intrusions. If the interval is chosen too long, short-term attacks go entirely unnoticed, since their footprint fades out before the clustering takes place. If it is too short, the engine is unable to detect long-term evolutions.
The strategy is thus two-fold. On the one hand, one needs to choose the longest possible intervalΓso that all short-term attacks can still be noticed. On the other hand, additional instances of the IDS (running with larger clustering intervals, see Section5.4) will make sure that long-term evolutions will not be missed, either. Proposition2gives a hint on how to chooseΓ for our purposes. Proposition 2. LetΓ>0 and0 < p <1. Let N be the number of grid cells. Suppose the data points are recorded in regular time intervals. Assumeλ= 1−ε for someε1.
IfΓ = Np, then any data point younger thanΓmakes up at least appart of the weight gained by a cell on average during timeΓ.
Proof. Denote the length of the regular time intervals byf. Thenn:= Γf data points have been recorded after timeΓ. Their cumulative weight is then
n−1 X i=0 λi·f = 1−λ f·n 1−λ = 1−λΓ 1−λ = 1−exp (Γ lnλ) 1−λ .
If λ ≈ 1 then lnλ ≈ 0 and thus exp (Γ lnλ) ≈ 1 + Γ lnλ. Further ln(λ) = ln(1−ε)≈ −ε. Using this, one gets
1−exp (Γ lnλ) 1−λ ≈ −Γ·lnλ 1−λ ≈ Γ·ε ε = Γ. Thus, the average weight gained by a cell is ≈ Γ
N =
1
p. The proportion of the weight of any data point younger thanΓwith respect to the average is at least
λΓ 1/p ≈
1 1/p =p.
Proposition2reveals that if the clustering intervalΓ = 600s is chosen and the state space is divided intoN = 50cells, then all data points recorded between two o-line clustering processes will make out Γ
N ≈ 8% of the average weight gain of a cell. That is, each of those data points still has a considerable impact on the weight of the cell.
Our experiments also conrm thatΓ = 600s= 10min is a good choice, see Section6.
5.3. Density parameter
A cellC is dened to be dense ifdC(t)≥ N(1Cm−λ). According to [24], a good choice isCm:= 3, but this leads to no cell ever being marked as dense in our set-up. This can be explained by the fact that they have much more data points spread over the whole state space, whereas we deal with locally condensed data. Proposition3 suggests better values forCm.
Proposition 3. Let Γ > 0 and Cm > 0. Let N be the number of grid cells. Suppose the data points are recorded in regular time intervals. IfCm≤1−λΓ, then any cell that received at least the average weight during timeΓ, is dense. Proof. Denote the length of the regular time intervals byf. Thenn:= Γf data points have been recorded after timeΓ. Their cumulative weight is
n−1 X i=0 λi·f =1−λ f·n 1−λ = 1−λΓ 1−λ, so the average weight of a cell is 1−λΓ
N·(1−λ). If a cellCreceived at least the average weight, then dC(Γ)≥ 1−λΓ N·(1−λ) ≥ Cm N·(1−λ), so by denition,C is dense.
For instance, if λ= 0.011/1d and Γ = 10min, then Cm := 0.03would be a good choice. Ifλ= 0.011/30dandΓ = 10min, then opt forC
m:= 0.001. 5.4. Detecting the training attack
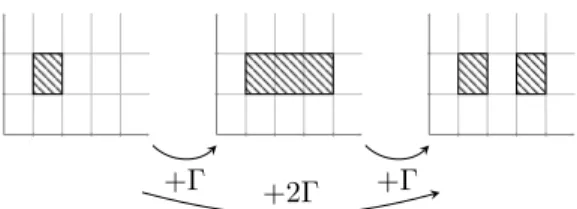
To the clustering-based IDS, the classic training attack as described in Sec-tion3.2appears initially as an enlargement of the cluster, followed by a splitting into two clusters (see Figure8). Note that these are two legitimate steps, so the IDS will not raise any alert.
However, if the o-line clustering between those two steps were omitted, the single resulting step would be correctly identied as malicious, since a new cluster is created. The strategy is thus to apply an additional, independent
+Γ +2Γ +Γ
Figure 8: The two (legitimate) steps that the training attack consists of. Dense cells are hatched. If the intermediate clustering is omitted, the situation will look as if a new cluster is created, and an alert will be raised.
clone of the IDS with clustering interval2·Γ. Similarly, the argumentation can be applied recursively on the second IDS to require a third one with clustering interval4·Γ, and so forth. Eventually they will cover a time span2n·Γwhich is so long that an attacker will not bother trying; for instance, ifΓequals 1 month, and 50 years should be covered by the IDS, then one requires log2 501my ≈ 9 instances.
The nal intrusion detection system thus consists of (for instance) 9 inde-pendent instances, each invoked with a dierent value forΓ. An alert by any of these clones then results in an alert by the nal IDS. Since the clones are independent, they can be run on dierent CPUs or even on multiple devices no synchronisation is necessary. However, in order to avoid that multiple clones are triggered by the same attack, one can account for only one alert within a given time interval.
6. Evaluation
We ran several dierent simulations on various data sets, including [22], [26], and our own recordings. For all experiments that follow, the state space (describing the data rate) is divided into a logarithmic scale ofN = 50values ranging from100B/s to 109 B/s.
6.1. Detecting network attacks
The objective of the rst set of experiments is to verify if the proposed IDS is actually able to detect classic network attacks (such as denial-of-service). As
argued in Section5.1, using a decay parameter ofλ:= 0.01−10days guarantees that any data encountered will be forgotten after roughly ten days. For the clustering interval, we chooseΓ = 10min.
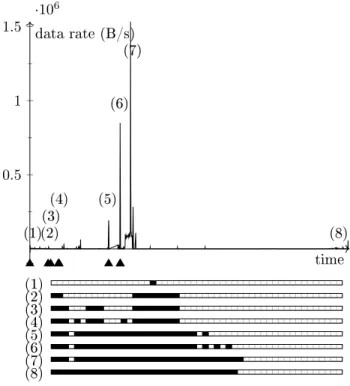
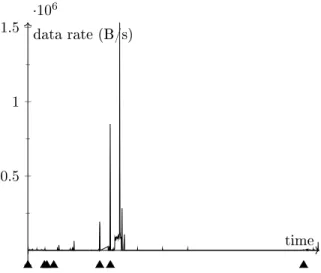
Figure9depicts the simulation results on the data set [22], which contains 24 hours of network trac produced by personal computers. As can be read o from the gure, the trac is relatively low most of the time, and sporadically features small peaks (e.g. (1)(4) and (8) in Figure9). However, most importantly, the data sets also contains peaks (see (5), (6) and (7) in Figure 9) that may be worth being investigated. The objective of the intrusion detection system is to be able to detect this kind of change in behaviour.
Launching our IDS on the data set, we notice that at rst, several clusters were created at the very beginning (which acts as a learning phase, so the alerts were expected). The rst major peak ((5) in Figure9) is correctly identied as new behaviour, and so is the second one (6). The third peak (7) is classied to be in the same cluster than the previous one, so no alert is raised. Any later trac matches the expectations of the IDS and does not lead to the creation of new clusters.
If the decay parameter is too low, clustering information will be forgotten too fast. Settingλ:= 0.01−1daywill cause the IDS to forget data after roughly one day, which is also what is observed in the 24-hour simulation depicted in Figure10. In fact, this experiment proves the soundness of the discussion onλ conducted in Section5.1.
6.2. Detecting the training attack
We were unaware of any data set that has recorded a training attack, and thus had to create one on our own. For this purpose, the `4SIC Geek Lounge' data set [27] describing 18 hours of real SCADA trac has been extended (by looping it) to a one-year period so as to obtain a good basis of `regular' data. Figure11shows the content of the data set. Note that the two types of behaviour clearly prove the applicability of our intrusion detection approach.
(1) (2) (3) (4) (5) (6) (7) (8) (1)(2)(3) (4) (5) (6) (7) (8) 0.5 1 1.5 ·106 time data rate (B/s)
Figure 9: Successful detection of unusually high out-going trac for one of the hosts in the [22] data set. The triangles denote the times when new clusters were created (thus alerts raised). Below the gure, the clusters are explicitly drawn for the snapshots (1) to (8): boxes represent the cells in the one-dimensional state space; black boxes denote dense cells.
0.5 1 1.5 ·106 time data rate (B/s)
Figure 10: A small decay parameter (λ = 0.01−1day) makes the IDS forget data too fast. The triangles denote the times when new clusters were created (thus alerts raised); note the additional nal clustering at the very right of the gure which occurs after approximately a day.
learns the behaviour of the trac, raising no alerts. Experiments show that λ= 0.01−1/1dayis too low (it yields false positives) andλ= 0.01−1/30days turns out to be too long in the following discussion (the training attack does get detected, but only after almost one year).
In parallel, we crafted articial data packets with a slowly increasing packet size and frequency, and merged the obtained packets with the real data set. The resulting data set contains the recording of an articial, yet theoretically feasible training attack. The caused increase in the data rate roughly follows an exponential law (t7→1.1t).
Following the discussion in Section 5.4, several IDS instances are launched on that data set, each of which has a clustering interval twice as large as the previous one. In this use-case, it results in 16 instances ranging fromΓ1= 10min to Γ16 = 228d. As expected, the rst few instances are unable to detect the training attack. However, the long-term clones (Γ14,Γ15,Γ16) successfully raise an alert after some initial learning phase see Figure12for an illustration.
200 400 600 800 1,000 200
400 600 800
elapsed time (min) data rate (B/s)
Figure 11: The `4SICS Geek Lounge' data set recorded on real SCADA equipment for 18 hours, starting at 5:52 p.m. One can clearly distinguish the night as a period of low activity (7:42 p.m. to 8:30 a.m.).
data rate, and an initially increasing but eventually stagnating data rate. In all cases, the longer-term instances were able to detect the attack, while the shorter-term ones were not.
6.3. Detecting the stealthy training attack
A much more sophisticated version of the training attack consists in contin-uously injecting the complete spectrum between normal and malicious trac. To do so, an attacker repetitively increases the data rate until a given threshold, drops back to normal, and slowly increases again (see Figure13). As predicted in Section3.3, simulations show that our IDS never creates a new cluster, but increases the size of existing ones, instead; by consequence, no alert is raised and the attack remains undetected.
As a counter-measure, we proposed to include the maximum cluster size in the set of monitored quantities (in parallel with the data rate). In contrast to previous simulations, where the maximum cluster size remained more or less constant (it deviated by at most±3), it increased by a decent amount in this case. Indeed, applying the same detection techniques on the maximum cluster
WithΓ14= 57d: WithΓ15= 114d: WithΓ16= 228d: 0.5 1 1.5 2 ·104 time data rate (B/s)
Figure 12: The training attack combined with the [27] data set. The triangles denote the times when new clusters were created (thus alerts raised) for the instances withΓ = 57d,114d,228d,
respectively.
size (thus, on the output of the actual IDS) yields the desired results see Figure13.
7. Conclusion
This paper deliberates modern anomaly-based intrusion detection techniques that learn the behaviour of network streams. It is to be noted that the former can only reliably recognise attacks which induce a considerable change in behaviour of the network. Traditional signature scanners perform much better when it comes to detecting specic malware, and should be applied in parallel. While state-of-the-art intrusion detection systems classify individual data packets as good or malicious, the IDS proposed in this paper rather focuses on grouping similar data packets and decides upon each cluster if it is normal or not. The advantage of this approach is a more stable behaviour with respect to statistical noise, since single outliers do not immediately yield a (false) alert. In addition, the decision of the algorithm can be retraced more intuitively than for other machine-learning based approaches.
0 0.5 1 1.5 2 2.5 ·107 time data rate (B/ s) 0 10 20 30 40 50 cluster size
Figure 13: The stealthy training attack combined with the [27] data set. The right graph depicts the data rate as induced by the attack, while the left graph depicts the evolution of the cluster size. Although no alert is raised for the behaviour of the data rate, the dual IDS does identify the increase of the cluster size (alerts marked with red triangles).
This paper gives evidence that live learning systems can be tricked by in-terfering with the learning process, and presents the so-called training attack that makes such a system eventually accept malicious behaviour. We propose a detection scheme that is, to a certain extent, resistant to this kind of attacks. It consists in considering the input at multiple time resolutions, which consider-ably hardens long-term changes in the behaviour. In order to provider a better understanding of the consequences of a fooled IDS, we presented a stealthier variant of said attack and discussed how to counter it. However, our research only scratched the surface of possible tricking techniques, and there are probably further opportunities for attackers to evade the IDS.
The solidity of our approach is validated, on the one hand, by a mathe-matically sound choice of parameters, and on the other hand, by simulations conducted on real network trac from various sources.
Acknowledgements
This work was supported by the Fonds National de la Recherche, Luxem-bourg (project reference 10239425) and was carried out in the framework of the H2020 project `ATENA' (reference 700581), partially funded by the EU.
[1] J. P. Anderson, et al., Computer security threat monitoring and surveil-lance, Tech. rep., James P. Anderson Company, Fort Washington, Penn-sylvania (1980).
[2] D. E. Denning, An intrusion-detection model, IEEE Transactions on soft-ware engineering (2) (1987) 222232.
[3] R. Mitchell, I.-R. Chen, A survey of intrusion detection techniques for cyber-physical systems, ACM Computing Surveys (CSUR) 46 (4) (2014) 55.
[4] S. Axelsson, Intrusion detection systems: A survey and taxonomy, Tech. rep., Technical report (2000).
[5] A. Milenkoski, M. Vieira, S. Kounev, A. Avritzer, B. D. Payne, Evaluating computer intrusion detection systems: A survey of common practices, ACM Computing Surveys (CSUR) 48 (1) (2015) 12.
[6] B. Zhu, S. Sastry, Scada-specic intrusion detection/prevention systems: a survey and taxonomy, in: Proceedings of the 1st Workshop on Secure Control Systems (SCS), Vol. 11, 2010.
[7] KDD Cup.
URLhttp://kdd.ics.uci.edu/databases/kddcup99/kddcup99.html
[8] A. L. Buczak, E. Guven, A survey of data mining and machine learning methods for cyber security intrusion detection, IEEE Communications Sur-veys & Tutorials 18 (2) (2016) 11531176.
[9] E. Cole, Advanced persistent threat: understanding the danger and how to protect your organization, Newnes, 2012.
[10] M. Ghesmoune, M. Lebbah, H. Azzag, State-of-the-art on clustering data streams, Big Data Analytics 1 (1) (2016) 13.
[11] L. Tomlin Jr, M. R. Farnam, S. Pan, A clustering approach to industrial network intrusion detection, in: Proceedings of the 2016 Information Se-curity Research and Education (INSuRE) Conference (INSuRECon-16), 2016.
[12] G. R. Hendry, S. J. Yang, Intrusion signature creation via clustering anoma-lies, in: SPIE Defense and Security Symposium, International Society for Optics and Photonics, 2008, pp. 69730C69730C.
[13] K. Leung, C. Leckie, Unsupervised anomaly detection in network intrusion detection using clusters, in: Proceedings of the Twenty-eighth Australasian conference on Computer Science-Volume 38, Australian Computer Society, Inc., 2005, pp. 333342.
[14] S. Zhong, T. M. Khoshgoftaar, S. V. Nath, A clustering approach to wireless network intrusion detection, in: Tools with Articial Intelligence, 2005. ICTAI 05. 17th IEEE International Conference on, IEEE, 2005, pp. 7pp. [15] F. A. A. Alseiari, Z. Aung, Real-time anomaly-based distributed
intru-sion detection systems for advanced metering infrastructure utilizing stream data mining, in: Smart Grid and Clean Energy Technologies (ICSGCE), 2015 International Conference on, IEEE, 2015, pp. 148153.
[16] D. Wagner, P. Soto, Mimicry attacks on host-based intrusion detection systems, in: Proceedings of the 9th ACM Conference on Computer and Communications Security, ACM, 2002, pp. 255264.
[17] M. Barreno, B. Nelson, R. Sears, A. D. Joseph, J. D. Tygar, Can ma-chine learning be secure?, in: Proceedings of the 2006 ACM Symposium on Information, computer and communications security, ACM, 2006, pp. 1625.
[18] D. Stevanovic, N. Vlajic, Next generation application-layer DDoS defences: applying the concepts of outlier detection in data streams with concept drift, in: Machine Learning and Applications (ICMLA), 2014 13th Inter-national Conference on, IEEE, 2014, pp. 456462.
[19] T.-F. Yen, M. K. Reiter, Trac aggregation for malware detection, in: In-ternational Conference on Detection of Intrusions and Malware, and Vul-nerability Assessment, Springer, 2008, pp. 207227.
[20] S. Garcia, M. Grill, J. Stiborek, A. Zunino, An empirical comparison of botnet detection methods, computers & security 45 (2014) 100123. [21] R. Berthier, D. I. Urbina, A. A. Cárdenas, M. Guerrero, U. Herberg, J. G.
Jetcheva, D. Mashima, J. H. Huh, R. B. Bobba, On the practicality of detecting anomalies with encrypted trac in AMI, in: Smart Grid Com-munications (SmartGridComm), 2014 IEEE International Conference on, IEEE, 2014, pp. 890895.
[22] digitalcorpora.org,M57 patents.
URL http://digitalcorpora.org/corpora/scenarios/ m57-patents-scenario
[23] J. A. Silva, E. R. Faria, R. C. Barros, E. R. Hruschka, A. C. de Carvalho, J. Gama, Data stream clustering: A survey, ACM Computing Surveys (CSUR) 46 (1) (2013) 13.
[24] Y. Chen, L. Tu, Density-based clustering for real-time stream data, in: Pro-ceedings of the 13th ACM SIGKDD international conference on Knowledge discovery and data mining, ACM, 2007, pp. 133142.
[25] K. Udommanetanakit, T. Rakthanmanon, K. Waiyamai, E-stream: Evolution-based technique for stream clustering, Advanced Data Mining and Applications (2007) 605615.
[26] digitalcorpora.org,Nitroba university harassment scenario.
URL http://digitalcorpora.org/corpora/scenarios/ nitroba-university-harassment-scenario
[27] 4SIC,4SICS geek lounge SCADA network capture. URLhttp://www.netresec.com/?page=PCAP4SICS