TM
Workplace
Safety and Health
Injury and Asthma Among Youth
Less Than 20 Years of Age on
Minority Farm Operations in the
United States, 2000
Volume II: Hispanic National Data
DEPARTMENT OF HEALTH AND HUMAN SERVICES Centers for Disease Control and Prevention
Injury and Asthma Among Youth Less Than 20
Years of Age on Minority Farm Operations in the
United States, 2000
Volume II: Hispanic National Data
John R. Myers, Kitty J. Hendricks, Larry A. Layne, and E. Michael Goldcamp
DEPARTMENT OF HEALTH AND HUMAN SERVICES
Centers for Disease Control and Prevention National Institute for Occupational Safety and Health
ii
DISCLAIMER
Mention of the name of any company or product does not constitute endorsement by the National Institute for Occupational Safety and Health. In addition, citations to Web sites do not
constitute NIOSH endorsement of the sponsoring organizations or their programs or products. Furthermore, NIOSH is not responsible for the content of these Web sites.
This document is in the public domain and may be freely copied or reprinted.
To receive documents or other information about occupational safety and health topics, contact NIOSH at
Publications Dissemination, EID
National Institute for Occupational Safety and Health 4676 Columbia Parkway
Cincinnati, OH 45226-1998
Telephone: 1-800-35-NIOSH (1-800-356-4674) Fax: 1-513-533-8573
E-mail: [email protected]
or visit the NIOSH Web site at www.cdc.gov/niosh
DHHS (NIOSH) Publication No. 2006-109
FOREWORD
In 1996, NIOSH began the Childhood Agricultural Injury Prevention Initiative to prevent farm-related injuries to the millions of youth less than 20 years of age who are exposed to agricultural hazards each year. Youth on farms may be exposed to a wide range of work and non-work-related hazards, including falls, all-terrain vehicles (ATVs), and animals. As a place of work and a place of residence, the farm presents unique challenges for injury prevention.
The NIOSH initiative is based on a comprehensive program of surveillance, research, and partnerships. In keeping with the breadth of the Initiative, the following document presents national data for non-fatal youth injuries on Hispanic farms for 2000. These data, drawn from a special survey of minority farm operators across the U.S., indicate that 366 youth were injured on Hispanic farms during 2000. The causes of these injuries included falls, animals, and vehicles such as ATVs. This document, which is the second in a series of four publications, fills a current data need by providing demographic information on youth exposed to these hazards on Hispanic farm operations.
This document is an important step in understanding the magnitude of youth injuries occurring on Hispanic-operated farms in the U.S. We hope this information will serve as a valuable resource to federal, state and local agencies; health and safety professionals; and farm safety advocates in their efforts to develop focused and coordinated strategies to prevent youth injuries on farms.
John Howard, M.D. Director
National Institute for Occupational Safety and Health
Centers for Disease Control and Prevention
Injury and Asthma Among Youth Less Than 20 Years of Age on Minority
Farm Operations in the United States, 2000
Volume II: Hispanic National Data
Contents
Foreword... iii
Acknowledgments ... ix
Public Health Summary ... xi
Section I: The Minority Farm Operator Childhood Agricultural Injury Survey ...1
Introduction...1
Methods ...2
Layout and use of the data tables...7
National highlights for Hispanic farms...10
References...12
Section II: National Demographic, Injury, and Asthma Estimates for Youth Less Than 20 Years of Age on Hispanic Farm Operations...15
Demographic estimates of: Hispanic farms (Table 2.1)...17
All youth (Table 2.2)...17
All working youth (Table 2.3) ...18
Household youth by sex and age (Table 2.4)...19
Household youth by type of farm (Tables 2.5 - 2.7)...19
Household youth by work status (Tables 2.8 - 2.10) ...22
Household youth exposed to riding a horse (Tables 2.11 - 2.13)...24
Household youth exposed to operating an all-terrain vehicle (Tables 2.14 - 2.16) ...25
Household youth exposed to operating a tractor (Tables 2.17 - 2.19) ...27
Estimates of injuries to: All youth by relationship to the farm (Tables 2.20 - 2.22) ...28
All youth by Hispanic origin (Tables 2.23 - 2.25) ...29
All youth by sex and age (Table 2.26) ...30
vi
All youth by type of farm (Tables 2.28 - 2.30) ...31
All youth by type of injury (Tables 2.31 - 2.33) ...33
All youth by body part injured (Tables 2.34 - 2.37) ...34
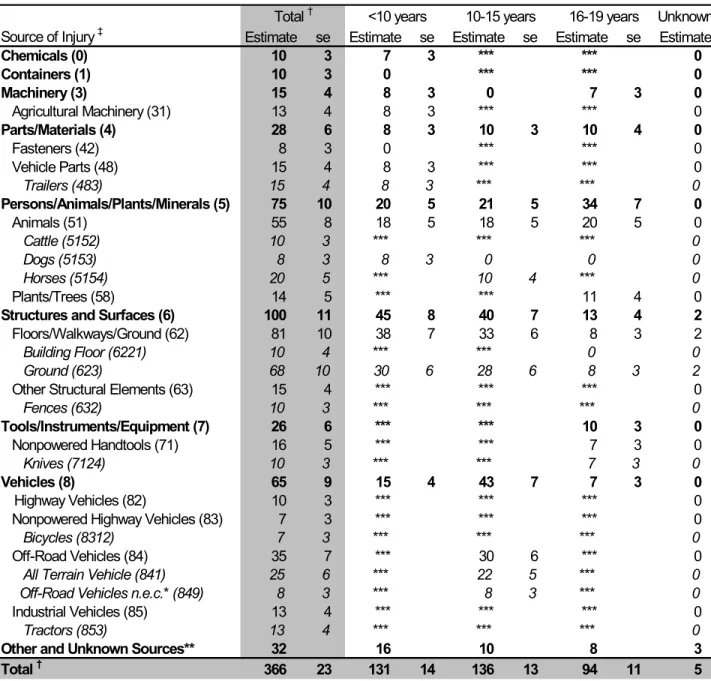
All youth by source of injury (Tables 2.38 - 2.40)...37
All youth by type of injury event (Tables 2.41 - 2.43) ...40
Household youth by sex and age (Table 2.44)...43
Household youth by work status and age (Table 2.45)...43
Household youth by type of farm (Tables 2.46 - 2.48)...44
Household youth by type of injury (Tables 2.49 - 2.51)...45
Household youth by body part injured (Tables 2.52 - 2.55) ...47
Household youth by source of injury (Tables 2.56 - 2.58) ...49
Household youth by type of injury event (Tables 2.59 - 2.61) ...52
Estimates of injury rates for: All youth by work status (Tables 2.62 - 2.67)...55
Household youth by sex and age (Table 2.68)...59
Household youth by work status and age (Table 2.69)...59
Household youth by type of farm (Tables 2.70 - 2.72)...60
Household youth by type of injury (Tables 2.73 - 2.75)...61
Household youth by body part injured (Tables 2.76 - 2.78) ...63
Household youth by source of injury (Tables 2.79 - 2.81) ...65
Household youth by type of injury event (Tables 2.82 - 2.84) ...68
Estimates of asthma among household youth: By sex and age (Tables 2.85 - 2.87)...71
By type of farm (Tables 2.88 - 2.89)...72
With 1 or more asthma attacks while doing farm work (Tables 2.90 - 2.92)...73
With 1 or more asthma attacks requiring professional medical attention (Tables 2.93 - 2.95) ...74
Estimates of asthma prevalence rates for household youth: By sex and age (Table 2.96)...76
By type of farm (Tables 2.97 - 2.98)...76
With 1 or more asthma attacks while doing farm work (Tables 2.99 - 2.101)...77
With 1 or more asthma attacks requiring professional medical attention (Tables 2.102 - 2.104) ...78
Appendix A: Bibliography of NIOSH Childhood Agricultural Injury Articles and Documents ...81
Appendix B: Minority Farm Operator Childhood Agricultural Injury Survey
Questionnaire...89 Appendix C: Definitions Used for the Hispanic Farm Operator Childhood Agricultural Injury Survey ...105 Appendix D: Sampling Estimators Used for the Hispanic Farm Operator Childhood
Acknowledgments
The authors are indebted to Doug Kleweno, Kevin Barnes, Montie Tesky, Joe Samson, and Gail Gregory of the U.S. Department of Agriculture (USDA), National Agricultural Statistics Service (NASS) for their invaluable assistance in the survey design, data collection, data entry, and review of this work; all of the NASS State cooperators who collected these data; Cheryl Paul of the Constella Group for her efforts in completing the layout of the document; and Patricia Ulakovic of NIOSH for her assistance in printing this document.
Public Health Summary
What is the purpose of this document?This document provides previously unavailable youth demographic, injury and asthma estimates at the national level for youth on Hispanic-operated farms in the U.S. A Hispanic is defined as any person of Spanish, Hispanic, or Latino origin. These data represent the initial step in developing research and prevention programs to reduce the burden of injury and asthma on Hispanic farms in the U.S.
What are the hazards?
According to data from the National Institute for Occupational Safety and Health and the U.S. Department of Agriculture, there were 366 estimated youth less than 20 years of age injured on Hispanic farm operations in the U.S. in 2000. Major causes of these injuries included contact with objects and falls. In addition, there were an estimated 1,299 youth with asthma living on these farms. The injury and asthma estimates reported here should be considered conservative because of the potential for recall bias and other biases in the survey.
How are youth exposed or put at risk?
Exposures to farm hazards are not limited to youth who work on farms. In addition to injuries sustained during work activities, youth may be injured while living on farms, while visiting farms, or when they accompany their working parents or adults into the fields. The farm environment also contains many known triggers for asthma. The injury and asthma hazards these youth encounter may be work or non-work in nature, and make the farm a unique environment for developing prevention strategies.
What recommendations have the federal government made to protect the health of farm youth?
The Fair Labor Standards Act of 1938 (FLSA) and its amendments set standards for child labor in agriculture. However, the FLSA covers only employees whose work involves production of agricultural goods, which will leave the state through interstate commerce. In addition, FLSA regulations do not apply to youth working for their parents or guardian(s) on the family’s farm. Youth who work on farms are often not protected by workplace safety and health regulations from the Occupational Safety and Health Administration (OSHA) because these youth frequently work for small operations that are not inspected by OSHA, or because OSHA regulations do not apply to the farm household members. For all youth on farms, there are no protections for injuries from hazards associated with non-work activities, which often expose them to the same hazards as work activities. Given the limited protections for youth on farms, there is a need for states and communities to develop and implement programs to reduce childhood agricultural injuries. Where can more information be found?
Additional NIOSH documents and information on childhood agricultural injuries or other related topics may be obtained by calling the NIOSH toll-free number (1-800-35-NIOSH; 1-800-356-4674) or visiting the NIOSH homepage http://www.cdc.gov/niosh.
Section I: The Minority Farm Operator
Childhood Agricultural Injury Survey
INTRODUCTION
Youth who live on, work on, or visit farms in the United States (U.S.) have been identified as a special population at high risk for non-fatal and fatal injuries [Adekoya and Pratt, 2001; Myers and Hendricks, 2001; Castillo et al., 1999; Rivara, 1997; NCCAIP, 1996]. Since 1996, the National Institute for Occupational Safety and Health (NIOSH) has conducted the Childhood Agricultural Injury Prevention Initiative to promote the reduction of injuries and fatalities to youth on farms in the U.S. [Castillo et al., 1998]. A major component of this initiative is the development of an ongoing surveillance program to track the frequency and incidence of non-fatal injuries and non-fatalities occurring to the various types of youth exposed to farm hazards. An initial step in the development of the surveillance program was the completion of a farm operator survey in 1999. NIOSH collaborated with the U.S. Department of Agriculture (USDA), National Agricultural Statistics Service (NASS) to conduct the Childhood Agricultural Injury Survey (CAIS). The results of this survey were released in 2001, and contained both injury and youth demographic estimates for farms in the U.S. [Myers and Hendricks, 2001]. While the CAIS provided a statistically representative picture of the injury experience of youth on farms in the U.S., it did have some limitations. One major limitation of the CAIS was that it did not adequately cover minority operated farms (i.e., farms operated by racial minorities or operators of Hispanic ethnicity). This is due in large part to the small number of minority farms in operation in the U.S. Based on the 1997 Census of Agriculture, minorities accounted for just 3.3% of the nearly 1.91 million farms in the U.S. that year [USDA, 1999].
To address this limitation, NIOSH, through an Interagency Agreement, again collaborated with USDA, NASS to administer the Minority Farm Operator Childhood Agricultural Injury Survey (M-CAIS) in 2001 by using the 1997 Census of Agriculture sampling frame to identify minority farms. Like the CAIS before it, the M-CAIS provides injury and youth demographic estimates at the national and regional level, but the estimates are specific to minority operated farms in the U.S. In addition to injury information, the M-CAIS provides prevalence information on asthma among youth living on minority farms, which should provide unique information for health professionals working in the area of childhood asthma.
This document presents the national M-CAIS results for Hispanic farm operations in an easily accessible statistical abstract format. A Hispanic farm operation includes farms operated by persons of Spanish, Hispanic, or Latino origin. This document includes injuries to all youth on Hispanic-operated farms regardless of the race or ethnicity of the injured youth (i.e., a non-Hispanic youth who worked and was injured on a non-Hispanic farm would be included in these
2
statistics). Other documents, in a similar format, provide national data for racial minority farm operations, regional data for racial minority farm operations, and regional data for Hispanic farm operations. Due to the quantity of data, no attempt was made to interpret the results presented. A list of NIOSH documents and publications that do provide interpretation of these and other childhood farm injury data is provided in Appendix A. It is hoped that the data presented here will be used by public health and safety professionals, engineers, and other groups working in the area of childhood farm safety and health to help in their intervention programs and injury control research.
The estimates, prevalence rates, and incidence rates presented in this statistical abstract were calculated by NIOSH and are presented with the approval of USDA, NASS. Access to all M-CAIS data files, or additional estimates from the M-M-CAIS data, are subject to the approval of USDA, NASS.
METHODS
General Survey Design: The M-CAIS was conducted for NIOSH by USDA, NASS through an Interagency Agreement. The survey was defined as a census of the 49,270 minority farm
operations identified in the NASS 1997 Census of Agriculture list. A farm was considered to be eligible for M-CAIS regardless of whether youth were on the farm in 2000. This was necessary to allow for meaningful estimates of both injuries and the number of youth on farms for the various youth populations covered in the survey. Because of confidentiality concerns, racial minority farm operators and Hispanic operators were handled independently. This resulted in a certain number of farms being used to calculate both the racial minority estimates and the Hispanic estimates. In other words, individual operators who reported being a racial minority and of Hispanic ethnicity are represented in both sets of estimates. However, farm operators who are non-Hispanic, regardless of their race, are excluded from the Hispanic estimates. Because of this overlap, it is not possible to add racial and Hispanic estimates together.
The survey used a Computer Assisted Telephone Interview (CATI) survey instrument. The interviews were conducted by 10 NASS calling centers between February and March of 2001. The M-CAIS was conducted in these winter months to increase the response rate of the survey. Participation in the survey was strictly voluntary. The survey instrument (Appendix B) used for the M-CAIS was designed to not exceed one-half hour, with an average response time of seven minutes. Definitions used in the questionnaire and throughout this document are provided in Appendix C.
In addition to the main CATI data collection effort, 5 NASS State offices conducted personal interviews with a sample of 2,088 minority operators that were not contacted during the CATI survey period. The two main reasons these farm operators were not contacted during this period were that the operator was not available even upon repeated contact attempts, or that NASS did not have a working telephone number on file. The 5 States that conducted the personal interviews
were Alabama, Arizona, California, New Mexico, and Texas. These States were selected because they had the largest number of minority farm operations. The personal interviews were conducted during April and May of 2001 with the same survey instrument used in the CATI process.
The data collected for M-CAIS were self-reported by either the female or male head of household. If an injury occurred to a household youth 16-years of age or older, and the youth was available to talk to the NASS enumerator, he or she was asked to answer the injury section of the survey. Information such as youth demographics, the occurrence of an injury, and the characteristics of an injury event were subject to the interpretation of the respondent.
For the survey, a farm was defined as any operation with $1,000 or more of gross agricultural production within a calendar year, and included both crop and livestock operations. A youth was defined as any person under the age of 20 years. Household youth were defined as all youth who resided on the farm. Hired youth were defined as youth who were hired directly by the farm operator, excluding contract laborers, to work on the farm, but were not household members. Visitors were defined as all other youth who were on the farm, but were not household members or hired workers.
An injury was defined as any condition that resulted in 4 hours or more of restricted activity (e.g., the individual could not perform work or other normal duties, missed work, and/or missed school), or a condition that required professional medical treatment. While the total number of childhood agricultural injuries was requested for the calendar year 2000, descriptive information was collected only for the four most recent injury events. An agricultural work-related injury was defined as any injury meeting the above definition that occurred while performing work on the farm associated with the farm business, including chores. Non-work injuries were defined as injuries occurring on the farm that were not due to farm work. The survey excluded injuries to contractors working for the farm operation, or injuries that occurred to youth off the farm property. The categorical injury variables of “source of injury” and “event or exposure” were coded from narrative injury descriptions using the Bureau of Labor Statistics Occupational Injury and Illness Classification Manual [USDOL, 1992].
Asthma was assessed for household youth only. A household youth was defined as having asthma only if the condition had been diagnosed by a health professional. An asthma attack at work was defined as any attack that occurred while the youth was doing farm work, and required the use of an inhaler or other medical treatment. A professionally treated asthma attack was defined as any attack that required an emergency room visit, hospitalization, or other professional medical attention, beyond the use of an inhaler. A positive response to either the asthma attack at work or the professionally treated asthma attack question indicated that at least one such attack occurred to the youth during 2000. The actual number of either type of attack was not collected.
Therefore, these asthma statistics are measures of prevalence only. Finally, the two types of asthma attacks are not mutually exclusive. It is possible that an asthma attack incident occurred
4
while the youth was doing farm work and that the youth received professional medical treatment for the same attack.
To facilitate the correct matching of injury estimates to youth at risk, specific demographic terms were used for the various combinations of youth populations in the survey (Table 1.1). In this document, “All youth” refers to the sum of all youth categories covered in the survey (i.e., “Household youth,” “Hired youth,” “Relatives,” and “Non-relatives”). “Visiting youth” refers to the combination of “Relatives” and “Non-relatives” that were on the farm in the year 2000. “All working youth” refers to “Working household youth,” combined with “Hired youth” and
“Working relatives.” Finally, “Non-household working youth” refers to the combination of “Hired youth” and “Working relatives.”
The racial and Hispanic origin classification for the farm operator and all household youth were set to the racial and Hispanic classification provided on the 1997 Census of Agriculture sampling frame. In addition, “Asians” and “Native Hawaiian or Other Pacific Islanders” were combined into a single Asian category for all analyses. “Other races” was defined in the 1997 Census of Agriculture as persons native to or of ancestry from Mexico, the Caribbean, and Central and South America [USDA, 1999].
Table 1.1 Demographic terms and the specific youth populations they represent for all statistical tables presented in Section II.
Estimation Procedures: The estimation procedure for the M-CAIS was developed as a two-step process. The first step involved post-stratifying the CATI and personal interview results to account for farm operators who refused to participate in the survey, or were inaccessible. For the racial minority data, the results were post-stratified by the four farm operator racial categories (Black, Native American, Asian, and “Other”) within the nine U.S. geographic regions defined by the U.S. Bureau of the Census (Table 1.2) [US Department of Commerce, 1975]. For the
Hispanic data, post-stratification was for the nine geographic regions only. Variance estimates for the survey were derived by applying the unbiased estimators for a stratified simple random sample to these post-stratified data [Cochran, 1977]. The estimators for Hispanic population totals and their corresponding variances are presented in Appendix D. The estimators for racial minority totals and variances are provided in Volume I.
Terms
Youth Population All youth
Household youth Visiting youth Relatives All working youth Working non-household youth Household Non-working household youthWorking household youth XX XX X
Non-household
Hired youth X X X
Non-working relatives X X X
Working relatives X X X X X
Table 1.2 U.S. Bureau of the Census Geographic Regions of the U.S.
The second step in the estimation process was benchmarking the post-stratified survey results to the published counts for minority-operated farms released in the 1997 Census of Agriculture. The 1997 Census of Agriculture reported 27,717 Hispanic farms. This number includes imputed values for minority farm operations (i.e., some farm operations without ethnicity data for the operator were classified as Hispanic operations based on characteristics of the farm operation or other factors). Since these imputed values caused the published Hispanic farm count (27,717) to be higher than the sampling frame Hispanic farm count (20,789), the benchmarking process was necessary.
Benchmarking was applied to each of the nine geographic regions. Because benchmarking changed each post-stratified population total by a constant, it did not change the relative variance of any post-stratified population estimate. Therefore, the relative variances from the
non-benchmarked post-stratified estimates were used to derive the standard errors for all non-benchmarked population estimates. The equations used to derive benchmarked Hispanic population estimates and variances are provided in Appendix D. The benchmark equations for racial minority
population estimates and variances are provided in Volume I.
Incidence and Prevalence Rate Estimates: The injury incidence rates were calculated as the estimated number of injuries at the national level, divided by the appropriate youth estimate at the national level. For work-related injury rates, only working household and working
non-household youth were included in the denominator. For non-work-related injury rates, all youth were included in the denominator because it was assumed that all youth could sustain a non-work injury. The overall household youth asthma prevalence rate and the prevalence rate for
professionally treated asthma attacks used all household youth as the denominator. The
4 Regions 9 Regions
Northeast New England: Connecticut, Maine, Massachusetts, New Hampshire Rhode Island, Vermont
Mid-Atlantic: New Jersey, New York, Pennsylvania
Mid-West East North Central: Illinois, Indiana, Michigan, Ohio, Wisconsin
West North Central: Iowa,Kansas, Minnesota, Missouri, Nebraska North Dakota, South Dakota
South South Atlantic: Delaware, Florida, Georgia, Maryland, North Carolina, South Carolina, Virginia, West Virginia
East South Central: Alabama, Kentucky, Mississippi, Tennessee
West South Central: Arkansas, Louisiana, Oklahoma, Texas
West Mountain: Arizona, Colorado, Idaho, Montana, Nevada, New Mexico, Utah, Wyoming
6
prevalence rate for asthma attacks while doing farm work used only working household youth in the denominator. All rates are expressed in terms of 1,000 youth potentially exposed.
The variance calculations for the population-based incidence or prevalence rates were estimated using the linear combination of variances for the injury or asthma estimate and the youth estimate as described by Cochran [1977] (Appendix D).
Categorical Frequency Estimates: The frequency estimates for categorical variables from the M-CAIS were based on three types of information: demographic, injury, and asthma.
Demographic data included an estimate of household youth, the number of hired youth, and the number of visiting youth for the calendar year 2000. For household youth, estimates by sex, age, and various types of exposure information (e.g., working on the farm, riding a horse) were also calculated. Injury data included information such as whether an injury was work-related or not, the nature of the injury, the source of the injury, the event or exposure leading to the injury, and the body part injured. This information was only collected for the four most recent injuries that occurred on a farm. Asthma data were collected for household youth only, and included
prevalence estimates for youth with asthma, youth with at least one asthma attack while doing farm work in 2000, and youth who required professional medical treatment for an asthma attack in 2000.
Frequency tables for the various categories are presented at differing levels of detail because of differing levels of sampling error and minimum case requirements between the various estimates. In all instances, an estimate was required to have 3 or more farms with a non-zero value to be reportable. This was the only restriction placed on injury or asthma estimates from the M-CAIS. Youth estimates were further restricted if the relative standard error of an estimate exceeded 34%. For some tables, youth estimates are reported with relative standard errors above 34% because they were deemed critical to the interpretation of the frequency table. However, no youth
estimate is reported with a relative standard error greater than 50%. If an injury or youth estimate was censored because of either of these two criteria, a series of other cells within the table were also censored to prevent obtaining restricted data through subtraction. Where possible, these secondary censored values were targeted at broader categories within a table.
Survey Limitations: There are several limitations to the results presented in this report. The first limitation is the NASS census sampling frame used for the survey. The 1997 Census of
Agriculture list does not account for new minority farming operations that were established after 1997. In addition, some minority farm operators may have been left out of the sample because the operator self-selected themselves into non-minority categories for race or ethnicity in the 1997 Census of Agriculture. The extent of self-misclassification in the 1997 Census of Agriculture is unknown. A second limitation is that the recall period for an injury or asthma attack in this survey was up to 15 months. While the definition of an injury or asthma attack was for more severe cases, which may be easier to recall, there is still the possibility that a reportable injury or asthma attack was not remembered by a respondent. A third limitation is that most surveys were
conducted with the female head of household, which may have resulted in an under-reporting of hired youth injuries, especially for larger farming operations with many employees. Fourth, there was no way to verify the accuracy or completeness of the responses given in this survey, which could impart some response bias into the overall results. Fifth, this survey did not include injuries which occurred to youth contract farm workers. Injuries to contract farm workers are being assessed through a separate NIOSH study, and will be provided in a separate report.
A final limitation is the possibility of a bias because of non-response to the telephone survey. Due to the survey design, it was not possible to make a second contact to farm operators who refused to participate in the survey. This did not allow for a follow-back questionnaire to assess these refusals. For non-response due to inaccessibility, the inclusion of 2,088 personal interviews did improve the coverage, but did not eliminate all bias. The post-stratification of the M-CAIS results greatly reduced the impact of the non-response bias.
LAYOUT AND USE OF THE DATA TABLES
The data tables contained within this document are designed to provide the user as much informa-tion as possible. However, as with all such documents, the tables are subject to the usual limita-tions of 2-way or 3-way classification tables, as well as the limitalimita-tions imposed by printing space. Because of this, no percentages are provided in any of the frequency tables. Rather, the reader is provided the grand total and marginal totals in each table, except for values that are suppressed for reasons of confidentiality.
Frequency Table Layout: Frequency tables generally follow a common layout (Table 1.3). The grand total, A, is displayed as the bottom left data cell. Marginal totals, B, are displayed in the far left data column, and in the bottom row. The grand total and marginal totals are typically shaded in gray. The 2-way variable estimates, C, are presented in the non-highlighted body of the table. The standard errors a, b, and c are provided immediately next to each corresponding estimate. In addition to the typical row or column marginal values, certain tables may also contain major group, subgroup, and detailed values. Major group and subgroup values occur on most tables involving “Age” and “Type of farming operation.” Detailed values are associated with most tables involving “Relationship to the farm,” “Source of injury,” and “Type of injury event.” A major group represents a broad grouping of values for a particular variable, while the subgroup represents either individual values for the variable, or smaller groupings of values for the variable. Detailed values represent the most detailed estimate possible for the specific variable. Major groups are shown in bolded text, while subgroups are shown as indented, non-bolded text beneath major group entries. Detailed entries are provided in indented, italicized text beneath subgroup entries.
8
The following is an example of this layout for the variable “Age,” using Table 2.4 on page 19. The major groups for age in the document are “<10 years,” “10-15 years,” “16-19 years,” and “Unknown.” In addition to these 4 major age groups, 5 age subgroups exist. Under the major group “10-15 years,” there are three subgroups: “10-11 years,” “12-13 years,” and “14-15 years.” For the major group “16-19 years,” there are two subgroups: “16-17 years” and “18-19 years.” The major groups “<10 years” and “Unknown” have no subgroups.
Collapsed categories: Because of reporting restrictions, not all values may be reported in a table (see discussion of reporting requirements under “Categorical Frequency Estimates” in the Meth-ods section, page 6). In this document, a non-reportable cell is denoted in a table as “***.” In some circumstances, values for a variable may be collapsed into a broader category. For example, in Table 2.2, page 17, the subgroup farm types of "Aquaculture" and "Other livestock" farms are collapsed into a single broad category, “All other livestock” farms. Collapsed categories for most variables are footnoted in individual tables. Standard error estimates for these collapsed catego-ries are not provided in the document.
Calculating Percentages within Frequency Tables: Percentage distributions from these tables may be calculated at the table level, row marginal level, column marginal level, and for subgroups within major groups. Using the notation from Table 1.3, table level percentages (T%) can be obtained by dividing any table entry B or C, by the grand table total A. Using Table 2.4 as an example, the table level percentage for household youth less than 10 years of age is:
T% household youth <10 years = (6,015/17,998)(100) = 33.4%,
meaning 33.4 percent of all household youth are less than 10 years of age. Similarly, the table Table 1.3 General layout of data tables in Section II. “A” represents the grand table total, “B” the marginal totals, and “C” the two-way variable estimates within the table. The values “a,” “b,” and “c” are the corresponding standard error estimates of “A,” “B,” and “C.” Bold table entries denote major group estimates for variables, non-bolded entries denote subgroup estimates for variables, and italicized entries denote a detailed estimate for a variable.
Total †
Variable 1 major group
Variable 1
major group Unknown Variable 2 Estimate se Estimate se Estimate se Estimate
Variable 2 major group B b C c C c C
Variable 2 subgroup B b C c C c C
Variable 2 detailed B b C c C c C
Variable 2 major group B b C c C c C
Variable 2 subgroup B b C c C c C
Variable 2 detailed B b C c C c C
Unknown B b C c C c C
Total † A a B b B b B
level percentage for household males less than 10 years of age is:
T% household males <10 years = (3,124/17,998)(100) = 17.4%, meaning 17.4 percent of all household youth are males below the age of 10 years.
The row marginal percentages (RM%) involve dividing values of C by the corresponding row marginal total, B. Using Table 2.4 again, the row marginal percentage for household males less than 10 years of age is:
RM% household males <10 years = (3,124/6,015)(100) = 51.9%, meaning 51.9 percent of all household youth less than 10 years of age are male.
Using the same approach, the column marginal percentage (CM%) for males less than 10 years of age from Table 2.4 is:
CM% household males <10 years = (3,124/9,235)(100) = 33.8%, meaning 33.8 percent of all household males are less than 10 years of age.
When looking at tables with major groups and subgroups, the T% values of the row or column major group marginal cells will add to 100%, except for rounding. The T% values for the row or column subgroup marginal cells will add to the corresponding major group percentage they are beneath, except where subgroup values are suppressed. Using a similar logic, percentages may also be derived for subgroup values within major groups. For example, from Table 2.4, the per-centage of household youth 10-11 years of age out of all household youth 10-15 years of age is (1,894/6,589)*100, or 28.7 percent.
Rate Table Layout: The layout for rate tables in this document is similar to that for frequency tables. Rates are provided for the grand total, row marginal values, column marginal values, and where appropriate, the 2-way table values (see “Incidence and Prevalence Rate Estimates” on page 5 of the Methods section for a discussion of how rates were derived). As with frequency tables, standard errors are not provided for rates involving collapsed cells.
Comparison to Other Public Health Data: Readers are asked to use care in comparing the results provided in this document to those reported from other public health data sets. Readers should review carefully the definitions, methods, and limitations presented in this document before making comparisons to other published reports, or studies.
The data provided in this document are derived using statistical weights, and are reported with standard errors. Confidence intervals can be calculated for any level of confidence by multiplying
10
the standard error by the appropriate value of “t” from the Students-t distribution (e.g., 1.96 for a 95% confidence interval). It is important that comparisons to other published reports or data take these standard errors or confidence intervals into account.
NATIONAL HIGHLIGHTSFORHISPANIC FARMS
The following is an overview of the national results of the M-CAIS for Hispanic farm operations. Detailed results with standard errors (se) are presented in Section II.
Survey Response: A total of 49,270 minority farm operations were identified in the 1997 Census of Agriculture sampling list. The number of Hispanic operations identified by the list was 20,789. Of all eligible farms, 36,424 were contacted either by telephone or by a NASS field enumerator. The remaining 12,846 eligible farms were inaccessible. Of the 36,424 farms that were contacted, 9,254 refused to participate, for a responding farm count of 27,170. This resulted in an overall adjusted M-CAIS response rate of 74.6%. The number of Hispanic farms among the respondents was 10,862. These 10,862 were weighted to the 20,789 Hispanic farms on the NASS sampling list and then benchmarked to the 27,717 Hispanic farms published in the 1997 Census of Agriculture (see Estimation Procedures on page 4 for more information).
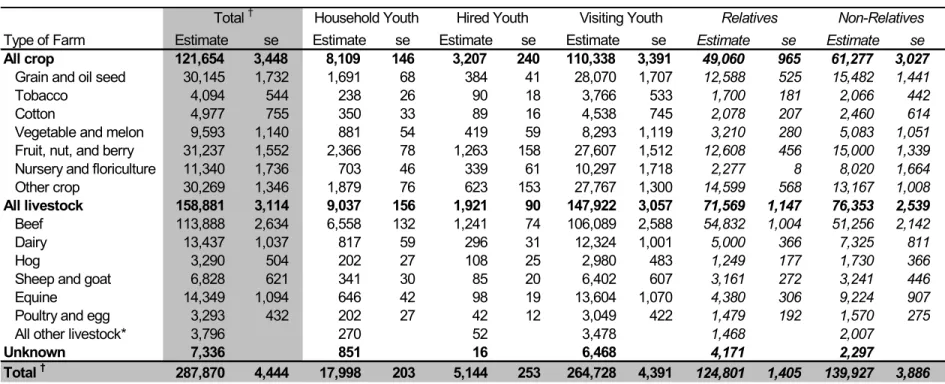
Youth Demographics: There were an estimated 287,870 (±4,444) youth under the age of 20 years who lived on, worked on, or visited a Hispanic-operated farm in 2000. Youth living in the farm household accounted for an estimated 17,998 (±203) youth. Youth hired directly by the farm accounted for 5,144 (±253) youth and an estimated 264,728 (±4,391) youth were visitors to the farm. Relatives accounted for 124,801 (±1,405) of these visitors. Livestock operations had the greatest number of youth on the farm in 2000 (158,881 ±3,114) with crop operations having an estimated 121,654 (±3,448) youth on their operations.
There were an estimated 22,850 (±416) youth under the age of 20 years who did work on Hispanic-operated farms in 2000. These included household youth who performed work on the farm, youth hired directly by the farm, and any non-household relatives who worked on the farm. Livestock operations accounted for the most working youth (13,038 ±302). Crop operations accounted for an additional 9,360 (±304) working youth.
Of the 17,998 youth less than 20 years of age living on Hispanic-operated farms, 9,235 (±203) were males and 8,400 (±122) were females. There were 6,015 (±114) household youth under the age of 10 years, 6,589 (±105) between the ages of 10 and 15 years, and 4,969 (±86) between the ages of 16 and 19 years. A total of 7,921 (±131) household youth on all Hispanic farms did farm work during 2000. Also during that year, 5,331 (±115) household youth were reported to have ridden a horse for either work or recreation, 4,871 (±101) operated an ATV for work or recreation, and 4,412 (±90) youth were said to have operated a tractor on the farm.
Injuries to All Youth: There were an estimated 366 (±23) youth injuries on Hispanic-operated farms in 2000. Of these injuries, 140 (±14) were work-related and 226 (±18) were non-work-related. The work-related injury rate for all youth was 6.1 per 1,000 working youth (±0.6), while the non-work-related injury rate was 0.8 injuries per 1,000 youth (±0.1). Household youth accounted for the highest number of injuries (259 ±20), followed by relatives (58 ±9), visitors that were not relatives (33 ±7), and hired workers (17 ±5). Most injuries occurred to males (262 ±19). Youth less than 10 years of age had the highest number of injuries (131 ±14), followed by youth 16 and 17 years of age (71 ±9). For work-related injuries, the highest number occurred to youth 16 to 19 years of age (67 ±9), followed by youth 14 and 15 years of age (27 ±6).
The most common source of injury for all youth on Hispanic farms was structures and surfaces. This source, which includes the ground, floors, and fences, accounted for 100 (±11) of the injuries. The most common type of injury event was a fall (96 ±11), while 95 (±11) injuries were the result of contact with an object. The parts of the body most commonly injured were the leg (58 ±9); arm (56 ±8); or the hand, wrist, and finger (54 ±8). Injuries most frequently resulted in cuts (86 ±11) or fractures (70 ±9).
When examined by type of farm, 234 (±19) of the injuries to youth occurred on livestock operations, while 127 (±14) injuries to youth were reported on crop farms. Beef operations had the highest number of youth injuries (141 ±14), followed by grain and oil seed farms (47 ±9). Although livestock operations experienced the majority of injuries, the difference in injury rates for livestock and crop operations was small: livestock operations had an injury rate of 1.5 per 1,000 youth (±0.1) compared to 1.0 per 1,000 youth (±0.1) on crop operations.
Injuries to Household Youth: There were 259 (±20) household youth injuries on Hispanic farms in 2000. The injury rate for household youth on Hispanic-operated farms was 14.4/1,000 household youth (±1.1). Males accounted for 188 (±16) of these injuries, while 71 (±10) were to females. The rate of injury for males was 20.3 per 1,000 household youth (±1.8), which was more than twice the injury rate for females (8.5 per 1,000 household youth ±1.2). Household youth less than 10 years of age were estimated to have the highest number of injuries (84 ±11), followed by household youth age 14 and 15 years (57 ±9), and household youth 16 and 17 years of age (46 ±8).
There were 114 (±12) work-related injuries to household youth on Hispanic farms, for a
corresponding work-related injury rate of 14.3 per 1,000 working household youth (±1.6). The highest number of these work-related injuries were found for household youth 16 to 19 years of age (48 ±8). The age group with the highest work-related injury rate among household youth was 16 to 19 years of age (16/1,000 working household youth ±2.6), followed by youth 14 and 15 years of age (14.9/1,000 working household youth ±3.6).
As was seen for all youth, household youth on livestock operations reported the most injuries (162 ±15), followed by crop operations (92 ±12). By specific type of farm, beef operations had the
12
highest number of youth injuries (90 ±11), followed by grain and oil seed operations (38 ±8). Unlike the injury rates seen for all youth where the injury rates for livestock and crop operations were similar, household youth on livestock operations had an injury rate one and one-half times that of those on crop operations (17.9 per 1,000 household youth ±1.7 and 11.3 per 1,000 household youth ±1.5, respectively). Household youth on sheep and goat operations had the highest injury rate (74.9 per 1,000 household youth ±20.8). This rate was more than five times the overall rate for household youth. Other types of farms that had an injury rate higher than 20 injuries per 1,000 household youth were: equine operations (34.6 ±8.9) and grain and oil seed operations (22.4 ±4.8).
The most common source of injury for youth living on Hispanic-operated farms was structures and surfaces (62 ±8). Contact with objects were the most common injury event (71 ±9), followed by falls (65 ±9). The parts of the body most commonly injured were the leg (43 ±7); the hand, wrist, and finger (41 ±7); the arm (38 ±7); or the foot, ankle, and toe (38 ±7). Injuries most frequently resulted in cuts (63 ±9) or fractures (49 ±8).
Asthma Among Household Youth: An estimated 1,299 (±44) household youth living on Hispanic farm operations were reported as having been diagnosed with asthma. Of these youth, 403 (±25) reportedly experienced at least one asthma attack while doing farm work during 2000, while 250 (±18) experienced at least one asthma attack serious enough to require professional medical attention. The overall asthma prevalence rate for these household youth was 72 cases per 1,000 household youth (±2.6). Males had a higher prevalence rate at 86 cases per 1,000
household youth (±3.8), while females had a prevalence rate of 60 cases per 1,000 household youth (±3.1).
The number of household youth reported to have asthma was somewhat higher on livestock operations (665 cases ±32) than on crop farms (584 cases ±30). The prevalence rates, however, were statistcally identical for livestock and crop operations (74 cases/1,000 household youth ±3.7 and 72 cases/1,000 household youth ±3.9, respectively). The number of household youth who reportedly experienced one or more asthma attacks while doing farm work during 2000 was also higher on livestock operations (206 youth with work-related attacks ±18) than on crop farms (179 youth with work-related attacks ±17). However, crop farms had the highest rate of household youth with one or more asthma attacks while doing farm work (57 youth with work-related attacks/1,000 working household youth ±5.6) when compared to livestock operations (45 youth with work-related attacks/1,000 household youth ±4).
REFERENCES
Adekoya N, Pratt SG [2001]. Fatal unintentional farm injuries among persons less than 20 years of age in the United States: geographic profiles. Cincinnati, OH: U.S. Department of Health and Human Services, Public Health Service, Centers for Disease Control and
Prevention, National Institute for Occupational Safety and Health, DHHS (NIOSH) Publication No. 2001-131
Castillo DN, Hard DL, Myers JR, Pizatella T, Stout NA [1998]. A national childhood agricultural injury prevention initiative. J Agric Saf Health, Special Issue (1):183-191.
Castillo DN, Adekoya N, Myers JR [1999]. Fatal work-related injuries in the agricultural production and services sectors among youth in the United States. J Agromedicine, 6(3):27-42.
Cochran WG [1977]. Sampling techniques, 3rd ed. New York, NY: J Wiley and Sons. Myers JR, Hendricks KJ [2001]. Injuries among youth on farms in the United States, 1998.
Cincinnati, OH: U.S. Department of Health and Human Services, Public Health Service, Centers for Disease Control and Prevention, National Institute for Occupational Safety and Health, DHHS (NIOSH) Publication No. 2001-154.
NCCAIP [1996]. Children and agriculture: opportunities for safety and health–a national action plan. Marshfield, WI: National Committee for Childhood Agricultural Injury Prevention.
Rivara F [1997]. Fatal and nonfatal farm injuries to children and adolescents in the United States, 1990-1993. Inj Prev3:190-194.
USDA [1999]. 1997 Census of agriculture United States summary and State data, volume 1, geographic area series, part 51. Washington, DC: U.S. Department of Agriculture, National Agricultural Statistics Service.
USDOL [1992]. Occupational injury and illness classification manual. Washington, DC: U.S. Department of Labor, Bureau of Labor Statistics.
US Department of Commerce [1975]. The methods and materials of demography: vol. I. Washington, DC: Shryock, Siegal, and Associates.
Section II: National Demographic, Injury, and Asthma
Estimates for Youth Less Than 20 Years of Age on Hispanic
Table 2.1 National estimate of Hispanic farms from the 1997 Census of Agriculture by business status, 2000
† Estimates may not add to the total because of rounding.
Table 2.2 National estimates of all youth less than 20 years of age on Hispanic farms by relationship to the farm and type of farm, 2000
† Estimates may not add to the total because of rounding.
* All other livestock includes "Aquaculture" and "Other livestock" farms.
Status Estimate se
In business 24,513 59
Out of business 3,205 59
Total † 27,717
Total
Type of Farm Estimate se Estimate se Estimate se Estimate se Estimate se Estimate se
All crop 121,654 3,448 8,109 146 3,207 240 110,338 3,391 49,060 965 61,277 3,027
Grain and oil seed 30,145 1,732 1,691 68 384 41 28,070 1,707 12,588 525 15,482 1,441
Tobacco 4,094 544 238 26 90 18 3,766 533 1,700 181 2,066 442
Cotton 4,977 755 350 33 89 16 4,538 745 2,078 207 2,460 614
Vegetable and melon 9,593 1,140 881 54 419 59 8,293 1,119 3,210 280 5,083 1,051 Fruit, nut, and berry 31,237 1,552 2,366 78 1,263 158 27,607 1,512 12,608 456 15,000 1,339 Nursery and floriculture 11,340 1,736 703 46 339 61 10,297 1,718 2,277 8 8,020 1,664 Other crop 30,269 1,346 1,879 76 623 153 27,767 1,300 14,599 568 13,167 1,008
All livestock 158,881 3,114 9,037 156 1,921 90 147,922 3,057 71,569 1,147 76,353 2,539
Beef 113,888 2,634 6,558 132 1,241 74 106,089 2,588 54,832 1,004 51,256 2,142
Dairy 13,437 1,037 817 59 296 31 12,324 1,001 5,000 366 7,325 811
Hog 3,290 504 202 27 108 25 2,980 483 1,249 177 1,730 366
Sheep and goat 6,828 621 341 30 85 20 6,402 607 3,161 272 3,241 446
Equine 14,349 1,094 646 42 98 19 13,604 1,070 4,380 306 9,224 907
Poultry and egg 3,293 432 202 27 42 12 3,049 422 1,479 192 1,570 275
All other livestock* 3,796 270 52 3,478 1,468 2,007
Unknown 7,336 851 16 6,468 4,171 2,297
Total † 287,870 4,444 17,998 203 5,144 253 264,728 4,391 124,801 1,405 139,927 3,886
Table 2.3 National estimates of all working youth less than 20 years of age on Hispanic farms by relationship to the farm and type of farm, 2000
† Estimates may not add to the total because of rounding.
* All other livestock includes "Aquaculture" and "Other livestock" farms.
Type of Farm Estimate se Estimate se Estimate se Estimate se Estimate se
All crop 9,360 304 3,154 84 6,207 280 3,207 240 3,000 141
Grain and oil seed 1,790 93 814 44 976 76 384 41 592 61
Tobacco 301 36 112 17 190 28 90 18 100 22
Cotton 300 33 116 15 184 28 89 16 95 18
Vegetable and melon 1,027 93 305 28 723 84 419 59 304 52
Fruit, nut, and berry 2,809 187 750 40 2,059 177 1,263 158 796 77
Nursery and floriculture 622 72 185 21 437 64 339 61 98 17
Other crop 2,509 189 872 45 1,637 174 623 153 1,015 82
All livestock 13,038 302 4,590 105 8,448 269 1,921 90 6,526 246
Beef 9,335 245 3,125 85 6,211 216 1,241 74 4,970 197
Dairy 1,382 128 511 43 871 114 296 31 575 105
Hog 347 51 138 20 209 44 108 25 101 31
Sheep and goat 568 84 224 24 344 77 85 20 259 74
Equine 893 74 377 31 516 62 98 19 418 58
Poultry and egg 281 41 116 20 165 31 42 12 123 27
All other livestock* 231 99 132 52 81
Unknown 452 178 274 16 258 Total † 22,850 416 7,921 131 14,928 383 5,144 253 9,784 283 Total † Working Household Youth Working
Non-Household Youth Hired Youth Working Relatives
Table 2.4 National estimates of household youth less than 20 years of age on Hispanic farms by sex and age, 2000
† Estimates may not add to the total because of rounding.
Table 2.5 National estimates of household youth less than 20 years of age on Hispanic farms by sex and type of farm, 2000
† Estimates may not add to the total because of rounding.
* All other livestock includes "Aquaculture" and "Other livestock" farms.
Unknown
Age Estimate se Estimate se Estimate se Estimate
<10 years 6,015 114 3,124 73 2,886 69 5 10-15 years 6,589 105 3,349 70 3,236 69 5 10-11 years 1,894 48 1,031 36 861 33 3 12-13 years 2,232 52 1,141 37 1,088 37 3 14-15 years 2,463 56 1,177 39 1,286 40 0 16-19 years 4,969 86 2,704 61 2,260 56 5 16-17 years 2,818 59 1,492 44 1,323 41 3 18-19 years 2,151 52 1,212 39 937 34 3 Unknown 425 58 18 349 Total † 17,998 203 9,235 129 8,400 122 364
Total † Male Female
Unknown Type of Farm Estimate se Estimate se Estimate se Estimate
All crop 8,109 146 4,269 92 3,790 85 51
Grain and oil seed 1,691 68 869 41 819 41 3
Tobacco 238 26 129 17 109 15 0
Cotton 350 33 200 21 150 20 0
Vegetable and melon 881 54 475 35 379 28 27 Fruit, nut, and berry 2,366 78 1,223 49 1,134 45 10 Nursery and floriculture 703 46 323 26 369 28 12 Other crop 1,879 76 1,050 49 830 43 0
All livestock 9,037 156 4,679 96 4,328 93 30
Beef 6,558 132 3,371 80 3,172 79 16
Dairy 817 59 429 35 388 3 0
Hog 202 27 100 17 99 15 3
Sheep and goat 341 30 190 20 146 16 5
Equine 646 42 318 26 321 24 7
Poultry and egg 202 27 119 18 83 14 0 All other livestock* 270 152 119 0
Unknown 851 287 281 282
Total † 17,998 203 9,235 129 8,400 122 364
20
Table 2.6 National estimates of household youth less than 20 years of age on Hispanic farms by age and type of farm, 2000
† Estimates may not add to the total because of rounding.
* All other livestock includes "Aquaculture" and "Other livestock" farms.
Type of Farm Estimate se Estimate se Estimate se Estimate se
All crop 8,109 146 2,805 78 935 33 992 35
Grain and oil seed 1,691 68 537 35 173 15 215 16
Tobacco 238 26 84 15 35 7 36 7
Cotton 350 33 163 20 36 7 43 8
Vegetable and melon 881 54 329 28 95 10 101 11 Fruit, nut, and berry 2,366 78 811 39 323 19 291 18 Nursery and floriculture 703 46 272 25 81 10 77 10 Other crop 1,879 76 610 39 193 16 229 17
All livestock 9,037 156 3,037 85 919 35 1,134 39
Beef 6,558 132 2,282 73 709 31 838 33
Dairy 817 59 275 31 61 9 92 12
Hog 202 27 62 14 26 6 30 6
Sheep and goat 341 30 96 15 21 5 43 8
Equine 646 42 164 18 68 10 74 10
Poultry and egg 202 27 73 13 19 6 27 6 All other livestock* 270 86 15 30
Unknown 851 173 40 107
Total † 17,998 203 6,015 114 1,894 48 2,232 52
Unknown Type of Farm Estimate se Estimate se Estimate se Estimate
All crop 1,134 38 1,190 38 974 35 80
Grain and oil seed 245 17 272 19 225 17 25
Tobacco 25 6 28 6 31 7 0
Cotton 47 18 55 8 8 3 0
Vegetable and melon 115 12 119 12 93 11 29 Fruit, nut, and berry 316 19 308 18 315 19 2 Nursery and floriculture 84 10 112 13 65 9 12 Other crop 304 21 296 19 236 18 11
All livestock 1,256 41 1,539 46 1,104 38 50
Beef 892 35 1,046 38 765 32 28
Dairy 102 13 167 16 120 13 0
Hog 21 5 38 7 23 5 3
Sheep and goat 57 9 76 10 44 8 5
Equine 116 13 113 13 97 12 14
Poultry and egg 19 5 38 7 27 6 0 All other livestock* 50 61 28 0
Unknown 74 89 74 295
Total † 2,463 56 2,818 59 2,151 52 425
14-15 years 16-17 years 18-19 years
Table 2.7 National estimates of household youth less than 20 years of age on Hispanic farms by age, sex, and type of farm, 2000
Unknown Type of Farm Estimate se Estimate se Estimate se Estimate
All crop 2,805 78 1,508 51 1,292 46 5
Grain and oil seed 537 35 298 24 237 24 3
Tobacco 84 15 48 5 36 7 0
Cotton 163 20 90 13 73 12 0
Vegetable and melon 329 28 194 19 135 15 0 Fruit, nut, and berry 811 39 421 25 388 24 2 Nursery and floriculture 272 25 131 15 141 15 0 Other crop 610 39 327 25 284 23 0
All livestock 3,037 85 1,545 53 1,492 51 0
Beef 2,282 73 1,135 45 1,147 44 0
Dairy 275 31 159 20 117 16 0
Hog 62 14 28 7 34 9 0
Sheep and goat 96 15 52 9 44 9 0
Equine 164 18 76 10 88 12 0
Poultry and egg 73 13 43 8 31 8 0
All other livestock* 86 53 33 0
Unknown 173 71 102 0
Total † 6,015 114 3,124 73 2,886 69 5
Unknown Type of Farm Estimate se Estimate se Estimate se Estimate
All crop 3,061 74 1,613 49 1,446 47 2
Grain and oil seed 632 34 309 21 323 23 0
Tobacco 95 14 52 10 43 8 0
Cotton 126 16 74 10 52 9 0
Vegetable and melon 311 24 160 15 151 15 0 Fruit, nut, and berry 930 40 498 28 430 24 2 Nursery and floriculture 242 21 127 14 115 14 0 Other crop 725 39 393 26 332 24 0
All livestock 3,308 78 1,612 50 1,694 51 3
Beef 2,438 67 1,191 43 1,245 44 3
Dairy 255 24 113 15 142 16 0
Hog 76 13 38 8 39 8 0
Sheep and goat 121 16 69 11 52 9 0
Equine 258 23 119 15 139 16 0
Poultry and egg 64 12 35 8 29 7 0
All other livestock* 96 48 48 0
Unknown 220 124 96 0 Total † 6,589 105 3,349 70 3,236 69 5 Continued Total † Male 10-15 years Female <10 years
22
Table 2.7 National estimates of household youth less than 20 years of age on Hispanic farms by age, sex, and type of farm, 2000 (Continued)
† Estimates may not add to the total because of rounding.
* All other livestock includes "Aquaculture" and "Other livestock" farms.
Table 2.8 National estimates of household youth less than 20 years of age on Hispanic farms by work status and sex, 2000
† Estimates may not add to the total because of rounding.
Unknown Type of Farm Estimate se Estimate se Estimate se Estimate
All crop 2,163 57 1,117 39 1,044 37 2
Grain and oil seed 497 28 243 18 254 19 0
Tobacco 59 10 29 6 31 7 0
Cotton 62 9 36 7 26 6 0
Vegetable and melon 212 18 119 14 93 11 0 Fruit, nut, and berry 623 29 304 20 316 20 2 Nursery and floriculture 178 18 65 10 113 13 0 Other crop 533 29 322 22 211 17 0
All livestock 2,643 66 1,504 47 1,136 42 3
Beef 1,810 54 1,033 39 775 35 3
Dairy 287 26 158 18 130 16 0
Hog 61 10 34 8 27 6 0
Sheep and goat 120 14 69 10 51 8 0
Equine 211 19 119 14 92 12 0
Poultry and egg 65 10 41 8 24 6 0
All other livestock* 89 51 38 0
Unknown 163 83 81 0 Total † 4,969 86 2,704 61 2,260 56 5 16-19 years Female Total † Male Unknown
Sex Estimate se Estimate se Estimate se Estimate
Male 9,235 129 4,843 91 4,372 88 20
Female 8,400 122 3,076 74 5,311 96 12
Unknown 364 2 35 327
Total † 17,998 203 7,921 131 9,717 148 360
Table 2.9 National estimates of household youth less than 20 years of age on Hispanic farms by work status and age, 2000
† Estimates may not add to the total because of rounding.
Table 2.10 National estimates of household youth less than 20 years of age on Hispanic farms by age, work status, and sex, 2000
† Estimates may not add to the total because of rounding.
Unknown
Age Estimate se Estimate se Estimate se Estimate
<10 years 6,015 114 1,099 45 4,910 100 5 10-15 years 6,589 105 3,778 80 2,809 68 3 10-11 years 1,894 48 886 33 1,008 35 0 12-13 years 2,232 52 1,282 40 947 35 3 14-15 years 2,463 56 1,610 45 854 33 0 16-19 years 4,969 86 3,010 67 1,944 53 15 16-17 years 2,818 59 1,794 48 1,014 36 10 18-19 years 2,151 52 1,216 39 930 34 5 Unknown 425 34 54 336 Total † 17,998 203 7,921 131 9,717 148 360 Working Non-Working Total † Unknown Sex Estimate se Estimate se Estimate se Estimate
Male 3,124 73 661 32 2,461 64 3
Female 2,886 69 439 25 2,444 62 3
Unknown 5 0 5 0
Total † 6,015 114 1,099 45 4,910 100 5
Unknown Sex Estimate se Estimate se Estimate se Estimate
Male 3,349 70 2,177 57 1,169 41 3
Female 3,236 69 1,601 50 1,635 49 0
Unknown 5 0 5 0
Total † 6,589 105 3,778 80 2,809 68 3
Unknown Sex Estimate se Estimate se Estimate se Estimate
Male 2,704 61 1,979 52 717 32 3 Female 2,260 56 1,031 38 1,222 41 8 Unknown 5 0 5 0 Total † 4,969 86 3,010 67 1,944 53 15 <10 years Total † Working
Total † Working Non-Working
Non-Working Total † Working Non-Working
10-15 years
24
Table 2.11 National estimates of household youth less than 20 years of age on Hispanic farms by whether they rode a horse and sex, 2000
† Estimates may not add to the total because of rounding.
Table 2.12 National estimates of household youth less than 20 years of age on Hispanic farms by whether they rode a horse and age, 2000
† Estimates may not add to the total because of rounding.
Unknown
Sex Estimate se Estimate se Estimate se Estimate
Male 9,235 129 2,675 70 6,535 101 25
Female 8,400 122 2,652 71 5,736 101 12
Unknown 364 5 15 344
Total † 17,998 203 5,331 115 12,285 170 382
Total † Rode a Horse: Yes Rode a Horse: No
Unknown
Age Estimate se Estimate se Estimate se Estimate
<10 years 6,015 114 1,450 53 4,557 99 8 10-15 years 6,589 105 2,331 66 4,253 85 5 10-11 years 1,894 48 697 30 1,194 38 3 12-13 years 2,232 52 721 31 1,509 44 3 14-15 years 2,463 56 914 35 1,550 44 0 16-19 years 4,969 86 1,533 49 3,421 72 15 16-17 years 2,818 59 897 34 1,911 49 10 18-19 years 2,151 52 636 29 1,510 44 5 Unknown 425 17 54 353 Total † 17,998 203 5,331 115 12,285 170 382
Table 2.13 National estimates of household youth less than 20 years of age on Hispanic farms by age, whether they rode a horse, and sex, 2000
† Estimates may not add to the total because of rounding.
Table 2.14 National estimates of household youth less than 20 years of age on Hispanic farms by whether they drove an all-terrain vehicle (ATV) and sex, 2000
† Estimates may not add to the total because of rounding.
Unknown Sex Estimate se Estimate se Estimate se Estimate
Male 3,124 73 723 34 2,396 65 5
Female 2,886 69 727 33 2,156 59 3
Unknown 5 0 5 0
Total † 6,015 114 1,450 53 4,557 99 8
Unknown Sex Estimate se Estimate se Estimate se Estimate
Male 3,349 70 1,106 42 2,238 57 5
Female 3,236 69 1,225 44 2,010 54 0
Unknown 5 0 5 0
Total † 6,589 105 2,331 66 4,253 85 5
Unknown Sex Estimate se Estimate se Estimate se Estimate
Male 2,704 61 836 34 1,860 51 8 Female 2,260 56 697 32 1,556 46 8 Unknown 5 0 5 0 Total † 4,969 86 1,533 49 3,421 72 15 <10 years 10-15 years
Total † Rode a Horse: Yes Rode a Horse: No
16-19 years
Total † Rode a Horse: Yes Rode a Horse: No Total † Rode a Horse: Yes Rode a Horse: No
Unknown
Sex Estimate se Estimate se Estimate se Estimate
Male 9,235 129 2,909 69 5,366 100 960
Female 8,400 122 1,960 58 5,565 100 874
Unknown 364 3 13 349
Total † 17,998 203 4,871 101 10,944 160 2,183
Drove an ATV: No Total † Drove an ATV: Yes
26
Table 2.15 National estimates of household youth less than 20 years of age on Hispanic farms by whether they drove an all-terrain vehicle (ATV) and age, 2000
† Estimates may not add to the total because of rounding.
Table 2.16 National estimates of household youth less than 20 years of age on Hispanic farms by age, whether they drove an all-terrain vehicle (ATV), and sex, 2000
† Estimates may not add to the total because of rounding.
Unknown
Age Estimate se Estimate se Estimate se Estimate
<10 years 6,015 114 595 31 3,686 81 1,735 10-15 years 6,589 105 2,347 63 4,235 87 8 10-11 years 1,894 48 572 27 1,319 41 3 12-13 years 2,232 52 789 32 1,438 43 5 14-15 years 2,463 56 986 36 1,478 44 0 16-19 years 4,969 86 1,930 54 3,024 68 15 16-17 years 2,818 59 1,096 37 1,709 47 13 18-19 years 2,151 52 834 33 1,315 41 2 Unknown 425 0 0 0 Total † 17,998 203 4,871 101 10,944 160 2,183
Total † Drove an ATV: Yes Drove an ATV: No
Unknown Sex Estimate se Estimate se Estimate se Estimate
Male 3,124 73 358 22 1,878 54 889
Female 2,886 69 237 18 1,803 52 846
Unknown 5 0 5 0
Total † 6,015 114 595 31 3,686 81 1,735
Unknown Sex Estimate se Estimate se Estimate se Estimate
Male 3,349 70 1,308 43 2,035 56 5
Female 3,236 69 1,039 40 2,194 57 3
Unknown 5 0 5 0
Total † 6,589 105 2,347 63 4,235 87 8
Unknown Sex Estimate se Estimate se Estimate se Estimate
Male 2,704 61 1,243 41 1,453 47 8 Female 2,260 56 684 31 1,568 47 8 Unknown 5 3 2 0 Total † 4,969 86 1,930 54 3,024 68 15 16-19 years 10-15 years
Total † Drove an ATV: Yes Drove an ATV: No <10 years
Total † Drove an ATV: Yes Drove an ATV: No
Table 2.17 National estimates of household youth less than 20 years of age on Hispanic farms by whether they drove a tractor and sex, 2000
† Estimates may not add to the total because of rounding.
Table 2.18 National estimates of household youth less than 20 years of age on Hispanic farms by whether they drove a tractor and age, 2000
† Estimates may not add to the total because of rounding.
Unknown
Sex Estimate se Estimate se Estimate se Estimate
Male 9,235 129 3,146 18 5,132 94 957
Female 8,400 122 1,265 46 6,260 103 874
Unknown 364 0 15 349
Total † 17,998 203 4,412 90 11,406 156 2,180
Drove a Tractor: No Total † Drove a Tractor: Yes
Unknown
Age Estimate se Estimate se Estimate se Estimate
<10 years 6,015 114 205 18 4,076 85 1,735 10-15 years 6,589 105 1,916 55 4,666 87 8 10-11 years 1,894 48 356 21 1,555 44 3 12-13 years 2,232 52 610 38 1,617 45 5 14-15 years 2,463 56 970 35 1,493 43 0 16-19 years 4,969 86 2,291 58 2,665 62 13 16-17 years 2,818 59 1,249 40 1,559 45 10 18-19 years 2,151 52 1,042 36 1,106 37 2 Unknown 425 0 0 0 Total † 17,998 203 4,412 90 11,406 156 2,180
28
Table 2.19 National estimates of household youth less than 20 years of age on Hispanic farms by age, whether they drove a tractor, and sex, 2000
† Estimates may not add to the total because of rounding.
Table 2.20 National estimates of injuries to all youth less than 20 years of age on Hispanic farms by sex and relationship to the farm, 2000
† Estimates may not add to the total because of rounding.
*** Estimate is not reportable or is suppressed because of a non-reportable cell.
Unknown Sex Estimate se Estimate se Estimate se Estimate
Male 3,124 73 149 16 2,087 56 889
Female 2,886 69 56 9 1,984 55 846
Unknown 5 0 5 0
Total † 6,015 114 205 19 4,076 85 1,735
Unknown Sex Estimate se Estimate se Estimate se Estimate
Male 3,349 70 1,296 43 2,047 55 5
Female 3,236 69 620 30 2,613 61 3
Unknown 5 0 5 0
Total † 6,589 105 1,916 55 4,666 87 8
Unknown Sex Estimate se Estimate se Estimate se Estimate
Male 2,704 61 1,701 49 998 37 5
Female 2,260 56 590 29 1,663 48 8
Unknown 5 0 5 0
Total † 4,969 86 2,291 58 2,665 62 13 <10 years
Total † Drove a Tractor: Yes Drove a Tractor: No
10-15 years
Total † Drove a Tractor: Yes Drove a Tractor: No
16-19 years
Total † Drove a Tractor: Yes Drove a Tractor: No
Relationship to Farm Estimate se Estimate se Estimate se
Household youth 259 20 179 16 71 10 Hired youth 17 5 *** *** Visiting youth 91 11 *** *** Relatives 58 9 41 7 17 4 Non-relatives 33 7 *** *** Total † 366 23 262 19 104 12 Male Total † Female