The content of this paper reflects the views of the author, and does not represent the official views or policies of the Centre for International Finance and Regulation or any of its Consortium members. Information may be incomplete and should not be relied upon without seeking prior professional advice. The Centre for International Finance and Regulation and its Consortium members exclude all liability arising directly or indirectly from use or reliance on the information contained in this publication.
Copyright © 2015
All rights reserved. Working papers are in draft form and are distributed for purposes of comment and discussion only and may not
be reproduced without permission of the copyright holder.
Research Working Paper:
The Use of Active Asset Allocation by
Superannuation Funds
David
Carruthers
Researcher
Acknowledgements:
The
author
would
like
to
thank
in
particular
Geoff
Warren,
David
Gallagher
and
Chris
Durack,
who
formed
the
advisory
team
for
this
project.
WORKING
PAPER
NO.
060/2015
June
2015
Synopsis
The needs of superannuation fund members ultimately relate to generating an adequate income in
retirement. To meet this need, superannuation funds should be aiming to maximise the real returns on
funds invested, while limiting the risk of suffering sustained shortfalls. Indeed, superannuation funds are
required to nominate real return (CPI‐plus) targets. The degree to which they exercise flexibility in
managing towards this objective remains an open question.
Asset allocation as the major determinant of a portfolio’s return is also the biggest risk. Given its
importance, it’s natural to step back and ask what we have collectively learned about asset allocation and
actually put into practice.
This research project examines the extent to which Australian superannuation funds have varied their asset
allocations, both over time and relative to each other. The report details developments in asset allocation
for superannuation funds over the last 20 years, with two key trends identified:
The rise in exposure to alternative assets; and
The impact of dynamic asset allocation policies.
These changes have been adopted almost universally across the industry, and a high degree of
homogeneity of strategy remains evident.
Despite these trends, funds remain anchored to benchmark asset allocations which reflect the long‐term
characteristics of markets, and rely on the long‐term nature of superannuation to allow them to rebound
from negative returns. In particular, funds retain substantial ongoing exposure to growth assets on the
assumption that they will deliver adequate returns over the long haul.
Further, peer risk, a risk that funds can readily control, continues to be afforded undue importance
compared to managing the risk of negative returns. Peer risk sensitivity makes it difficult for funds to
accept lower returns in good years through adopting a more defensive stance, in order to protect capital
and ameliorate exposure to the next market downturn. In essence, the dynamic asset allocation policies
appear to be almost as much about alpha generation as risk reduction.
Funds remain primarily reliant on ‘time diversification’ and rolling 10‐year periods to meet return targets
and mitigate risk. This leaves funds susceptible to capital losses associated with market collapses, such as
the GFC, the unwinding of the 2000 tech bubble, and the stock market crash of 1987.
Background
The importance of asset allocation policy has been recognised at least since Brinson et al. (1986). In their
seminal paper, ”Determinants of Portfolio Performance”, they concluded that “investment policy dominates
investment strategy (market timing and security selection), explaining on average 93.6 per cent of the
variation in total plan return”.
In a paper released around the same time, they introduced the concept of a composite benchmark
portfolio, hoping that “this index should redirect plan sponsor attention toward the total portfolio, and
away from its important, but less critical investment, components.”
In a subsequent paper, Ibbotson and Kaplan (2000) determined that asset allocation explains about 90 per
cent of the variability of a fund’s returns over time, but explains only about 40 per cent of the variation of
returns among funds.
Regardless of the exact proportion, the Global Financial Crisis of 2008 was a timely reminder that the
returns from different asset markets are the dominant determinant of overall fund performance, and can
overwhelm the alpha obtained from active management and security selection.
Early
approaches
to
asset
allocation
–
the
specialist
manager
The commonly‐accepted approach to asset allocation has evolved through time. Perhaps the earliest
investment 'rule' was the Prudent Man rule of 1830, directing trustees "to observe how men of prudence,
discretion and intelligence manage their own affairs, not in regard to speculation, but in regard to the
permanent disposition of their funds, considering the probable income, as well as the probable safety of the
capital to be invested."
In the 1980s, when defined benefit funds were still prevalent, the usual practice was to appoint a single
balanced fund manager. This manager made active asset allocation decisions, whilst also being responsible
for decisions within each asset class. The investor had no direct control over the asset allocation decisions
made by the manager.
Subsequently there was a shift away from outsourcing to balanced fund managers towards investors
setting their own asset allocation, which was implemented by appointing specialist asset class managers.
There were a number of reasons for this shift, including:
It gave the investor the ability to control their asset allocation;
It recognised that no single fund manager was skilled in every asset class, and it was better to
appoint specialist managers for different asset classes; and
It helped limit the agency risk involved in outsourcing the management to an external party
whose interests may not be fully aligned with those of the investor.
Under this approach, a static strategic asset allocation was identified reflecting a ‘policy portfolio’ deemed
to be aligned with long‐term objectives and based on long‐term assumptions. Accepted practice was to
review the policy portfolio infrequently (every 3‐5 years), and not vary the fund's allocation based on the
short‐term market outlook. This approach was largely based on the premise that predicting market
movements is notoriously difficult, and balanced fund managers had been largely unsuccessful in their
attempts to do so.
The introduction of compulsory superannuation in Australia during 1992 accelerated the move away from
very different nature of risks, the early defined contribution fund investment policy portfolios were very
similar to the defined benefit investment policies before them.
Figure 1 tracks the average allocation of the balanced fund managers.
Figure 1: Balanced Fund Managers ‐ Average Actual Asset Allocation, 1989 to 2007
Data Source: Mercer Pooled Fund Survey 1
As can be seen in Figure 1, the asset allocation remained relatively static over this period. The main
changes were:
An increase in growth assets from around 60% in 1989 to around 70% in 2007;
An increase in allocation to overseas shares from around 20% at the start of the period to 25% at
the end;
A decrease in Australian fixed income and cash from a combined 30% to around 20%;
The beginnings of an exposure to alternative assets.
As a result, funds showed an increase in exposure to growth‐type assets and a consequent increase in their
risk exposure.
Dec 1989 Dec 1990 Dec 1991 Dec 1992 Dec 1993 Dec 1994 Dec 1995 Dec 1996 Dec 1997 Dec 1998 Dec 1999 Dec 2000 Dec 2001 Dec 2002 Dec 2003 Dec 2004 Dec 2005 Dec 2006 Dec 2007 0% 10% 20% 30% 40% 50% 60% 70% 80% 90% 100%
Actual Asset Allocations
Growth Funds
Evolution
in
asset
allocation
–
the
rise
of
diversification
As highlighted above, one of the asset allocation trends over the past two decades has been the rise in
alternative assets such as private equity, infrastructure and hedge funds. The key attraction of these types
of assets is that they offer the prospect of return generation unrelated to the traditional asset classes such
as equities and bonds. This not only enhanced diversification, but also offered the hope of adding value
through access to new return premiums (such as illiquidity) and opportunities in less efficient markets.
Diversification into alternative assets was popularised by a number of US endowments and foundations
such as Yale and Harvard. The so‐called Yale Model produced superior returns over the 15 years from 1990
and made the Yale endowment fund the envy of all institutional investors.
Figure 2 plots the asset allocations for growth superannuation fund options, showing the rise of
alternatives.
Figure 2: Growth Superannuation Funds ‐ Average Strategic Asset Allocations, 2006 to 2014
Data Source: Chant West Asset Allocation Survey 2
The main points with respect to the average growth fund allocations are:
The split between growth and defensive assets has remained constant over this period – varying
between 72‐74%.
The allocation to equity assets has decreased marginally – down from 60% at the start of the period
to 53% at the end. The split between domestic and international exposure has remained constant
at around 50/50.
A similar trend has occurred with bond and cash exposure – down to 19% from 23%. Again the split
between Australian and International exposure has remained at 50/50.
Property exposure has remained constant overall; although property with more defensive
characteristics increased slightly while Australian listed property decreased.
The exposure to total alternative assets increased by 10% ‐ up from 8% to 18%.
Figure 3 drills down into the alternative asset allocations. It shows that superannuation funds have more
than doubled their exposure in this area since 2006:
Figure 3: Growth Superannuation Funds ‐ Average Strategic Asset Allocations to Alternatives
Allocation (%) December 2006 December 2010 December 2014
Private Equity 1.4 2.5 2.3 Unlisted Infrastructure 1.2 2.4 2.9 Listed Infrastructure ‐ 0.8 1.1 Hedge funds 1.6 1.9 2.7 Commodities ‐ 0.5 0.3 Other 0.5 2.1 3.2 Growth Alternatives 4.7 10.2 12.5 Debt 0.4 0.4 1.7 Infrastructure 0.7 0.8 1.4 Hedge Funds 1.9 1.7 1.8 Other 0.1 0.8 0.9 Defensive Alternatives 3.1 3.9 5.7 Total Alternatives 7.8 14.1 18.2 Data Source: Chant West Asset Allocation Survey 2
Points to note from Figure 3 include:
Funds are investing in alternatives for their growth and defensive characteristics. Asset classes
such as infrastructure and hedge funds can be classified as either growth or defensive, depending
on the underlying nature of the particular investments. Over the period, between 60‐70% of the
alternative allocation has been categorised as growth.
Infrastructure has experienced the largest increase growing from 1.9% to 5.4%. Over ¼ of the
infrastructure exposure has been categorised by the funds as having defensive rather than growth
characteristics.
The less liquid forms of both equity and debt have increased – with private equity exposure up, and
funds taking a more meaningful exposure to alternate debt.
Hedge funds and commodities have not taken off in Australia, with allocations remaining relatively
small.
Exposure to more 'exotic' alternatives is increasing, with the 'other' category now accounting for
more than 4% of assets.
The introduction of MySuper, and particularly the focus on fees, may inhibit the continued growth of
alternatives. Investment in the more expensive asset classes, such as private equity, can lead to an overall
fund fee that is seen as uncompetitive in the MySuper space.
Peer
comparisons
Despite the increase in diversification within fund allocations, one aspect that has continued is the
substantial homogeneity of allocations across funds. With a few notable exceptions (such as MTAA), the
asset allocations for the growth option are reasonably similar. Even as funds have changed their allocations
over time, the similarities remain.
Figure compares the distribution of allocations to growth assets at December 2014 versus five years earlier.
Figure 4: Growth Superannuation Funds ‐ Average Strategic Asset Allocations to Growth Assets
Data source: Chant West Asset Allocation Survey 2
At December 2009, over 95% of growth funds in this sample had a growth allocation of between 70% and
80%. Five years later, 87% of the funds continued to have a growth allocation in that range. In part, this is
to be expected as a reflection of the sample. Nevertheless, growth funds are the dominant superannuation
product, and form the basis of most MySuper default products (see Chant et al., 2014).
One notable exception is lifecycle products, which form about 20% of MySuper funds. Even in this case,
these funds are managed to a glide path that broadly averages to a growth asset allocation.
The allocation to alternative assets shows slightly more dispersion, with funds ranging from 0% allocation
to alternatives up to almost 30%. 60.00% 62.50% 65.00% 67.50% 70.00% 72.50% 75.00% 77.50% 80.00% 82.50% 0 5 10 15 20 25
Exposure to Growth Assets Growth Funds December 2009 December 2014 Weight N u m b e r o f F u n d s
Figure 5: Growth Superannuation Funds ‐ Average Strategic Asset Allocations to Alternatives Data source: Chant West Asset Allocation Survey 2
In 2009, only 23% of funds had an allocation of more than 20% to alternatives. By 2014, this had risen to
35% of funds. One third of the funds increased their exposure by more than 5% over this period.
The allocation to alternatives varies according to the type of fund, as shown in the chart below. Public
sector funds have had the largest allocation to alternatives, whilst retail funds (which are more concerned
with daily liquidity) have had lower allocations. 0.00% 2.50% 5.00% 7.50% 10.00% 12.50% 15.00% 17.50% 20.00% 22.50% 25.00% 27.50% 27.5%+ 0 1 2 3 4 5 6 7 8 9 10 Alternatives Allocation Growth Funds December 2009 December 2014 weight N u m b e r o f F u n d s
Figure 6: Growth Superannuation Funds ‐ Strategic Average Asset Allocations to Alternatives by Fund Type
Data source: Chant West Asset Allocation Survey 2
The allocation by Australian superannuation funds to alternatives stands at the upper end of exposure on a
global basis. The table below highlights the exposure to 'Other Assets' (assets other than equities, bonds or
cash) in the main countries providing pension investments. Furthermore, the increase in exposure by
Australian funds has seen the largest increase, rising by 16% of assets. Figure 7: Pension Fund Asset Allocation – Other Assets 2004 2009 2014 Australia 10% 25% 26% Canada 13% 20% 22% Japan 2% 4% 7% Netherlands 13% 17% 14% Switzerland 16% 27% 28% United Kingdom 7% 7% 15% United States 16% 25% 29% Data source: Towers Watson Global Pensions Asset Study 3
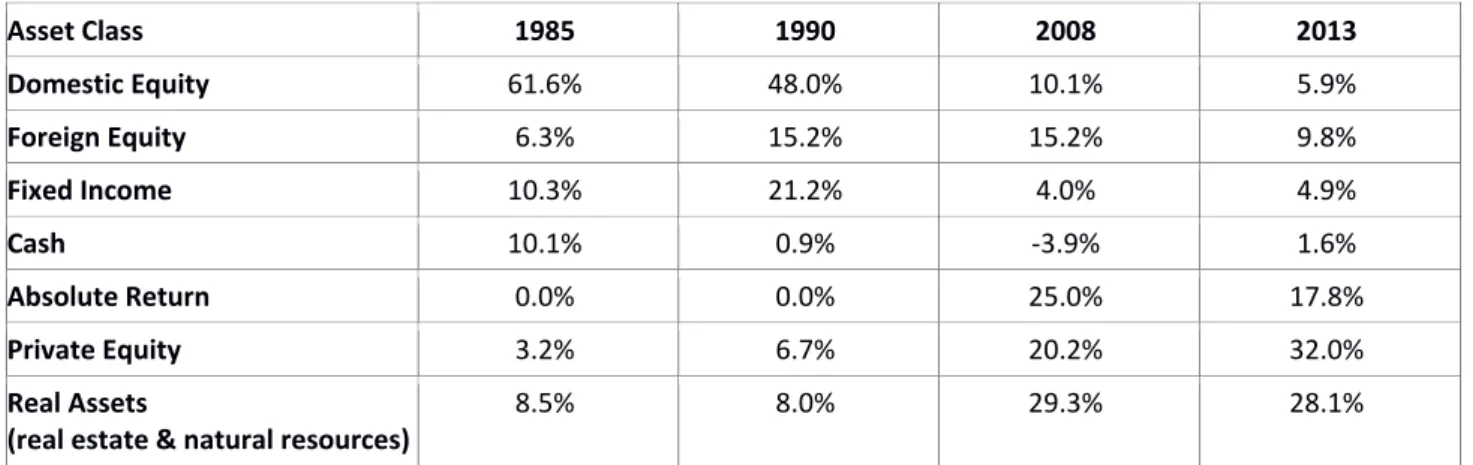
Whilst many Australian superannuation funds adopted significant alternative asset positions, this shift pales
in comparison to Yale Endowment fund. In 1985, Yale's allocations were not too different from a typical
Australian superannuation fund at that time. However, by the time of the Global Financial Crisis, the Yale
portfolio exposure to listed equity assets was only around 35%, and has decreased further since then.
Currently the endowment fund has almost 80% of its investments in alternatives. 2006 2007 2008 2009 2010 2011 2012 2013 2014 0% 5% 10% 15% 20% 25% 30% 35% Alternatives Allocation Growth Funds
Figure 8: Yale Endowment Asset Allocation Asset Class 1985 1990 2008 2013 Domestic Equity 61.6% 48.0% 10.1% 5.9% Foreign Equity 6.3% 15.2% 15.2% 9.8% Fixed Income 10.3% 21.2% 4.0% 4.9% Cash 10.1% 0.9% ‐3.9% 1.6% Absolute Return 0.0% 0.0% 25.0% 17.8% Private Equity 3.2% 6.7% 20.2% 32.0% Real Assets
(real estate & natural resources)
8.5% 8.0% 29.3% 28.1%
Data source: Yale Endowment Fund Annual Reports
The Yale approach is only one alternative, and is not without its own issues. However, it does highlight that
the change in superannuation fund asset allocations over the past two decades has been comparatively
gradual.
Current
approach
to
asset
allocation
–
dynamic
Diversification works in theory and holds up well in practice in most periods. However, traditional
diversification abjectly failed to protect investors during the Global Financial Crisis (GFC). Misunderstanding
the underlying – and interconnected – risk exposures saw many investors unprepared for the magnitude of
losses experienced in 2008/9. A key lesson of the GFC was to seek genuine diversification of underlying
return sources through properly identifying the risks involved, and to spread portfolios across as many
lowly correlated assets as possible. However, it also highlighted how difficult genuine diversification is to
achieve, to the extent that correlations between asset classes can rise during times of market crisis.
The failure of diversification to provide protection when it was most needed resulted in investors
questioning the wisdom of relying solely on long‐term historical averages to determine the appropriate
asset allocation without applying any further judgement regarding the investment outlook.
Over the last five to ten years, superannuation funds have begun implementing more dynamic approaches
to asset allocation ‐ a shift that was given considerable impetus by the GFC. Today, the pursuit of a more
dynamic approach to asset allocation has again become the accepted norm. However, this dynamic
approach takes a medium‐term outlook on markets in contrast to the shorter‐term tactical approach
previously used by balanced fund managers.
This dynamic asset allocation (DAA) process is often implemented as an overlay to the long‐term strategic
asset allocation. Most funds, in addition to the actual strategic weight, will have documented an allowable
range within which each asset class needs to be invested. Historically, this range provided leeway to
rebalance, so that the fund was not making continual small changes in response to market movements to
bring it back in line with the strategic target. However, asset class ranges are now also used to allow the
fund to take active allocation positions within a risk framework.
Interestingly, the capacity to readily implement DAA is in conflict with the trend towards more alternatives,
particularly illiquid alternatives. Whilst products such as futures and swaps are available in liquid markets
to implement a DAA tilt quickly and cheaply, such products don't exist for many of the alternative markets.
This constrains more active DAA approaches to the liquid portions of the portfolio, and requires a more
measured and often extended approach to managing DAA across the entire portfolio.
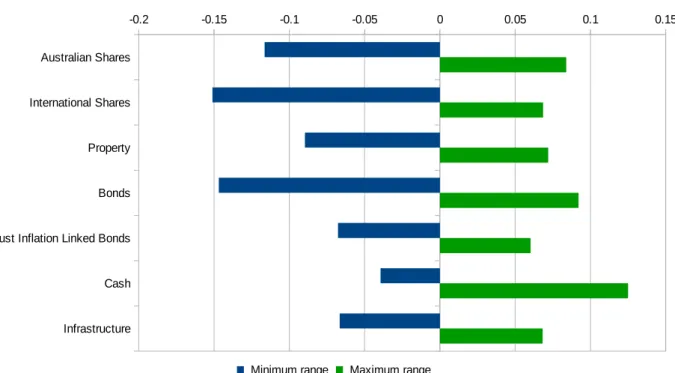
Figure 9: MySuper Growth Funds ‐ Strategic Average Asset Allocation Ranges
Data Source: APRA MySuper Funds 4
Figure 9 shows that the allocation ranges are asymmetric for most asset classes. Funds have greater
flexibility to underweight than overweight most asset classes. International shares is a prime example of
this, where the average fund can go up to 15% underweight their strategic allocation, but only 7%
overweight.
This, in part, reflects that funds are using the allocation flexibility to reduce risk rather than increase return.
Accordingly, there is a greater ability to underweight an asset class when it is overvalued, rather than
overweight an asset class when it is undervalued. Cash (the asset class of choice when other asset classes
are overvalued) is the exception to this rule, with a greater overweight range. Of course the overweights
and underweights must offset each other, so the ranges are also limited to the extent that there is the
ability to take opposite positions in other asset classes.
Whilst funds have the ability to take meaningful tilts away from their chosen benchmark, the degree to
which they have used this flexibility has varied over time. Figure 10 highlights the actual tilts away from the
benchmark.
The tilt at any point in time has been calculated by taking the sum of the absolute deviations away from
benchmark, according to the following formula:
fund tilt = ½ x
Σ
i abs(actual allocationasset(i) – benchmark allocationasset(i))
The sum of the tilts is halved to reflect that an overweight tilt will be offset by an underweight tilt. Figure
10 then plots the average allocation for all the funds through time.
Australian Shares
International Shares
Property
Bonds
Aust Inflation Linked Bonds
Cash
Infrastructure
-0.2 -0.15 -0.1 -0.05 0 0.05 0.1 0.15
Allocation ranges
Figure 10: Growth Superannuation Funds ‐ Average Asset Allocations Tilts Data source: Chant West Asset Allocation Survey 2
Figure 10 shows that, at June 2010, the average growth fund was taking a combined 6% tilt away from their
benchmark – i.e. they were overweight some asset classes by 6% and underweight other asset classes a
corresponding 6%. By the end of 2014, this average tilt had doubled to around 12%. However, even this
tilt is less than ¼ of the maximum tilt that the average fund is capable of taking.
Figure 10 highlights how the average tilt for growth funds has been increasing over time. This masks the
variability of tilts taken by different funds. This is highlighted in Figure 11, which shows the range of tilts
taken by growth funds. For each time period, this chart plots the universe of tilts taken by funds, with the
four quartiles of the results highlighted.
Jun 2010 Dec 2010 Jun 2011 Dec 2011 Jun 2012 Dec 2012 Jun 2013 Dec 2013 Jun 2014 Dec 2014
0% 2% 4% 6% 8% 10% 12% 14%
Asset Allocation tilts
Growth Funds
Figure 11: Growth Superannuation Funds ‐ Asset Allocations Tilts Data source: Chant West Asset Allocation Survey 2
From Figure 11 we can deduce:
For all time periods, at least ¼ of the funds are not taking any significant allocation positions. Given
that market movements can result in a fund diverging from its benchmark, a tilt of less than a few
percent is less likely to be the result of a deliberate overweight or underweight.
The results are skewed upwards, with a small number of funds taking meaningful tilts. In the later
periods, almost ½ of the funds are taking tilts of over 10%.
Note that Figure 11 only includes data from those funds providing both their strategic and actual asset
allocations. Around ¼ of funds don't provide their actual asset allocations, either because they are unable
or unwilling to do so, perhaps for cost reasons, or to keep their activities confidential.
Finally, Figure 12 dissects the tilts by asset class. It highlights within which asset classes the funds have
been taking their tilts.
Jun-10 Dec-10 Jun-11 Dec-11 Mar-12 Jun-12 Sep-12 Dec-12 Mar-13 Jun-13 Sep-13 Dec-13 Mar-14 Jun-14 Sep-14 Dec-14 0% 2% 4% 6% 8% 10% 12% 14% 16%
Asset Allocation Tilts
Growth Funds Upper Quartile 2nd Quartile 3rd Quartile Lower Quartile T il t
Figure 12: Growth Superannuation Funds ‐ Asset Allocations Tilts by Asset Class
Data source: Chant West Asset Allocation Survey 2
Figure 12 highlights that:
By far, equities dominate the tilt positions. The fact that funds are more willing to take active
positions within equities reflects the influence that they have over portfolio outcomes (where
equity volatility dominates), coupled with the ability to readily implement equity tilts.
The equity tilts include any currency positions that the funds are taking with respect to
international equities. Interestingly, around one‐third of the total tilt is accounted for by a hedging
position in respect of the international equities exposure.
Cash, as the asset class of choice when all other assets are overvalued, accounts for the next
highest tilts.
Active tilting towards or away from bonds is much less significant.
Tilts in the other asset classes will often result from operational reasons, particularly the long lags
that can be involved in implementing a change in position in illiquid alternatives. For example, a
fund may be underweight infrastructure as they search for investments to buy.
Considering the equity tilts in more detail, Figure 13 analyses the net tilts to/away from equity – e.g. an
underweight to Australian equity of 5% and an overweight to Global equity of 10% would result in a net
+5% tilt to equity.
An overweight position in equities will normally be a return seeking position. Conversely, a net
underweight position in equities may be a risk reduction position rather than just seeking to gain alpha
from an expected fall in equity markets.
Alternatives Bond Cash Equity Hedge Funds Infrastructure Other Private Equity Real Estate
0% 1% 2% 3% 4% 5% 6%
Asset Allocation Tilts
Growth Funds Upper Quartile 2nd Quartile 3rd Quartile Lower Quartile T il t
Figure 13: Growth Superannuation Funds ‐ Asset Allocations Equity Tilts
Data source: Chant West Asset Allocation Survey 2
The salient points from Figure 13 are:
A small number of funds have been significantly underweight equities. These funds (advised by the
same investment consultant) have been underweight Australian equities and have taken significant
hedged positions in respect of global equities.
No funds have taken significantly large overweight positions in equities.
A tilt of no more than 2½% covers 50% of the funds (those between the second and third quartiles).
In 60% of the periods, the average fund has had a slightly negative tilt away from equities, showing
a small degree of risk reduction.
Peer
relative
The introduction of choice of fund legislation in 2005 heralded a new era of competition between
superannuation funds. With investment performance seen as a key point of comparison between funds,
trustees and fund executives have been increasingly aware of their fund's performance relative to their
peers.
Within this environment, funds are aspiring to outperform their competition, but are also conscious of
minimising the risk of underperforming significantly. This can result in funds limiting their asset allocation
tilts relative other funds. Funds may be unwilling to take large positions away from other funds in case it
leads to relative underperformance.
Figure 14 compares the tilts relative to the asset allocation of the average fund. Also included is the
analysis from Figure 10, which compared the funds' actual allocations with their own benchmark.
Figure 14: Growth Superannuation Funds ‐ Asset Allocations Tilts versus Average Fund
Data source: Chant West Asset Allocation Survey 2
There are two main points to be drawn from Figure 14:
The tilt that funds were taking at June 2010 relative to the average fund allocation is around five
times the tilt they are taking against their own benchmark. By December 2014, this had decreased
to around twice the tilt – 30% compared to 12%. Broadly, they are taking twice as much peer risk
as they are benchmark risk.
There has been little change in the dispersion of relative fund allocations over the period, with the
peer risk remaining constant. Despite the trends of alternative asset investing and DAA, this hasn't
resulted in a greater peer divergence in asset allocations.
Tilt
success
The charts in the previous section identified the size of the tilts funds have taken. In this section, we
estimate the degree to which these tilts have been successful.
The analysis below calculates whether a particular overweight/underweight position has been successful in
a particular quarter – i.e. whether that asset class produced a return greater than the average fund return.
With DAA positions focused on medium‐term outcomes, this may be an incomplete measure of an
individual DAA tilt (as the tilt may pay‐off in coming quarters). However, it provides a reasonable guide to
the overall DAA success.
tilt success =
Σ
i [(actual allocationasset(i) – benchmark allocationasset(i)) x(index return asset(i) – average fund return)]
The calculations are based on standard indices for each asset class. Where particular funds are using
different indices for their DAA process, particularly for the more alternative asset classes, this will mean the
Jun-2010 Dec-2010 Jun-2011 Dec-2011 Jun-2012 Dec-2012 Jun-2013 Dec-2013 Jun-2014 Dec-2014
0% 5% 10% 15% 20% 25% 30% 35%
Asset Allocation Tilt verus Average Fund Growth Funds
Tilt vs Benchmark Tilt vs Average
T
il
calculations will not reflect the results an individual fund would quote. Nonetheless, the estimates should
produce a reasonable representation of the impact arising from asset class tilts.
Whilst the average tilt has increased over the last five years, the success of this tilt has varied over time, as
shown in Figure 14. Again, the split into quartiles is shown.
Figure 15: Growth Superannuation Funds ‐ Success of Asset Allocation Tilts by Quartile
Data source: Chant West Asset Allocation Survey 2, indices 5
Figure 15 highlights that:
The average fund produces an excess return from their asset allocation tilts close to zero in most
periods. The quarterly median return varies between ‐¼% and +¼%, with just over half the periods
showing a return above zero. Note that a consistent quarterly outperformance of ¼% would
produce an annual alpha of 1%.
In most periods, the range of returns between the top‐ and bottom‐performing funds is tightly
clustered – less than half a per cent covering all the fund results.
Larger returns are shown in a small number of periods – notably June 2010 (equities markets
decline); June 2013 (Australian equities underperform International equities, exchange rate falls);
and September 2013 (Australian equities outperform International equities, exchange rate rises).
Overall
success
Whilst superannuation funds have defined strategic benchmarks against which they measure their
performance, the ultimate investment objective is to produce returns that maximise the real return on
funds invested over the longer term, while limiting the risk of suffering sustained shortfalls.
All superannuation fund options are required to have investment objectives and need to document these in
An investment target return – The return target is the mean annualised estimate of the percentage
rate of net return of a representative member that exceeds the growth in the consumer price index
(CPI) over 10 years. The target return is calculated based on a 50% probability – that is, funds are
expecting to meet the target return only half the time.
A level of investment risk – The standard risk measure is an estimate of the anticipated number of
years of negative returns for the product over 20 years, corresponding to a risk description that
ranges from ‘very low’ to ‘very high’.
Figure 16 shows the range of target returns and investment risks for MySuper funds.
Figure 16: MySuper Funds ‐ Target Return and Investment Risk Distribution
Data source: APRA MySuper Funds 4
The average target return is 3.65% pa, whilst the average investment risk is 3.5 negative years out of 20. In
total, 23 of the 88 MySuper funds have a target return of CPI +4.5% or greater. Only 11 funds are expecting
4.5 or more years of negative returns in 20 years. There is no relationship between those funds targeting
higher returns and those expecting a higher number of negative returns.
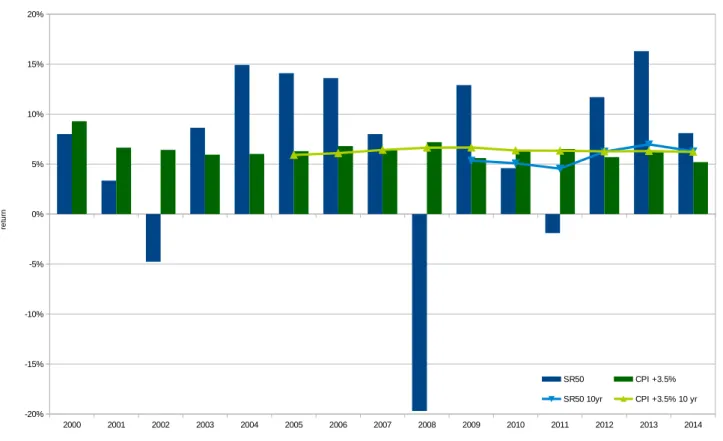
Figure 17 compares the average growth super fund return against a CPI +3.5% pa target over each of the
last 15 years. In addition, the rolling 10‐year return for both the average fund and the CPI + 3.5% target is
plotted. 1.5 2 2.5 3 3.5 4 4.5 5 5.5 6 0 5 10 15 20 25 30 35 MySuper Funds
Target Return Investment Risk
C o u n t o f M y S u p e r F u n d s
Figure 17: MySuper Average Return and CPI Target – By Individual Years and Rolling 10
Data source: SuperRatings SR50 Growth Funds 6, ABS 7
Notwithstanding our return data only covering the last 15 years (the period over which reliable
superannuation returns are available), from Figure 17 it can be seen:
Largely benign investment markets have resulted in superannuation funds producing many good
years, with half the years returning in excess of 10%.
Sustained low inflation has assisted the average fund return to exceed the average target return in
nine of fifteen individual years – a 60% success rate.
As at December 2014, the average fund has matched the average target return, with both
producing 6.2% pa over 10 years.
The return of almost ‐20% in 2008 significantly impacts the period examined. As a result, only 2013
shows the average fund 10‐year return exceeding the average target 10‐year return.
The last fifteen years have produced three years of negative returns, not dissimilar to the
expectation 3.5 in 20 years.
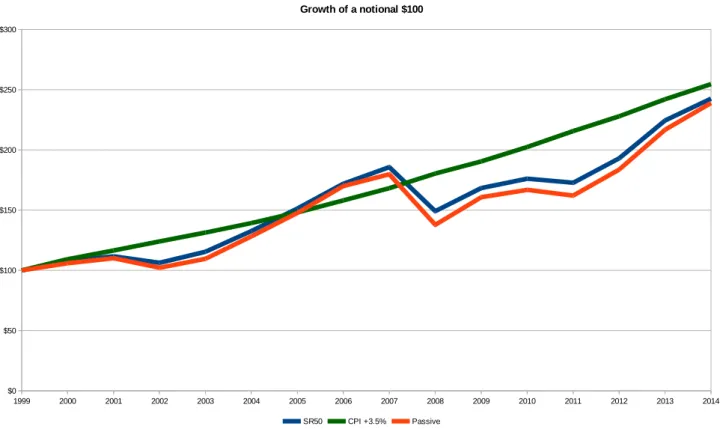
Figure 18 projects the growth in value of a notional $100 invested in the average superannuation fund in
January 1999 over the next 15 years (without any further contributions). It then compares that result with
the outcome based on a return of CPI + 3.5%. A comparison is also made with the result of investing $100 in
the Mercer Corporate Super Indexed Growth Fund – a passive, traditionally managed fund with no
alternatives exposure or a DAA process. The returns for both the average fund and the passive fund are
after fees and taxes. 2000 2001 2002 2003 2004 2005 2006 2007 2008 2009 2010 2011 2012 2013 2014 -20% -15% -10% -5% 0% 5% 10% 15% 20%
MySuper Product Dashboard
SR50 CPI +3.5%
SR50 10yr CPI +3.5% 10 yr
re
tu
Figure 18: MySuper Average Return and CPI Target
Data source: SuperRatings SR50 Growth Funds6, ABS7, Mercer 8
Over the last 15 years, the average superannuation fund failed to exceed the average target return of CPI
+3.5%pa. Despite the good returns leading in to the crash in 2008, and the subsequent double‐digit returns
in 2009, 2012 and 2013, the average fund has still not made up the ground lost in 2008. What's more, the
bursting of the tech‐bubble in 2000 also saw funds underperforming the target return for a number of
years.
It is also instructive to compare the average fund return with the passive fund. Over most periods, the
average fund has outperformed the passive fund. From this we can deduce that the advances in asset
allocation, including diversification and DAA, appear to have made a modest contribution.
However, what is surprising is how closely the passive fund tracks the performance of the average growth
fund. At the end of the 15‐year period, the passive fund is only 3% worse off than the average super fund.
Further, the similarity in the return patterns highlights the very modest extent to which diversification has
mitigated risk.
Conclusion
The traditional approach to investing is based on setting a benchmark asset allocation which reflects the
long‐term characteristics of markets. This benchmark‐based approach has evolved slowly. In the preceding
sections, we have discovered that funds have:
Diversified their fund allocations, by increasing exposure to alternative assets, at a faster rate than
pension funds in other countries. Any continued diversification into alternatives may be
constrained by the MySuper focus on fee levels, and the requirement of some funds for greater
liquidity as they mature.
Employed tightly risk‐controlled dynamic asset allocation policies.
1999 2000 2001 2002 2003 2004 2005 2006 2007 2008 2009 2010 2011 2012 2013 2014 $0 $50 $100 $150 $200 $250 $300 Growth of a notional $100 SR50 CPI +3.5% Passive
Whilst there has been innovation in asset allocation approaches, funds remain peer‐aware. Both the rise in
alternatives and implementation of DAA have largely been mirrored across the industry.
These approaches have generally served superannuation fund members well over the past 30 years.
Longer‐term returns have met expectations in many periods, and superannuation fund investing has
remained largely scandal free.
However, despite some innovation, funds remained as susceptible to the crash in 2008 as they were to
similar declines following the 2000 tech bubble and the stock market crash of 1987. Decision makers
continue to rely on the long‐term nature of superannuation to allow the funds to regain their losses, rather
than avoid them in the first place. With funds now just meeting their target returns based on ten‐year
returns following the crash of 2008, superannuants can wait for many years for “normality” to return.
Fundamentally, the current benchmark‐based approach relies on markets performing in line with their
long‐term averages. The primary tools currently being relied on to dilute the impact of negative returns is a
combination of a type of time diversification (i.e. the notion that subsequent good returns will ultimately
offset the low returns); and some asset class diversification. However, neither can be expected to protect
investors from the risk of substantial capital drawdown during occasional market crises.
Questions can be raised over just how dynamic funds are willing to be in avoiding future crashes, given the
competitive environment and product structures under which they are offered. At this stage, few, if any,
funds have adopted approaches that are purely focused on long‐term investment objectives. In particular,
few funds appear to have the appetite to temper exposure to growth assets in good years, with a view to
protecting capital during poor years.
The capacity of funds to make meaningful changes in asset allocation in pursuit of opportunities, or to
control risk, can thus be questioned. For instance, to what extent are funds willing and able to reduce
exposure to markets that currently appear to be becoming increasingly expensive, and as the risk of a
substantial correction rises? Are they likely to continue to just ‘play around the edges’, remaining anchored
by peer‐relative considerations and their stated benchmarks? We suspect that this might prove the case.
References
Adam Butt, Scott Donald, F. Douglas Foster, Susan Thorp and Geoff Warren, MySuper: A Stage in an
Evolutionary Process, CIFR Research Working Paper, 048/2014 (December).
Allan G. Timmermann , Bruce N. Lehmann and David P. Blake, Asset Allocation Dynamics and Pension Fund
Performance ,The Journal of Business, Vol. 72, No. 4, October 1999, Cass Business School Research Paper
Gary P. Brinson, L. Randolph Hood, and Gilbert L. Beebower, Determinants of Portfolio Performance, The
Financial Analysts Journal, Vol. 42, No. 4 (Jul. ‐ Aug., 1986), pp. 39‐44
Gary P. Brinson, Jeffrey J. Diermeier, Gary G. Schlarbaum, A Composite Portfolio Benchmark for Pension
Plans, Financial Analysts Journal, Vol. 42, No. 2 (Mar. ‐ Apr., 1986), pp. 15‐24
Geoff Warren, Long Term Investing: An Institutional Investor Perspective, CIFR Research Report, October
2014.
James Montier,I Want to Break Free, or, Strategic Asset Allocation ≠ Sta c Asset Alloca on, GMO
Whitepaper, May 2010
Octavius Pickering, Harvard College and Massachusetts General v. Francis Amory. Reports of Cases Argued
and Determined in the Supreme Judicial Court of Massachusetts, Vol. IX (Boston: Hilliard, Gray, Little and
Wilkins), 1831. pp. 446–465.
Robert W. Faff, David R. Gallagher, and Eliza Wu, Tactical Asset Allocation: Australian Evidence, Australian
Journal of Management, Vol. 30(2): 261‐282, 2005
Roger G. Ibbotson, Paul D. Kaplan, Does Asset Allocation Policy Explain 40, 90, or 100 Percent of
Performance?, Financial Analysts Journal, Vol. 56, No. 1 (Jan. ‐ Feb., 2000), pp. 26‐33
Mercer (2010), Mercer predicts top ten investment trends for 2010
Towers Watson (2015), Global Pensions Asset Study – 2015.
Warren Chant, Mano Mohankumar, and Geoff Warren, (2014) MySuper: A New Landscape for Default
Superannuation Funds, CIFR Research Working Paper, 020/2014 (April).
Data
Sources
1. Mercer Pooled Fund Survey (Balanced and Growth funds) covered 39 pooled superannuation trusts
as at June 2008.
2. Chant West produces investment performance and asset allocation surveys for the investment
options of super funds. They focus on multi‐manager, diversified products which are grouped
according to their risk profile. They determine each fund’s risk profile according to its mix of growth
and defensive assets. Broadly, growth assets refer to shares and property, while defensive assets
refer to fixed interest and cash. Growth Funds have 61‐80% exposure to growth assets.
At December 2014, there were 53 funds in the growth fund strategic asset allocation survey. There
were 39 funds in the actual asset allocation survey at the same time.
3. The Towers Watson Global Pensions Asset Study 2015 covers 16 major pension markets, which
total USD 36,119 billion in pension assets and account for 84.4% of the GDP of these economies.
4. APRA registered MySuper funds. As at December 2014, there 88 non‐lifestyle funds.
5. The following benchmark indices where used in the calculation of the tilt success:
Australian shares: S&P/ASX300 accumulation index
Unhedged Overseas shares: MSCI World net accumulation index in AUD Hedged Overseas shares: MSCI World net accumulation index hedged in AUD Australian Listed Property: S&P/ASX 300 A‐REIT accumulation index
Australian Direct Property: Mercer/IPX Property Index
Infrastructure: UBS Global Infrastructure & Utilities 50‐50 net return hedged in AUD
Overseas Property: FTSE EPRA/NAREIT Developed TR AUD Hedged
Australian Bonds: Bloomberg AusBond Composite 0+ Year
Global Bonds: Barclays Global Aggregate TR AUD Hedged
Cash: Bloomberg AusBond Bank Bill
6. The SuperRatings SR50 Growth Index tracks the average performance of the 50 largest
superannuation funds with exposure to growth assets of between 77‐90%. The SR50 is published
to provide a better representation of return medians, ensuring that small funds (with few
members) do not have a major impact on the median result. Returns are after fees and tax.
7. CPI refers to Consumer Price Index; an inflationary indicator that measures the change in the cost
of a fixed basket of products and services, as released by the Australian Bureau of Statistics in
catalogue 6401.0 Consumer Price Index, Australia, data series ID A2325847F: Percentage change
from corresponding quarter of previous year; All Groups CPI, Australia.
8. The Mercer Corporate Super Indexed Growth Fund invests in the Vanguard Growth Index Fund.