Load Balancing for Multi-Projector Rendering Systems
Rudrajit Samanta, Jiannan Zheng, Thomas Funkhouser, Kai Li, and Jaswinder Pal Singh
Princeton University
Abstract
Multi-projector systems are increasingly being used to provide large-scale and high-resolution displays for next-generation inter-active 3D graphics applications, including large-scale data visual-ization, immersive virtual environments, and collaborative design. These systems must include a very high-performance and scalable 3D rendering subsystem in order to generate high-resolution images at real time frame rates. This paper describes a sort-first based par-allel rendering system for a scalable display wall system built with a network of PCs, graphics accelerators, and portable projectors. The main challenge is to develop scalable algorithms to partition and assign rendering tasks effectively under the performance and func-tionality constrains of system area networks, PCs, and commodity 3-D graphics accelerators. We have developed three coarse-grained partitioning algorithms and incorporated them into a working pro-totype system. This paper describes these algorithms and reports our initial experimental results aimed at investigating the feasibility of constructing a sort-first rendering system using a network of PCs and evaluating algorithmic trade-offs and performance bottlenecks within such a system. Our results indicate that the coarse-grained characteristics of the sort-first architecture are well suited for con-structing a parallel rendering system running on a PC cluster.
Key Words: Immersive display systems, cluster computing,
paral-lel rendering, load balancing.
1
Introduction
Multi-projector computer displays are increasingly important for applications such as collaborative computer-aided design and in-teractive scientific and medical visualization. The high resolution of the images (several million pixels) enables visualization of very detailed data sets (e.g., astrophysics simulations). The large phys-ical size of each display surface (a room-sized wall) allows users to interact with rendered objects at their natural sizes, which can be critical to perception and evaluation of 3D models (e.g., for au-tomotive CAD). The space in front of the display supports natural collaborations among multiple people simultaneously viewing and discussing visual data (e.g., for medical treatment planning) and en-ables immersive visualization applications in which the entire field of view for each user is covered with computer-generated imagery. A multi-projector display must include a very high-performance 3D rendering system to support interactive and immersive visual-ization applications. It will be increasingly common to find me-chanical CAD, medical imaging, and scientific visualization appli-cations that process 3D models with millions of polygons to be ren-dered over several million pixels at thirty frames per second. As more projectors are added to the system, more pixels are available, and more complex 3D scenes can be viewed, requiring higher pixel fill and polygon rendering rates.
The state-of-the-art approach is to use a high-end graphics ma-chine with multiple tightly-coupled graphics pipelines. The Power Wall at the University of Minnesota and the Infinite Wall at the Uni-versity of Illinois at Chicago are examples, each driven by an SGI Onyx2 with multiple InfiniteReality graphics pipelines. The main
drawback of this approach is that that the rendering system is very expensive, often costing millions of dollars.
In the Scalable Display Wall project at Princeton University, we take a different approach. Rather than relying upon a tightly inte-grated graphics subsystem, we combine multiple commodity graph-ics accelerator cards in PCs connected by a network to construct a parallel rendering system capable of driving a multi-projector dis-play with scalable rendering performance and resolution. The main theme of this approach is that inexpensive and high-performance systems can be built using a multiplicity of commodity parts. The performance of PCs and their graphics accelerators have been im-proving at an astounding rate over the last few years, and their price-to-performance ratios far exceed those of traditional high-end ren-dering systems. Some inexpensive PC graphics accelerators can already deliver performance close to an SGI InfiniteReality while costing an order-of-magnitude less. Our goal is to leverage the ag-gregate performance of multiple networked PCs to construct a flex-ible and high resolution parallel rendering system comparable in performance to highly specialized display systems at a fraction of the cost.
The architecture of our prototype system is shown in Figure 1. One client PC and server PCs with fast graphics accelerator cards are connected by a system area network. The frame buffer of each server drives one projector whose image is combined with the oth-ers in a tiled grid pattern to form a seamless picture on a large-scale rear projection screen. As compared to traditional parallel render-ing systems, this architecture has several unique characteristics that present potential advantages and new research challenges.
Myrinet Network
Client Servers
Projectors
Figure 1: Scalable Display Wall Architecture.
First, we use a system area network for communication among processors. As compared to hardware or shared memory multipro-cessors, the advantages of networked clusters are modularity and flexibility. Since the processors of our system communicate only by network protocols, they may be added and removed from the system easily, the system may be comprised of heterogeneous
com-puters, and specific rendering processors can be accessed directly by remote computers attached to the network. However, system
area networks usually have a fraction of the performance of internal communication channels. The challenge of cluster computing is to develop low-overhead communication mechanisms and to choose a coarse-grained partitioning schemes that scale within the band-width and latency limitations of the network.
Second, we use commodity hardware components and access them only via standard APIs. The advantage is that the system is less expensive, more flexible, and tracks technology better than systems with custom hardware and software since we can replace components frequently as faster versions become available. The disadvantage is that our design space is constrained. We can only take advantage of features available on commodity graphics accel-erators and exposed through standard APIs (e.g., Windows NT and OpenGL or D3D), and thus direct data access and targeted perfor-mance tuning is usually impossible. As an example, geometry pro-cessing and rasterization is usually tightly coupled within a graph-ics accelerator, and standard APIs, such as OpenGL, give no high-performance access to intermediate rendering results. As a result, it is impractical for us employ a sort-middle rendering approach in which graphics primitives are repartitioned after hardware transfor-mations and before rasterization. The challenge is to develop effec-tive parallel rendering algorithms that send 3D graphics primieffec-tives to the commodity graphics cards and read pixels from the frame buffer only via standard APIs.
Finally, the display is composed of multiple images correspond-ing to projectors attached to frame buffers of different server PCs. This characteristic provides a natural image-parallel decomposition of the rendering computation. Each server PC drives only a sin-gle graphics accelerator, putting less performance and bandwidth pressure on each CPU and memory systems than traditional multi-projector systems. On the other hand, pixels rendered on one com-puter, but projected onto the screen by another, must be sent over a network and loaded into the appropriate frame buffer for display each frame. The challenge is to find coarse-grained screen space partitions that balance the load among all the graphics accelerators, while minimizing the overhead of redistributing the resulting pixels among the frame buffers.
In this paper, we investigate research issues in using a cluster of PCs to construct a high-performance rendering system driving a multi-projector display. Our prototype system is based on a sort-first architecture in which the entire screen is partitioned into a set of “tiles” to be rendered on different PCs. Within this framework, the main research challenges are to find a good partition of screen-space into tiles, to assign the tiles to PCs so that the load is balanced, and to schedule rendering of the tiles to achieve the minimum frame times. We have implemented several algorithms to address these challenges and incorporated them into a working prototype. We report the results of initial experiments aimed at investigating the feasibility of constructing a sort-first rendering system using a net-work of PCs and evaluating algorithmic trade-offs and performance bottlenecks within such a system.
2
Background and Related Work
There are a number of academic groups and commercial compa-nies working on multi-projector display systems based on high-end workstations. Example systems include SGI’s RealityCenter, HP’s Visualize Center, the Power Wall at the University of Minnesota, the Infinite Wall, and the Cave [9] at the University of Illinois at Chicago, the Office of the Future at UNC [28, 29], the Information Mural at Stanford, and our Scalable Display Wall at Princeton. Re-seach on these systems has addressed many important challenges, including automatic projector callibration, seamless projection, un-encumbered user interaction, and new content creation. Our
re-search focus is on constructing a high-performance parallel render-ing system with a network of PCs.
Parallel rendering systems are often classified according to the stage in which primitive partitioning is done – first, sort-middle, or sort-last [7, 22]. Most are based on a sort-middle ar-chitecture, in which processing of graphics primitives is partitioned equally among geometry processors, while processing of pixels is partitioned among rasterization processors according to overlaps with screen-space tiles. This approach is best suited for tightly-coupled systems that use a fast, global interconnection to send prim-itives between geometry and rasterization processors based on over-laps with simple and static tilings, such as a regular, rectangular grid. For instance, in SGI’s Infinite Reality Engine [23], a Vertex Bus is used to broadcast screen space vertex information to each fragment generator driving 80 image engines allocated to vertical strips of pixels. In UNC’s PixelPlanes 5, a global work queue is used to distribute primitives sorted into tiles to rasterization pro-cessors [12]. In addition to the constraints of commodity graph-ics accelerators discussed earlier, the communication demands of sort-middle are too large for a system such as ours in which geom-etry and rasterization processors are connected only by a network. Moreover, they follow the superlinear growth of the overlap factor (the number of tiles overlapped by each graphics primitive) as more rasterization tiles are added to support higher resolutions.
Recently, sort-last systems have been built that render multiple images, each containing a portion of the graphics primitives, and then composite these images with depth into a single image for dis-play [21, 11, 31, 36]. This approach avoids global connectivity of geometry and rasterization processors. However, it provides no strict primitive ordering semantics, and it incurs latency as subim-ages must be composited before display. Moreover, it requires an image composition network with very high bandwidth and process-ing capabilities to support transmission and composition of depth images. These bandwidths far exceed the capabilities of commod-ity networks for high-resolution, multi-projector displays.
In a sort-first system [22], screen-space is partitioned into non-overlapping 2D tiles, each of which is rendered independently by a tightly-coupled pair of geometry and rasterization processors, and the subimages for all 2D tiles are composited (without depth com-parisons) to form the final image. The main advantage of sort-first is that its communication requirements are relatively small, and they scale well with increasing numbers of processors. Unlike sort-middle, sort-first must send primitives between processors only if they migrate between tiles [25]. The disadvantages are that geom-etry processing must be performed redundantly for all tiles over-lapped by each 3D primitive, and extra processing (3D-to-2D trans-formations) must be performed to compute overlaps between 3D graphics primitives and 2D tiles before rendering each frame. As a result, sort-first is best suited for use with retained-mode graphics systems in which overlap decisions can be made for hierarchical groups of spatially co-located primitives.
This paper builds upon a long history of prior work on screen-space screen-space partitioning methods for parallel rendering [6, 38]. At the highest level, approaches can be classified based on whether the decomposition of screen-space into tiles is static [18, 26, 10, 23, 8] or whether the tile boundaries are determined dynamically according to the distribution of graphics primitives on the screen [37, 32, 34, 24]. If there are more tiles than processors, then tiles can be assigned to processors either statically or dynamically. So far, tile shapes have been based on scan lines [15], horizontal strips [18, 37, 5], vertical strips [37], and rectangular areas [18, 34, 32, 39, 8, 4]. Most systems define several times more tiles than there are processors so that the rendering load can be balanced. Yet, this approach leads to inefficiencies due to high primitive-tile overlap factors and the loss of spatial coherence across tile boundaries [8].
over-laps in tiled rendering systems. Molnar proposed an equation for modeling the overlap factor for 2D bounding boxes on 2D
rect-angular tiles [20]. His analytical model has been corroborated by experimental evidence [8, 22], and it has been used as the basis for subsequent studies [4, 8]. Cox and Bhandari investigated the rela-tionships between tile (bucket) sizes and overlap factors incurred in a bucket rendering system using static, grid-aligned rectangular tiles [8]. Although they consider alternative tile arrangements, they do not examine the extent to which they may reduce overlap.
Dynamic decomposition approaches can be divided into three types. Top-down approaches [37, 24] start from the screen-space as a whole and divide it recursively into tiles based on estimated work-loads. Bottom-up approaches start from a large number of predeter-mined tiles and combine them into larger tiles that are then assigned to processors. For example, a quadtree representation of screen-space may be used, and the leaves merged to construct tiles based on estimated loads. Optimization approaches [39] begin with some ini-tial decomposition and assignment (e.g. a static one or the one from the previous frame) and adjust it to balance the workload by cutting out and reassigning smaller tiles from existing partitions to meet some load balancing criterion. We will examine approaches from the three types that have been considered so far (Static, Dynamic Top-down and Dynamic Optimization), using known approaches and developing new ones.
Relatively little work has been done on interactive polygon ren-dering using a cluster of networked PCs [17, 33]. The primary problem has been that the latency and bandwidths of typical net-works has not been adequate for fine-grained parallel rendering al-gorithms. Accordingly, prior distributed rendering systems have mostly focused on inter-frame parallelism [17], rendering separate frames of an image sequence on separate computers in parallel, rather than on intra-frame parallelism, which is required to achieve scalable speedups in a real-time system utilizing many processors. Networks of workstations have been used successfully for parallel graphics algorithms with coarse granularity, such as volume ren-dering [19, 16], radiosity [30, 14], and batch renren-dering of image sequences [17, 27]. We are not aware of any prior system that has achieved scalable intra-frame polygon rendering speedups via dy-namic screen-space partitions using a cluster of PCs.
3
Overview of Approach
In multi-projector systems, the most common approach to paral-lel rendering is to dedicate one graphics processor to each projec-tor and sort graphics primitives among the processors according to their overlaps with projection regions. Unfortunately, this sim-ple strategy achieves poor performance if graphics primitives are not uniformly distributed over all processors such as in the case when the details of an object covers only one or two projectors on the screen. The imbalance often causes the majority of system re-sources to go unused, and it generally becomes worse as more pro-jectors and processors are added to the system.
Our approach is to use a sort-first architecture in which the rendering computation is partitioned into coarse-grained tasks re-quiring relatively little inter-process communication using “virtual tiles,” non-overlapping pixel regions of the screen not necessarily corresponding one-to-one with projection regions (“physical tiles”). Rendering all the pixels of a single virtual tile is the atomic task in our parallel rendering system, and thus rendering a virtual tile re-quires processing all graphics primitives potentially overlapping it. In principle, we allow virtual tiles (or just “tiles”) to be any size or shape, including non-rectilinear, concave, or even disjoint regions, as long as each pixel on the screen maps to exactly one tile. Since tiles do not overlap, pixels of images rendered independently for separate tiles can be combined without depth comparisons to con-struct images for projection on the wall. Pixels of a tile rendered on
a “remote” server, but projected onto the display by another (the pixels’ “local” server), are sent over a system area network and loaded into the local frame buffer.
The sort-first approach provides a coarse-grained, high-level decomposition of the rendering computation [24]. Unlike sort-middle systems, which must either broadcast or independently sort many low-level rasterization primitives among the screen-space tiles during every frame, our sort-first system is able to partition the scene based on high-level 3D primitives, possibly taking ad-vantage of frame-to-frame coherence, precomputed work load dis-tribution statistics, sophisticated rendering time prediction mod-els, scene graph hierarchies, and/or other application-specific data structures. Consequently, it is possible to predict rendering times effectively and to consider irregular tile arrangements and dynamic server assignments, potentially achieving lower overlap factors and better load balances than using the rectangular grid-aligned tilings commonly employed in sort-middle systems.
In order to reduce the communication requirements among pro-cessors, our system replicates the 3D scene on every PC. Unlike sort-middle approaches where graphics primitives are sent to ras-terization processors during sorting, this design requires no trans-mission of graphics primitives and thus requires little inter-process communication. Unlike sort-last or SGI’s MonsterMode where all rendered pixels are sent to the frame buffer, this approach transfers only those pixels rendered for remote processors, since the final image remains distributed across many projectors or PCs. The im-age appears only via optical blending as the projectors composite the contents of all the frame buffers into a single, seamless image. Although the distribution of pixels rendered on remote nodes re-quire communication, with clever screen-space partitioning algo-rithms, these cases can be kept well within the bandwidth limits of system area networks (e.g., 100MBytes/s in our case).
4
System Organization
We have built a prototype sort-first parallel rendering system on the scalable display wall system constructed at Princeton. The current display wall system uses eight Proxima 9200 LCD polysilicon pro-jectors arranged in a 4 by 2 fashion to project a seamless image using a blending process on an 18’ by 8.5’ rear projection screen. The resolution of each projector is 1,024 by 768 so the display wall system delivers 4096 by 1536 (or 6 million) pixels per frame. The system uses a network of eight 450Mhz Xeon Pentium II PCs with Integraph 3410T 3-D graphics accelerators to drive these projec-tors. The parallel rendering system uses the eight PCs as render-ing servers and another 300Mhz Pentium II PC without a graph-ics accelerator as the client machine to do sort-first processing. Each server currently can render approximately 300K independent quads/second and fill approximately 600M textured pixels/second. All nine PCs are connected by a Myrinet system area network (see Figure 1) using the VMMC-2 communication firmware and soft-ware developed by Princeton’s SHRIMP project [3]. The com-munication mechanism can deliver 13 s one-way end-to-end
la-tency and 100MB/s bandwidth simultaneously between each pair of nodes.
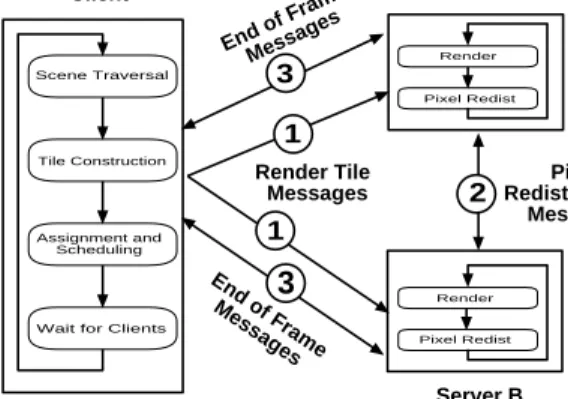
Execution of the system proceeds as shown in Figure 2. At the start, the client and all the servers read the same 3D scene graph from a file on disk and store it entirely in memory. Then, during each frame of an interactive visualization session, the client ex-ecutes the following steps as the user moves a simulated camera through the 3D scene. It first uses occlusion culling and detail eli-sion algorithms to compute a potentially visible set (PVS) of scene graph nodes to be drawn in the current frame [13]. It then decom-poses screen-space into non-overlapping tiles, sorts the nodes of the PVS according to their tile overlaps, and assigns each tile to a server. Next, it sends a sequence of render tile messages to the
servers, each containing: 1) the simulated camera parameters, 2) the 2D extent of the tile, 3) a list of IDs representing the PVS nodes
potentially overlapping the tile, and 4) an optional list of pixel re-distribution commands (if parts of the tile do not reside within the region of the screen covered by the projector attached to the server).
Scene Traversal
Tile Construction
Assignment and Scheduling
Wait for Clients
Render Pixel Redist Render Pixel Redist 1 2 3
3
Client Server A Server B Pixel Redistribution Messages End of Frame Messages Render Tile Messages End of Frame Messages 1Figure 2: Flow chart of client-server execution.
When a server receives a render tile message, it sets the OpenGL camera and viewport regions to match the information sent in the message, and it renders the nodes of the PVS indicated by the list of IDs in the message using standard OpenGL commands to up-date the “back” buffer of a double buffered video memory. After all primitives overlapping the tile have been rendered, the server may read the resulting pixels from the frame buffer back into mem-ory (using glReadPixels) and send them in a pixel redistribution message to every server whose projection region overlaps the tile. When a server receives a pixel redistribution message, it loads the rendered pixels into the appropriate location of its frame buffer (us-ing glDrawPixels).
Finally, at the end of each frame, the client exchanges synchro-nized “end of frame” messages with each server so that all server PCs swap buffers within a few tens of microseconds of each other.
5
Load Balancing Algorithms
The main research challenge in implementing our prototype system is to develop algorithms that decompose screen-space into tiles and assign them to PCs so as to achieve the fastest frame rates possible. An effective partition must balance multiple conflicting goals:
Minimize Overheads: The partition should minimize
over-heads due to pixel redistribution (when a tile is rendered on a remote server), redundant rendering (when a group of primi-tives is geometry bound and overlaps more than one tile), and basic “per bucket” processing. These factors favor construc-tion of large tiles and assignments to “local” servers.
Balance Assignments: The tiles should be constructed and
assigned to servers so that the load is balanced. In our case, the tiles cannot be too few, or too large, and too “chunky,” or else balanced assignments become difficult. These factors favor construction of many small tiles of varying sizes or con-struction of exactly tiles with equal work loads.
Partition Quickly: The partition must be simple enough that
it can be computed in real-time for each frame, and the system must be able to sort all 3D scene graph nodes among the tiles during each frame time.
Of course, finding an optimal partition to meet all these goals is intractable, and thus we focus on developing good heuristic meth-ods. To simplify our investigation, we consider only geometry-bound models stored in a scene graph data structure. In this con-text, we have developed three screen-space partitioning algorithms, two of which are based on balanced assignment of pixels grouped in grid buckets (GRID and UNION), and one which is based on a combination of recursive splitting and greedy optimization.
5.1
Grid Bucket Assignment Algorithm
Our first partitioning algorithm, GRID, focuses on balanced assign-ment of grid-aligned tiles to server PCs. In this algorithm, the basic unit of work is rendering all the primitives overlapping a single grid tile (or “bucket”). Every tile is rendered independently, so the al-gorithm can assign each one to any server in order to balance the load. This approach is similar in spirit to work-queue algorithms (as in [12]). The only differences are that assignments are made a priori based on predicted rendering times, and pixel redistribution overheads are incurred if a bucket is assigned to a remote server.
Our assignment strategy is motivated by “first-fit decreasing” al-gorithms. At the start of every frame, the client constructs a set of tiles corresponding to rectangular regions of a regular grid. It then estimates the rendering cost for each scene graph node using primi-tive distribution statistics stored in the scene graph, and it computes the 2D axis-aligned bounding box containing the projection of ev-ery 3D scene graph leaf node on the screen. It sorts the scene graph nodes among the tiles according to their 2D bounding box overlaps, forming an estimate of the cumulative time required to render each tile. Initially, every tile is assigned to its “local” server (i.e., the one whose projection region contains it), and an estimated work load ( ) is computed for each server . Next, for every tile initially
assigned to , the client determines the local benefit ( ) and the
remote cost ( ) of rendering the tile on another server, :
!#" $ !#"&%' ( ) !) ) *+, - . /10 ) )2. 3! )
where !) and/40 ! represent networking
over-heads, and+,3! ! and %' )( - 5 represent pixel
re-distribution overheads.
The client proceeds by iteratively finding the most loaded server,
768:9<;, and it tries to reduce estimated work load of68=9); by
send-ing one tile to the least loaded server, >@?BA
9<;. It considers tiles
of 68:9<; in descending order of estimated benefit and assigns to
>@?BA 9<; the first one that reduces the maximum of the two servers’
estimated work loads (i.e., if )68=9); . >@?BA 9);2C 68:9<;4" D>@?BA 9<;).
The algorithm terminates when the most loaded server has no re-maining tiles with positive benefit that can be assigned remotely in this way.
After all tiles have been assigned, the client generates a render tile message for every tile and sends it to the server to which the tile has been assigned. The sequence of messages is ordered such that the ones representing tiles assigned to remote servers are sent first. In this way, tiles can be rendered by remote servers without concern for writing over pixels already rendered for its local tiles, and most pixel re-distribution messages can be generated early in the frame cycle in order to avoid potential temporal imbalances.
5.2
Grid Bucket Union Algorithm
Our second algorithm, UNION, is aimed at reducing the impact of high overlaps possible with small buckets in geometry-bound situa-tions, while avoiding inefficiencies due to imbalanced assignments and large pixel redistributions. The idea is to construct tiles dynam-ically based on server assignments. Specifdynam-ically, all grid buckets
mapping to the same projector and assigned to the same server are unionedE into a single tile. The overlap factor reductions of this
bucket merging strategy are potentially quite significant, especially for the many buckets assigned to their local servers. Rather than rendering each primitive separately for each of these buckets, they can be rendered only once. Buckets rendered on remote servers are merged into tiles in a similar fashion. Intuitively, each server is able to cutout small, contiguous bucket-aligned regions of its frame buffer and off-load rendering of them to other servers. So, over-heads due to overlaps are incurred only once per sender-receiver pair.
The idea behind this algorithm is related to the dynamic schedul-ing method proposed by Whitman [39]. He started with a set of ini-tial tiles and “stole” part of another processor’s work dynamically when no initial tiles remain. The stealing was achieved by splitting the remaining tile region on the maximally loaded processor into two vertical strips having the same number of scanlines. However, the differences between our approaches are significant, as our algo-rithm executes in a sort-first system with a priori assignments made in a client, and we use commodity rasterizers which do not allow control over the order in which scan lines get updated. In general, it is expensive for our sort-first system to reassign part of a tile af-ter one server has already started rendering it, as color and depth buffers would have to be transferred.
Assignment in our UNION algorithm proceeds in the same fash-ion as the GRID algorithm described in the previous sectfash-ion. The primary difference is the manner in which rendering is performed, and consequently the way in which pixels are redistributed and ben-efits and costs are computed. When a server renders a tile, it draws all primitives overlapping any of its buckets, marking them as they are drawn, and never redraws a primitive marked for the tile. In this manner, pixels outside the buckets representing the tile may be up-dated, but without harm if the system is geometry-bound. If a tile is assigned to a remote server, the pixels inside the tile’s buckets are sent to the appropriate local server in a series of pixel redistribution commands.
These differences significantly change the benefits and costs of rendering a bucket remotely as compared to the GRID algorithm. Most importantly, previous assignments of buckets to servers im-pact the benefits and costs of current ones (i.e.,
may not equal
). For instance, in the situation
shown in Figure 3, the cost of including bucket ‘A’ in a tile for server ‘2’ is zero, since all primitives overlapping ‘A’ are already slated to be rendered on server ‘2,’ while the cost of assigning the same bucket to server ‘3’ is non-zero. Similarly, the immediate ben-efit of assigning bucket ‘B’ to any remote server is also zero, since all primitives overlapping it also overlap other buckets assigned to the local tile. Generally, only buckets with primitives wholly inside them have positive benefit unless the assignment finds two neighbor buckets that cumulatively enclose some primitives.
F F F F F F F F F F F F F F F F F F F F F F F F F F F F F F G G G G G G G G G G G G G G G G G G G G G G G G G
A
H H H H H H H H H H H H H H H H H H H H H H H H H H H H H H H H H H H H I I I I J J J J J JBuckets already assigned to server 2 Buckets already assigned to server 3
C A, 2 = 0 C
A, 3 = 2
B
Figure 3: Prior assignments affect costs and benefits.
5.3
KD-Split Algorithm
The last algorithm, KD-SPLIT, is motivated by the observation that constructing fewer tiles generally leads to lower overheads due to overlaps and bucket processing. A plausible strategy is to create exactly tiles with equal rendering loads so that exactly one tile can be assigned to each PC. In our algorithm, we start with the entire screen in a single tile and recursively split it with "LK axial
lines to form a KD tree with regions [1].
This recursive partitioning strategy is similar to ones used pre-viously for dynamic tile construction. For instance, Whelan de-veloped a median-cut method in which a tile initially covering the entire screen was partitioned recursively by a splitting line per-pendicular to its longest axes so that the centroids of its overlap-ping graphics primitives were partitioned most equally [37]. In later work, Mueller developed a mesh-based median-cut method in which primitives were first tallied up according to how their bound-ing boxes overlapped a fine mesh, and an estimated cost was calcu-lated for each overlapped mesh cell. Then, using this data as a hint, screen space tiles were recursively split along their longest dimen-sions until the number of regions equaled the number of processors [24].
One difference between our split algorithm and previous ones is that it makes more direct use of computed primitive distribution in-formation to choose splitting lines that avoid overlaps and balance rendering load among tiles. Specifically, at the start of every frame, the client computes a screen-space, axis-aligned bounding box con-taining the 2D projection of every 3D scene graph leaf node on the screen. It then constructs a single tile covering the entire screen and builds two lists with pointers to 2D bounding box vertices sorted according their X and Y coordinates. For each subdivision of the X dimension (subdividing Y is the same), we use a sweep line algo-rithm to choose a location for the splitting line (see Figure 4). The sweep line starts at the left side of the tile and moves right iteratively considering vertex locations stored in the sorted list. As it moves incrementally, estimated costs of rendering all primitives overlap-ping the left and right halfspaces (M>@?ON ; and PRQ4ST;) are updated.
Initially, >@?BN ; is zero, and PUQ4SV; is equal to the cost of rendering
all primitive overlapping the tile. As the sweep line is moved to the right,M>@?ON ; grows monotonically (whenever the left side of a box
is reached), andP RQVSV; shrinks monotonically (whenever the right
side of a box is passed), and they eventually cross. At this point, we construct a splitting line that subdivides the tile. This procedure is executed recursively "WK times to construct exactly tiles.
Left = 4 Right = 7
Split Position Cost
Cleft Cright
Optimal
Figure 4: KD-Split Optimization.
Another difference in our algorithm is that the KD splits are ad-justed with an optimization algorithm after the initial set of tiles has been constructed. We note that the estimated rendering times of tiles in the left and right halfspaces of any line change monoton-ically as the line is moved in one direction, and the curve represent-ing the maximum of M>@?BN; andPUQ4SV; has exactly one minimum
(see Figure 4). Based on these observations, we iteratively move the splitting line stored in the root of the KD tree in the direction that best balances the estimated rendering costs of its left and right subtrees. Every time the root split is adjusted, the subtrees rooted at its children are adjusted recursively in the same way. This
opti-mization procedure terminates when the root can make no further moves to reduce the maximum estimated rendering time of any tile
in its left and right subtrees. The result is a KD tree with the same topology as the initial one, but with splits resulting in the global minimum of the maximum rendering time of any server.
Unfortunately, there are hardware constraints that complicate ap-plication of the KD split algorithm in our prototype system. First, the servers can render OpenGL commands only to windows that fit on one projector screen. Thus, if the KD split algorithm creates a tile larger than one screen, it must be split into as many as four tiles whose longest dimensions fit within one projector. Second, our current algorithm does not incorporate penalties for large pixel re-distribution. Adding pixel write costs causes the objective function to become non-monotonic, and thus finding a global minimum for the maximum frame time of all servers is difficult. We are currently investigating heuristic optimization methods that take into account pixel redistribution costs within this framework.
6
Experimental Results
The algorithms described in the previous sections have been im-plemented in C on PCs running Windows NT/98 and incorporated into our prototype system. In this section, we report data collected during a series of tests run on the system. The goals of these ex-periments were to investigate the algorithmic trade-offs of different partitioning strategies, to identify potential performance issues in the prototype system, and to assess the feasibility of constructing a sort-first parallel rendering system with a cluster of PCs.
In each test, we logged statistics while rendering a sequence of frames in an interactive visualization program while viewing the test models shown in Figure 11. Every model was represented as a scene graph in which multiple polygons were grouped at the leaf nodes and treated as atomic entities by the partitioning algorithms. In all cases, rendering was “geometry-bound.” For each model, the camera traveled along a preset path which started “zoomed in” such that the model filled the full screen at the beginning of the path, and it gradually “zoomed out” until the model was small enough to fit on a single projector (one-eighth of the screen) at the end of the path.
Table 1 contains comparisons of timing statistics measured dur-ing tests with different partitiondur-ing algorithms and test models (av-eraged over all frames of the camera path in each test). The first two columns indicate the name of partition method and the grid granularity (expressed as number of buckets across the screen in the X and Y dimensions), respectively. The next column (labeled ‘Client Time’) shows the total time spent in the client for construct-ing and assignconstruct-ing tiles. The next column lists the ‘Render Time,’ required to render each model with a hypothetical system executing with no overheads exactly eight times faster than a single PC. The next column (labeled ‘Ovlp Time’) shows the overhead due to re-dundant rendering of scene graph nodes overlapping multiple tiles (Avg Render Time - Render Time). The column labeled ‘Imbal-ance Time’ shows the time servers spent waiting for the last server to finish rendering each frame (Max Rendering Time - Avg Render-ing Time). The next column (‘Pixel Time’) shows the overhead due to pixel redistribution, including reading pixels, writing them, and transmitting them. Finally, the rightmost column, labeled ‘Frame Time,’ lists the overall time required to complete each frame aver-aged over all cameras in each test.
More detailed statistics are provided in Figures 5-10. In par-ticular, Figures 5, 7, and 9 show times collected for each frame during tests with the HORSE model (all others are similar). In these plots, the horizontal axis represents different camera locations along the test path, while the vertical axis shows averages of times measured in the eight servers. The meanings of the colored bands match columns 4-7 of Table 1. Specifically, the lowest band (gray)
STATIC ALGORITHM
Test Grid Client Render Ovlp Imbal Pixel Frame
Model Buckets Time Time Time Time Time Time
HORSE 1x1 3 21 2 84 0 114
MOL 1x1 5 31 2 85 0 134
ASTRO 1x1 9 88 9 355 0 452
BLDG 1x1 13 181 -8 426 0 670
GRID ALGORITHM
Test Grid Client Render Ovlp Imbal Pixel Frame
Model Buckets Time Time Time Time Time Time
HORSE 2x2 4 21 5 56 6 120 4x3 4 21 9 31 6 83 8x6 5 51 20 10 6 68 16x12 12 21 53 6 8 106 32x24 76 21 149 7 18 249 MOL 2x2 5 31 7 50 8 122 4x3 6 31 14 31 7 95 8x6 8 31 33 8 6 88 16x12 17 31 83 5 9 146 32x24 103 31 230 9 19 337 ASTRO 2x2 9 88 18 291 5 421 4x3 11 88 37 105 5 243 8x6 13 88 83 64 4 246 16x12 27 88 209 16 7 335 32x24 103 88 574 25 16 750 BLDG 2x2 13 181 1 169 11 405 4x3 14 181 15 83 9 308 8x6 16 181 52 37 7 286 16x12 27 181 138 31 8 375 32x24 122 181 368 51 15 654 UNION ALGORITHM
Test Grid Client Render Ovlp Imbal Pixel Frame
Model Buckets Time Time Time Time Time Time
HORSE 2x2 9 21 4 59 4 118 4x3 11 21 8 34 5 89 8x6 26 21 14 12 4 64 16x12 215 21 18 22 3 234 32x24 3169 21 14 51 1 3220 MOL 2x2 12 31 7 51 7 128 4x3 14 31 11 33 6 95 8x6 30 31 19 12 4 74 16x12 223 31 27 16 3 246 32x24 3191 31 21 52 2 3246 ASTRO 2x2 17 88 17 301 4 430 4x3 19 88 32 122 3 255 8x6 34 88 49 75 2 221 16x12 234 88 82 18 3 234 32x24 3245 88 91 73 2 3245 BLDG 2x2 24 181 0 173 10 405 4x3 27 181 8 80 8 299 8x6 45 181 24 28 6 247 16x12 251 181 45 27 5 301 32x24 - - - -KD-SPLIT ALGORITHM
Test Grid Client Render Ovlp Imbal Pixel Frame
Model Buckets Time Time Time Time Time Time
HORSE - 19 21 6 3 15 62
MOL - 31 31 11 2 15 79
ASTRO - 20 88 36 14 6 152
BLDG - 95 181 9 16 16 236
shows the ‘Render Time’; the second band (brown) shows the aver-age ‘Ovlp Time’ in each frame; the third band (yellow) shows the ‘Imbalance Time’ in each frame; and, the top band (blue) shows the time spent on other overheads, primarily ‘Pixel Time.’ The overall frame time is indicated by the curve across the top of all bands in each plot.
6.1
Static Projector-Based Partition Results
In our first experiment, we measured the performance of the sys-tem with a simple static screen-space partition in which a PC was dedicated one-to-one for each projector. This approach, which we call STATIC, forms the basis for most commercial multi-projector display systems. It also sets a base-line for comparison of perfor-mance with our bucket-based algorithms, as the STATIC algorithm is equivalent to the GRID 1x1 algorithm, in which one grid bucket is allocated per projector.Scanning the imbalance time statistics for all models in the top-most section of Table 1 (labeled STATIC) and for the horse model in the plot of Figure 5, it is easy to see the how imbalanced the rendering system is with a projector-aligned static partitioning ap-proach. In this test, the camera starts at a viewpoint for which the 3D model fills the entire screen (the early frames of the plot in Fig-ure 5), and it slowly “zooms out” until the model covers only one projector at the end of the sequence. As the 3D model becomes smaller and spans fewer projectors, the ‘Imbalance Time’ increases as more of the rendering load is handled by fewer servers. This ef-fect is indicated by the large yellow region in Figure 5. Finally, at the end of the path, almost exactly 7/8ths of the system’s resources were idle and the ‘Frame Time’ exceeded 160ms.
0 20 40 60 80 100 120 140 160 180 1 21 41 61 81 Frames T im e
Pixel Overhead Time Imbalance Time Overlap Time Render Time
Figure 5: Frame times (in milliseconds) measured during tests with the HORSE model using STATIC projector-aligned tiles.
6.2
Grid Bucket Assignment Results
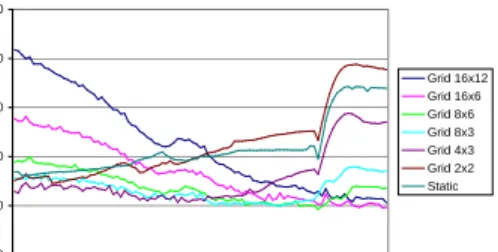
In our second experiment, we investigated the performance of the system with partitions based on the GRID bucket assignment al-gorithm described in Section 5.1. The second section in Table 1 contains results of tests with different 3D models and bucket sizes, while detailed timing plots captured during tests with the HORSE model appear for different bucket sizes in Figures 6 and 7(a-c).
The results of this experiment indicate that it is very difficult to choose an appropriate bucket size in a sort-first rendering system, even if buckets are assigned to processors dynamically. On the one hand, if the bucket size is sufficiently small (e.g., 16x12 cover each projector), overlap factors are very large, and the overheads of re-dundant rendering dominate the frame time (e.g., the brown area in Figure 7(c)). On the other hand, if the buckets are made large enough to avoid undue overlaps (4x3), then the rendering tasks are very large and it becomes difficult to assign them evenly among the servers, leading to load imbalances indicated by high server ‘Im-balance Times’ (e.g., the large yellow area in Figure 7(a)).
0 50 100 150 200 250 1 21 41 61 81 Frames F ra m e T im e Grid 16x12 Grid 16x6 Grid 8x6 Grid 8x3 Grid 4x3 Grid 2x2 Static
Figure 6: Plots of the frame times (in milliseconds) achieved during tests with the HORSE model using different GRID bucket sizes.
This result for a sort-first system is interesting when compared with recent results reported by Chen et al. in their study of the ef-fect of overlap factors on rendering times in a sort-middle bucket rendering system [4]. Based on analytical models and experimen-tal evaluations, they concluded that the processing overhead due to overlaps is generally less than the raw overlap factor in a sort-middle system, since primitives much smaller than the bucket size tend to overlap only one bucket, and primitives much larger than the bucket size tend to be rasterization bound. However, in our ex-perience, this result does not apply to sort-first systems, in which groups of primitives are considered atomically for overlap compu-tations. In this case, if any primitive in a group overlaps a tile, all primitives in the group must be processed when rendering the tile. As a result, in a sort-first system, the effective overlap factors are usually much higher than in sort-middle, and it is possible (com-mon) for objects to be both large and geometry-bound.
6.3
Grid Bucket Union Results
In our third experiment, we investigated the performance of the grid bucket union algorithm (UNION) described in Section 5.2. The results appear in the third section of Table 1 and in Figures 8 and 7(d-f). 0 50 100 150 200 250 1 21 41 61 81 Frames F ra m e T im e Union 16x12 Union 16x6 Union 8x6 Union 8x3 Union 4x3 Union 2x2 Static
Figure 8: Plots of the frame times (in milliseconds) achieved during tests with the HORSE model using different UNION bucket sizes.
We find the differences between the GRID and UNION algo-rithms to be very interesting for small and medium bucket sizes. First, the compute time in the client can be a bottleneck if there are too many candidate grid buckets on each server (16x12). Yet, the UNION algorithm significantly reduces measured overlaps as com-pared to the GRID algorithm. The reduction is almost wholly due to avoiding redundant rendering for multiple buckets assigned to the same local server. It is especially noticeable in cases where the 3D model appears very large on the screen and scene graph leaf nodes are very large compared to the bucket size. For instance, compare the brown bands representing ‘Overlap Time’ in the early frames of the plots for GRID 16x12 and UNION 16x12 in Figure 7(c,f).
0 20 40 60 80 100 120 140 160 180 1 21 41 61 81 Frames T im e
Pixel Overhead Time Imbalance Time Overlap Time Render Time (a) GRID 4x3 0 20 40 60 80 100 120 140 160 180 1 21 41 61 81 Frames T im e (d) UNION 4x3 0 20 40 60 80 100 120 140 160 180 1 21 41 61 81 Frames T im e (b) GRID 8x6 0 20 40 60 80 100 120 140 160 180 1 21 41 61 81 Frames T im e (e) UNION 8x6 0 20 40 60 80 100 120 140 160 180 1 21 41 61 81 Frames T im e (c) GRID 16x12 0 20 40 60 80 100 120 140 160 180 1 21 41 61 81 Frames T im e (f) UNION 16x12
Figure 7: Timing statistics (in milliseconds) measured during tests with the HORSE model using different bucket sizes.
Unfortunately, the way in which the UNION algorithm avoids overlaps induces a new problem, which is indicated by the large ‘Imbalance Times” (yellow area) in the early frames of the UNION 16x12 plot in Figure 7(f). The imbalance occurs because the UNION algorithm can only avoid rendering a scene graph node if all the tiles it overlaps are assigned remotely. Or, similarly, it is easier for the algorithm to distribute the load in situations where most scene graph nodes generally lie wholly inside buckets. In the situation depicted on the left side of Figure 7(f), the scene graph nodes appear large because the camera is zoomed in, and the buck-ets are relatively small. Consequently, few scene graph nodes are found that can be assigned remotely with positive benefit, and the assignment algorithm has trouble balancing the load. We are cur-rently investigating algorithms that grow large tiles from adjacent buckets based on expected future benefits. More experimentation is required to understand the trade-offs of this new approach.
6.4
KD-Split Results
In our fourth experiment, we investigated the performance of the KD split algorithm (KD-SPLIT) described in Section 5.3. The re-sults appear in the bottom section of Table 1 and in Figure 9.
0 20 40 60 80 100 120 140 160 180 1 21 41 61 81 Frames T im e
Pixel Overhead Time Imbalance Time Overlap Time Render Time
Figure 9: Frame times (in milliseconds) measured during tests with the HORSE model using KD-SPLIT partitions.
The KD split optimization algorithm clearly achieves very uni-form rendering times, with low overlap factors, and with few server imbalances (e.g., the yellow area is thin and flat in Figure 9). More-over, these features are robust over a wide-variety of 3D model sizes (both the left and right sides of the rendering time curve are flat), which differentiates the KD split algorithm from the other ones which are negatively impacted for either large or small 3D mod-els by their choice of bucket size.
On the other hand, the pixel redistribution times are larger for the KD split algorithm than the others (indicated by the large the blue area in Figure 9). As mentioned in Section 5.3, our current algorithm does not incorporate penalties due to construction of tiles covering many projectors and/or causing large pixel redistribution costs. Instead, it only focuses on balancing the rendering load. We expect that it will be possible to augment the KD-SPLIT algorithm in future work to construct slightly more than tiles which can be balanced and incur less overheads, or to incorporate pixel re-distribution costs into the optimization. In any case, we expect the KD-SPLIT algorithm to perform well in systems with less resolu-tion and/or lower image composiresolu-tion overheads.
6.5
Comparison of Frame Times
Table 2 shows a comparison of the average frame times measured in tests with each of the partitioning algorithms (with the best ob-served bucket sizes). The rightmost column, labeled ‘Efficiency,’ provides the ratio of the average measured frame time in each test as compared to an “ideal render time” defined as the time required by a single PC divided by eight.
It is impossible to declare that any one of our three partition algo-rithms is superior to the others. Examining the plot of overall frame times in Figure 10, we see that the KD-SPLIT algorithm achieves the fastest frame times in situations when the 3D model is zoomed in (the right side of each plot). Yet, others, such as the UNION al-gorithm, do better when the 3D model covers many pixels. Perhaps, in future work, it will be possible to combine these two approaches into a hybrid top-down and bottom-up approach in which KD tree tiles are iteratively split and merged during an optimization
proce-Test Part Frame Time
Model Method Min Avg Max Efficiency
HORSE STATIC 81 108 171 0.19 GRID 8x6 46 68 100 0.31 UNION 8x6 47 63 82 0.33 KD-SPLIT 40 64 117 0.33 SGI IR 68 81 91 -MOL STATIC 68 122 236 0.25 GRID 8x6 60 90 146 0.34 UNION 8x6 62 74 91 0.42 KD-SPLIT 56 80 134 0.39 SGI IR 150 153 155 -ASTRO STATIC 222 452 707 0.20 GRID 8x6 153 246 285 0.36 UNION 8x6 148 221 318 0.40 KD-SPLIT 128 152 184 0.58 SGI IR 206 208 236 -BLDG STATIC 239 591 1458 0.31 GRID 8x6 242 288 347 0.63 UNION 8x6 182 244 352 0.74 KD-SPLIT 205 237 266 0.76 SGI IR 176 285 403
-Table 2: Frame time statistics (in milliseconds).
dure.
Interestingly, we see that the STATIC algorithm performs the best in the early frames of the test with the MOL model (the left side of Figure 10(b)). This occurs any time the 3D model covers all eight projector regions almost equally. Due to the physical constraints imposed by our system, it is hard to imagine an algorithm that could do better in this case. Yet, we are able to develop algorithms that do not perform much worse than STATIC when the load is already balanced, and achieve significant speedups when it is not.
0 50 100 150 200 250 300 1 21 41 61 81 Frames F ra m e T im e Union 8x6 Grid 8x6 Static KD-Split (a) MOL 0 100 200 300 400 500 600 700 800 1 21 41 61 81 Frames F ra m e T im e Union 8x6 Grid 8x6 Static KD-Split (b) ASTRO
Figure 10: Overall frame times measured with the (a) MOL and (b) ASTRO models during tests with different partition algorithms.
Another interesting result is shown by comparison of our system to a single, more expensive, high-end graphics workstation. To in-vestigate this question, we executed our tests on an SGI Onyx2 with 4 195MHz processors and one InfiniteReality2 graphics pipeline (the only modification to our test application was to draw the scene graph locally in a 1024x560 window on its screen). Comparing the frame time statistics measured during these tests (rows labeled ‘SGI IR2’ in Table 10) with ones discussed previously, we see that our prototype display wall system compares favorably with a far more expensive and more tightly-coupled commercial parallel ren-dering system. The range of polygon renren-dering rates measured with our system was 700K – 1.2M polygons per second, as compared to 600K – 900K with the SGI IR2 (display list mode, independent tris and quads, RGB, smooth shaded, two infinite lights, z-buffer). Moreover, the difference in screen resolution is a factor of ten. We conclude that building a parallel rendering system comprising a net-work of commodity PCs is an attractive alternative (at least in our limited experiments), and it warrants further attention.
7
Discussion
Our investigation of PC-based parallel rendering systems is very preliminary at this point. In particular, we have made several sim-plifying assumptions to aid implementation and analysis of our pro-totype system.
First, our system is integrated into a retained-mode graphics package and utilizes scene graph data structures to sort graphics primitives and to predict rendering times. It is unclear whether these tasks can be performed effectively in an immediate-mode graphics system. In particular, transforming, projecting, and sorting indi-vidual primitives into partitioning data structures in real-time is a significant challenge.
Second, we have only developed algorithms and executed experi-ments for situations in which rendering is geometry-bound. Clearly, rasterization-bound scenes are important. In these situations, the ra-tios of fill rate to pixel I/O rates will determine the minimum depth complexity for which remote rendering is useful, and it seems best to search for tiles that balance depth complexity rather than primi-tive overlaps. Further work is required to develop such algorithms and to quantify the impact of higher overlaps in sort-first on the relative loads of geometry and rasterization processing.
Third, our implementation is based on the notion that we can predict processing times for several operations (e.g., rendering a group of primitives, reading a block of pixels, etc.). Our current prediction methods are very simple, based on estimates of the la-tency and throughput of each operation, and thus they are accurate only in “controlled” situations (e.g., rendering time predictions are usually within 10% when the system is purely geometry-bound). However, it is not clear how practical it will be to extend these simple prediction methods to more general cases containing var-ied work loads. We note that accurate predictions are more likely with sort-first than sort-middle because the system can utilize pre-computed data structures, frame-to-frame coherence, and averag-ing over groups of primitives. Nonetheless, we are investigataverag-ing dynamic scheduling algorithms that use a work queue approach to assign tiles to remote servers dynamically as others are rendered. A difficulty with this approach in our system is sequencing the tile rendering and pixel redistribution operations so that a server must not write over pixels to be projected locally in order to render a tile for a remote frame buffer.
There are many extensions that can be made to our current sys-tem. Some topics for future work include partitioning the scene graph and client processing among the servers, investigating better assignment and scheduling algorithms, developing bottom-up al-gorithms, and experimenting with different classes of tile arrange-ments (e.g., BSP, irregular mesh, etc.). We plan to investigate sev-eral alternative system designs. For instance, object-based parti-tions based on tiled sort-last seem interesting. In this case, the scene graph is partitioned into objects which are rendered into separate tiles, and overlapping tiles are composited with depth comparisons to form the final image. This approach [34] avoids overheads due to overlaps, as each primitive is rendered exactly once. But, it in-curs extra pixel read, transmit, and write overheads. For instance, with our current hardware, reading the z-buffer into memory takes around 5 times longer than reading the color buffer, and these over-heads make implementation of a high-performance sort-last system almost impossible. Hardware and software enhancements that im-prove pixel transfer performance would greatly increase the space of practical parallel rendering system designs.
8
Conclusion
In this paper, we have investigated research issues in constructing a low-cost parallel rendering system using a network of PCs to drive a multi-projector display. Our initial study is a first step towards understanding how to use the coarse-grained, sort-first approach to build a parallel rendering system for a PC cluster architecture.
We have developed and experimented with several sort-first al-gorithms to balance the rendering load across a network of PCs. Our findings are: 1) all of the proposed algorithms do better than no load balancing, 2) the GRID algorithm works reasonably well but it is sensitive to bucket sizes. The impact of overlap factors is important, which is different from the result recently reported for sort-middle, 3) the UNION algorithm can avoid the impact of over-laping factors, at the expense of a more costly partition computation and poor imbalances when few scene graph nodes fit wholly inside buckets, and 4) the KD-SPLIT algorithm leads to the least overlaps in our tests, but it requires significant pixel redistribution when the tiles are large and irregularly shaped.
With the last two load balancing algorithms, we have been able to achieve modest efficiencies in our experiments (30-70%). The result is a prototype system that is able to leverage the aggregate performance of multiple PC graphics accelerators to deliver perfor-mance comparable to high-end graphics machines, at a fraction of the cost.
References
[1] Bentley, J.L. Multidimensional Binary Search Trees Used for Asso-ciative Searching. Communications of the ACM, 18 (1975), 509-517. [2] Boden, Nanette, J., Danny Cohen, Robert E. Felderman, Alan E. Kulawik, Charles L. Seitz, Jakov N. Seizovic, and Wen-King Su, Myrinet: A Gigabit-per-Second Local Area Network, IEEE MICRO, 15(1), February, 1995, 29–36.
[3] Chen, Yuqun, Angelos Bilas,Stefanos N. Damianakis, Czarek Dub-nicki, and Kai Li, UTLB: A Mechanism for Translations on Network Interface, ASPLOS8, Oct, 1998, 193-204.
[4] Milton Chen, Gordon Stoll, Homan Igehy, Kekoa Proudfoot, and Pat Hanrahan, Simple Models of the Impact of Overlap in Bucket Ren-dering, 1998 Eurographics/SIGGRAPH Workshop on Graphics Hard-ware, Lisbon, Portugal, 1998, 105-112.
[5] T.W. Crockett and T. Orloff, A MIMD Rendering Algorithm for Distributed Memory Architectures, Proc. Parallel Rendering Sympo-sium, ACM Press, New York, Oct. 1993, 35-42.
[6] T.W. Crockett, Parallel Rendering, In Encyclopedia of Computer Sci-ence and Technology, Vol. 34, Supp. 19, A. Kent and J. G. Williams, eds., Marcel Dekker, 1996, pp. 335-371. Also available as ICASE Report No. 95-31 (NASA CR-195080), April 1995.
[7] Michael Cox, Algorithms for Parallel Rendering, Ph.D. thesis, De-partment of Computer Science, Princeton University, May, 1995. [8] Michael Cox, Architectural Implications of Hardware-Accelerated
Bucket Rendering on the PC, 1997 SIGGRAPH/Eurographics Work-shop on Graphics Hardware, Los Angeles, CA, 1997, 25-34. [9] Cruz-Neira, Carolina, Daniel J. Sandin and Thomas A. DeFanti,
Surround-screen Projection-based Virtual Reality: The Design and Implementation of the CAVE, Computer Graphics (SIGGRAPH 93), 1993, 135-142.
[10] D. Ellsworth, A New Algorithm for Interactive Graphics on Multi-computers, IEEE Computer Graphics and Applications, Vol 14, No. 4, July 1994, 33-40.
[11] J. Eyles, S. Molnar, J. Poulton, T. Greer, A. Lastra, N. England, and L. Westover, PixelFlow: The Realization, Proceedings of the 1997 Sig-graph/Eurographics Workshop on Graphics Hardware, Los Angeles, CA, Aug. 3-4, 1997. Pages 57-68.
[12] H. Fuchs, John Poulton, John Eyles, Trey Greer, Jack Goldfeather, David Ellsworth, Steve Molnar, Greg Turk, Brice Tebss, and Laura Is-rael, Pixel-Planes 5: A Heterogeneous Multiprocessor Graphics Sys-tem Using Processor-Enhanced Memories, Computer Graphics (SIG-GRAPH 89), 23, 3, July 1989, 79-88.
[13] Funkhouser, Thomas A., and Carlo H. S´equin. Adaptive Display Al-gorithm for Interactive Frame Rates During Visualization of Com-plex Virtual Environments. Computer Graphics (SIGGRAPH ’93), 27, 247-254..
[14] T. Funkhouser, Coarse-Grained Parallelism for Hierarchical Radios-ity Using Group Iterative Methods, Computer Graphics (SIGGRAPH 96), August 1996.
[15] Peter N. Glaskowsky, Advanced 3D chips show promise, Micropro-cessor Report, 11, 8, June, 1997, 5-9.
[16] C. Grietsen and J. Petersen, Parallel Volume Rendering on a Network of Workstations, IEEE Computer Graphics and Applications, 13, 6, November 1993, 16-23.
[17] Jeremy Hubbell, Network Rendering, Autodesk University Source-book, Vol. 2, Miller Freeman, 1996, 443- 453.
[18] M. Kaplan and D.P. Greenburg, Parallel Processing Techniques for Hidden Surface Removal, Computer Graphics (SIGGRAPH 79), 13, 2, July, 1979, 300-307.
[19] K.L. Ma, J.S. Painter, C.D. Hansen, and M.F. Krogh, Parallel Volume Rendering Using Binary-Swap Compositing, IEEE Computer Graph-ics and Applications, 14, 4, July 1994, 59-68.
[20] S. Molnar, Image-Composition Architectures for Real-Time Image Generation, Ph.D. thesis, University of North Carolina at Chapel Hill, October, 1991.
[21] S. Molnar, J. Eyles, and J. Poulton. PixelFlow: High-Speed Render-ing UsRender-ing Image Composition, Computer Graphics (SIGGRAPH 92), July 1992, 231-240.
[22] S. Molnar, M. Cox, D. Ellsworth, H. Fuchs, A Sorting Classification of Parallel Rendering, IEEE Computer Graphics and Applications, Vol 14, No. 4, July 1994, 23-32.
[23] J.S. Montrym, D.R. Baum, D.L. Dignam, and C.J. Migdal, Infinite-Reality: A Real-Time Graphics System, Computer Graphics (SIG-GRAPH 97), August 1997, 293-303.
[24] Carl Mueller, The Sort-First Rendering Architecture for High-Performance Graphics, Computer Graphics, ACM SIGGRAPH Spe-cial Issue on 1995 Symposium on Interactive 3-D Graphics, April 1995.
[25] Carl Mueller, Hierarchical Graphics Databases in Sort-First, Proceed-ings of the IEEE Symposium on Parallel Rendering, 1997, 49-57 [26] F. I. Parke, Simulation and Expected Performance Analysis of
Mul-tiple Processor Z-Buffer Systems, Computer Graphics (SIGGRAPH 80), 14, 3, July 1980, 48-56.
[27] Pixar, PhotoRealistic RenderMan Toolkit, 1998.
[28] Raskar, Ramesh, Greg Welch, Matt Cutts, Adam Lake, Lev Stesin, and Henry Fuchs, The Office of the Future: A Unified Approach to Image-Based Modeling and Spatially Immersive Displays, Computer Graphics (SIGGRAPH 98), 1998.
[29] Raskar, Ramesh, Matt Cutts, Greg Welch, and Wolfgang Sturzlinger, Efficient Image Generation for Multiprojector and Multisurface Dis-plays, Proc. 9th Eurographics Workshop on Rendering, June, 1998. [30] R.J. Recker, D.W. George, and D.P. Greenberg, Acceleration
Tech-niques of Progressive Refinement Radiosity, Computer Graphics (Proceedings of the 1990 Symposium on Interactive 3D Graphics), 24, 2, March 1990, 59-66.
[31] Regan, Matthew, and Ronald Post, Priority Rendering with a Virtual Reality Address Recalculation Pipeline, Computer Graphics (SIG-GRAPH ’93), 27, 155-162.
[32] D.R. Roble, A Load Balanced Parallel Scanline Z-Buffer Algorithm for the iPSC Hypercube, Proc. Pixim 88, Hermes, Paris, France, Oc-tober, 1988, 177-192.
[33] Bengt-Olaf Schneider, Parallel Rendering on PC Workstations, In-ternational Conference on Parallel and Distributed Processing Tech-niques and Applications (PDTA98), Las Vegas, NV, 1998.
[34] Silicon Graphics, Inc., Monster Mode,
http://www.sgi.com/developers/marketing/forums/realmonster/, 1999.
[35] S. Upstill, The Renderman Companion, Addison-Wesley, Reading, MA, 1989.
[36] Wei, Bin, Douglas Clark, Ed Felten, Kai Li, and Gordon Stoll, Perfor-mance Issues of a Distributed Frame Buffer on a Multicomputer, The 1998 Eurographics/SIGGRAPH Workshop on Graphics Hardware, Lisbon, Portugal, 1998.
[37] D.S. Whelan, Animac: A Multiprocessor Architecture for Real-time Computer Animation, Ph.D. dissertation, California Institute of Tech-nology, Pasadena, CA, 1985.
[38] S. Whitman, Multiprocessor Methods for Computer Graphics Ren-dering, A.K. Peters, Wellesley, MA, 1992.
[39] S. Whitman, Dynamic Load Balancing for Parallel Polygon Render-ing, IEEE Computer Graphics and Applications, Vol 14, No. 4, July, 1994, 41-48.
horse.ps
(c) HORSE: Tesselated curved surface. (730 nodes, 48,688 polygons)
digram.ps
(d) MOL: Molecule with spheres and cylinders. (1,118 nodes, 89,900 polygons)
astro.ps
(a) ASTRO: Hydrogen density iso-surface. (569 nodes, 164,922 polygons)
csb5f.ps
(b) BLDG: Architectural model with furniture. (2,981 nodes, 265,032 polygons)