Advances in integrative statistics for logic programming
Nicos Angelopoulos1,e, Samer Abdallahf, Georgios Giamase aWelcome Trust Sanger Institute, Hinxton, CB10 1SA, UK bDepartment of Surgery and Cancer, Imperial College, London, UK cDepartment of Computer Science, University College London, UK
We present recent developments on the syntax ofReal, a library for interfac-ing two Prolog systems to the statistical languageR. We focus on the changes in Prolog syntax within SWI-Prolog that accommodate greater syntactic inte-gration, enhanced user experience and improved features for web-services. We recount the full syntax and functionality of Real as well as presenting a full application and sister packages which include Prolog code interfacing a number of common and useful tasks that can be delegated toR. We argue thatRealis a powerful extension to logic programming, providing access to a popular statisti-cal system that has complementary strengths in areas such as machine learning, statistical inference and visualisation. Furthermore,Real has a central role to play in the uptake of semantic web, computational biology and bioinformatics as application areas for research in logic programming.
Advances in integrative statistics for logic programming
Nicos Angelopoulos1,e, Samer Abdallahf, Georgios Giamase dWelcome Trust Sanger Institute, Hinxton, CB10 1SA, UK eDepartment of Surgery and Cancer, Imperial College, London, UK
fDepartment of Computer Science, University College London, UK
1. Introduction
Real [4] is a low level interface between Prolog and R [14]. It enables the user to call R functions on Prolog data and communicate the results back to the logic system. The library works on two open source systems: YAP [6] and SWI-Prolog [25]. This is possible as YAP has a fairly complete emulation of SWI’s C language interface [23]. Since its first introduction Real has evolved and has exerted some influence in advances to Prolog syntax. Furthermore, it has been used in a number of projects and in the process acquired a number of sister libraries. These libraries deliver Prolog predicates to useful tasks that can be best be dealt by existingRcode. Real has thus be shown to be a useful and well integrated Prolog library that can provide access to the wealth of open source code available inR.
Here we focus on describing the full syntax ofReal 2 and its role in recent developments with syntactic changes in SWI-7. The changes in both systems have made the integration ofRcode into Prolog more natural and unobtrusive. Changes in the library itself had to be made to accommodate transition to the new Prolog syntax while preserving compatibility with traditional implementa-tions. It is thus the case that the Real can be used in both of the supported Prolog systems, but only SWI-Prolog benefits from the new tighter integration. Rhas a huge array of contributed code often accompanying published papers. It has particular strengths in statistical inference [19, 8], machine learning [11, 9] and data visualisation [20]. Within the specialist area of bioinformatics, Bioconductor [7] is a large agglomerating project that manages a large number of additional, user-contributed libraries.
Real gives access toRlibraries that can complement Prolog’s weaknesses in areas such as statistical inference and visualisation. With the library installed, it is straight forward with a basic grasp ofRto call its functions on Prolog data. However, for users with no prior exposure toRthere still might be a barrier. To address this, and in order to increase general usability of the library a number
of sister packages have been developed. We highlight some of the predicates that enable access toRcode without any knowledge ofR.
Central application areas since the inception ofRealhas been these of seman-tic web, bioinformaseman-tics and computational biology. In this paper we describe the role ofRealin a web-based application as well as presenting sister libraries that here have evolved for addressing real world bioinformatics tasks in the context of a variety of projects: [27, 12, 16]. The main thesis of this paper is that Prolog can play a central role as a unifying platform in research in statistical and prob-abilistic areas such as web reasoning and bioinformatics, taking advantage of its strong grip on knowledge representation and reasoning and in combinations with recent advances withReal and web programming [24, 10].
2. Real
In this section we describe the main features ofReal and the innovations in the new versionReal 2, which include: syntactic extensions that allowR code to be represented in a form that more closely resembles normal R syntax, the new predicater library/1, which provides a more flexible way to locate and load Rlibraries from their local filestore, and support for multiple Prolog threads to use a singleR session, allowingReal to be used in SWI-Prolog’s multithreaded web server framework. Taken together, these innovations allow a tighter and smoother integration ofR code and enable Prolog programmers to tap in the wealth of statistical functions implemented inRwith greater ease.
2.1. Real’s predicates
Real 2 adopts the convention of a uniform prefix to all the library predicates. The full list of Real’s predicates along with the associated operators and brief descriptions is shown in Table 1. New additions include a hookable locator for Rlibraries, web server support, intuitive syntax for non-destructive assignment and a new interface predicate for mixing Prolog andRoptions with options for directing output to graphical devices.
With the new predicater library/1 users can load the standard R libraries in their local installation. In addition, the predicate can be directed to user specified locations where local, possibly, changed sources of such libraries can be preferentially loaded inReal. The flexibility allows for (a) specific code to be loaded only known toReal thus leaving the remainder of theR installation intact, and (b) user code that can be made available and can work either with the distributed version while having extra functionality when used with the altered sources.
2.2. Basic operation
The bulk of the interaction with Real is via a single predicate←/2 which is also defined as an infix operator. It is similar to the Prolog is/2 operator, except that the term on the right-hand side is interpreted as an R expression and evaluated in the embedded R session. Within Real, ←/2 can be used
Indicator Operator Symbol Description
r/2 <- ← evaluateRexpression and assign result r/1 <- ← evaluateRexpression and ignore result r new/1 <<- argument is a freshRvariable
/2 <<- r/2 but with error if R variable exists r call/2 <-C++O ←++ r/{1,2}with options (O)
r library/1 load Rlibrary in a hookable manner
r start/0 start the connection toR
r stop/0 stop the connection toR
r remove/1 removeR variable
r thread loop/0 start anRthread server
r serve/0 serve allR expressions on queue thread
Table 1: Library’s main predicates
to transfer data between R and Prolog, to applyR functions to Prolog data, retrieveR values as Prolog data, and destructively assigning values to R vari-ables. Disambiguation clearly distinguishes the different modes, which can be summarised by:
−PlVar←+Rexpr +RAexpr←+PlData +RAexpr←+Rexpr
Disambiguation of the call modes depends on whether the right hand side (RHS) is ground and if so on its term form. When the left hand side (LHS) of the operator is a free variable, the first mode is assumed, where the value of Rexpr is passed toPlVar after it has been evaluated in R. When the RHS is a c/N term or a list then the second mode is assumed and the Prolog data term in the RHS,PlData, is transferred to the assignableR expression in the LHS:RAexpr, typically anRvariable. If none of the top two rules applies,Real passes the second argument toR for evaluation and the value assigned to the LHS term (RAexpr).
The following examples show how to: transfer Prolog data to R and back (1), transfer Prolog data toR and get the result of applying a function to the data in the newR variable (2) and demonstrating how to apply anR function on Prolog data without the use of an explicitRvariable (3).
?−a←[1,2,3], A ←a. A = [1,2,3]. (1) ?−a←[1,2,3], Mean←mean(a). Mean = 2.0. (2) ?−Mean←mean([1,2,3]). Mean = 2.0. (3)
On occasions the return value of an R expression is of no consequence. In such cases it can be ignored by using the single argument operator
←+Rexpr
The following two examples illustrate its use. The first example plots Prolog data to the current graphic display, while the second example prints the contents of anR variable (x) to the output stream.
←plot([1,2,2,4]).
←x.
2.3. Composite data objects
As already seen, Real maps an R vector to a Prolog list of objects. In addition named lists are mapped to ’=’-pair lists and matrices to either nested lists or lists of compound terms. The following two examples pass a matrix and a named list toRvariablesxand y.
?−x←[row(1,2,3),row(4,5,6)]. % same as: ?−x← [[1,2,3],[4,5,6]]. ?− ←x. [,1] [,2] [,3] [1,] 1 2 3 [2,] 4 5 6 ?−X ←x. X = [[1, 2, 3], [4, 5, 6]]. ?−y ←[a= [1,2,3],b= [4,5,6]]. ?− ←y. $a [1] 1 2 3 $b [1] 4 5 6
Through matrices and named lists, Prolog can also access data frames which are widely used inR. For instance, the values of the example data framemtcars can be passed to Prolog as a matrix represented by a list of lists.
?−Mt ←as.matrix(mtcars).
Mt = [ [21.0, 6.0, 160.0, 110.0, 3.9, 2.62, 16.46, 0.0|...], [21.0, 6.0, 160.0, 110.0, 3.9, 2.875, 17.02|...], [22.8, 4.0, 108.0, 93.0, 3.85, 2.32|...], ... ].
2.4. Session variable management
In R, assigning the result of a computation to a variable, say x, has the side-effect of changing the state of theR session, viz., binding the name ‘x’ to a new value, overwriting any binding it may have had previously. To avoid the risk of losing data in this way, we introduced operators/2 and/1 and predicater new/1, provide fresh unused variable names on demand. The first ensures that its first argument (anRvariable) did not exist prior to assigning to it some new values. The second removes its arguments from theR work-space and the third fails if its argument is already a knownR variable.
2.5. Syntax
Although Prolog’s hierarchical terms are sufficient for expressing the syntax of anyRexpression, the resulting calls toRwould not be recognisable asRcode by programmers. Real enhances the representation of R expressions by Prolog operators in order to be as close as possible toRsyntax. In previous versions of Real, four aspects ofR syntax where impossible to emulate in Prolog: the use of (‘.’) inR identifiers, the use of double quotes (‘”’) to represent strings, the invocation of functions with no arguments (‘foo()’), and accessing array elements with subscripts in square brackets (‘a[1,2]’). In these cases, Prolog operators were used to provide representations of suchR syntactic constructions:
• Operator ‘..’ was used to construct arity 2 terms to represent R identi-fiers containing a period. For example, the Prolog termmy..variablewas translated to theRidentifiermy.variable,my..variable−→my.variable).
• Operator + applied to a non numerical value resulted in a conversion from atoms and code lists to strings, +foo−→”foo”.
• With the newly, at the time, introduced block operator ‘()’ it was possible to represent theRsyntaxfoo() as the Prolog termfoo’()’,foo()−→foo’()’.
• The infix operator ‘ˆ’ was used to represent array sub-scripting with a list as the second argument, i.e.,aˆ[1,2]−→a[1,2]
WithReal in mind,SWI-7 [21] introduced extensions to Prolog syntax that allowed all of the aboveRsyntactic constructs to be parsed in Prolog, under the control of per-module Prolog flags, such asallow dot in atom(defaultfalse) and double quotes(defaultstring). Real has been adapted to utilise the new changes in a backwards compatible manner. Under YAP,Real continues to work using standard Prolog operator definitions and the old term representation, while under SWI-Prolog, users are able to take advantage of the more direct syntax enabled by the new extensions. In addition, the complexity of expressions such as those allowed in array indices has been enhanced. All of the following are now validRealsyntax mapping to the correspondingRconstructs, provided the relevant flags have been enabled.
R Real Description
a[,3] aˆ[∗,3] missing array index %*% @∗@ matrix multiplication %o% @ˆ@ outer product of arrays %~% @in@ set/list membership
!= \= not equal operator
Table 2: Syntax translations betweenRandReal.
• func.foo(a,b,c)
• write.csv(”to file.csv”,x)
• foo()
• a[1,2]
• hmrn.pass←hmrn[hmrn$’Contamination’==”PASS”,∗]
A few remaining translations, shown in Table 2 , handle R syntax that cannot be parsed directly as Prolog despite the recent syntax extensions. InR, a missing subscript denotes arrayslicing; e.g.,a[,3] is the vector obtaining by extracting the third column ofa. In Real, the missing subscript is represented by an asterisk, e.g,a[∗,3]. Similarly, certain combinations of symbols cannot be used to construct Prolog operators. Roperators mapping to these combination must be represented using variabnt Prolog operators. The mapping of such operator mappings inReal is shown in Table 2.
A final innovation at the syntactic level has been the introduction of ‘NA’ values in the interface. InR, NA values stand for not available or unknown value placeholders. Prolog does not support such values internally, but the interface enables mapping of such values within arithmetic vectors and matrices to$NaN. When passing numeric data from Prolog toRin addition to $NaN, the empty atom (‘’) is also translated toR’sNAvalue.
In summary, there are only very few instances where Real code diverges syntactically from R code. In the vast majority of cases Real code is valid R code and it is well signposted with Prolog via the use of single main operator and call: ←/2.
2.6. Handling optional named arguments
Integral to the R language design and practice is the use of options that control the details of function calls. These options are pairs of argument name to values (name=value), which might not be necessarily present at invocation. When not present, default values supplied by the function developers are used. Similarly but not as widely used, is the use of list of terms that control calls to Prolog predicates. By convention an options list is placed at the last argument
of a predicate and commonly contains a number of single arity terms. Real 2 provides a uniform way of marrying the two conventions and a flexible way of handling options addressed to Prolog predicates accessing R functions. In addition, a number of standard tasks have been incorporated to a new interface predicate:
r call(Func,Opts)
which can also be accessed as
←Func++Opts
F uncis a compound term which is translated to an R function call andOpts can be a combination of: (a)=/2 terms, which are added toF unc, (b) options controllingr call/2’s own execution and (c) Prolog style options which can in-fluence the caller’s behaviour but are ignored in theR call. The options term Optsis in general a list, but for convenience a singleton option list can be given as an non-list term. The main options forr call/2 are:
rvar(Rvar) : when given call becomes: Rvar←Fcall rmv(Rmv=false) : removesRvar after end of call
stem(Stem=real plot) : stem to use for output files outputs(Outs=false) : a list of output devices
debug(Dbg=false) : sets debug(real) for the duration of call fcall(Fcall) : returns the function call as presented toR post call(Post) : call this after the function call
The following three calls illustrate the use of the new predicate. The first example enables debug messaging during the specificRcall, the second redirects output of its plot call to a PDF file and the third passes an arbitrary argument to theRcall.
←plot([1,2,3])++debug(true).
←plot([1,2,3])++outputs(pdf).
←plot([1,2,3])++xlab= ”bespoke−x−label”.
2.7. Multithreading and performance
Ris inherently single threaded. To support the use ofReal in multithreaded applications, and particularly in web servers built with SWI Prolog’s HTTP libraries [24],Real 2 allows a single designatedRealserver thread to be started. This thread controls evaluation of allR expressions. Subsequent calls to←/1 and ←/2 from any thread are redirected to the Real server thread and the results awaited. Communication is handled synchronously using SWI Prolog queues and is transparent to the user.
The core of Real is implemented in C, providing an efficient and stable bridge which has been used to pass extremely large datasets to and fromR. In comparison to the computational power required to compute with such large
datasets the crossover time is negligible. In the following example predicate numlist/3 constructs the list of all integers appearing between its first and second arguments. Real can pass a million integers in a fraction of a tenth of a second on a modest computer (CPU at 2.30GHz) with its performance scaling linearly.
?−numlist(1,1000000,Million),time(mv←Million),length(Million,Length). % 30 inferences, 0.033 CPU in 0.033 sec (100% CPU, 483 Lips)
Million = [1, 2, 3, 4, 5, 6, 7, 8, 9|...], Length = 1000000.
?−numlist(1,10000000,TenMillion),time(mv←TenMillion).
% 118 inferences, 0.341 CPU in 0.341 sec (100% CPU, 346 Lips)
TenMillion = [1, 2, 3, 4, 5, 6, 7, 8, 9|...].
?−numlist(1,100000000,HndMillion),time(mv←HndMillion).
% 116 inferences, 3.426 CPU in 3.427 sec (100% CPU, 34 Lips)
HndMillion = [1, 2, 3, 4, 5, 6, 7, 8, 9|...],
3. Real libraries and applications 3.1. Digital Music Laboratory
The Digital Music Laboratory (DML1) is a system for doing large scale collaborative computational musicology, bringing together a collection of audio recordings and symbolic scores, their metadata, a collection of computational analysis methods, and a database of computation results. It consists of an in-formation and computation management server providing web APIs, a browser, a Javascript web application for exploration and visualisation, and a web-based programming environment, a SWISH instance [22], for more flexible, free form experimentation. The system usesReal in several ways:
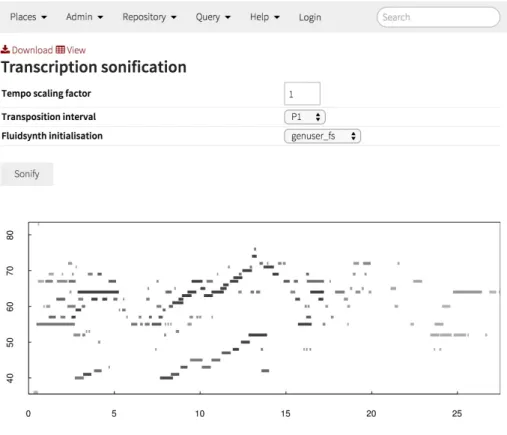
• The browser, based on the SWI Prolog Semantic Web application frame-work Cliopatria [26] usesRto produce high quality scalable vector graph-ics, such as a pitch histogram for a musical scoreor a piano-roll representa-tion of an automatic transcriprepresenta-tion2, to be included in web pages describing musical resources (see Fig. 1).
1http://dml.city.ac.uk
2http://mirg.city.ac.uk/cp/browse/list_resource?r=file://vamp/_Audio_ Analysis/Chopin/silvet_settings_fast_nonfinetune_allinstruments.n3_9d782/ 026A-1CL0016611XX-0100A0_vamp_silvet_silvet_notes.csv
Figure 1: An example ofRgraphics embedded in a web page on the Digital Music Laboratory website. This page is associated with the results of a music transcription algorithm, whose
result is visualised as a piano-roll usingR’srect()plotting function.
• The computation system usesR for doing statistical analysis on the con-tents of the database, such as music metadata or results from previous computations.
• The programming environment allows users to compose their own compu-tations, possibly usingReal for numerical analysis or generating plots. An example from DML is shown in Fig. 2 which displays part of a browser window running SWISH, with a simpleRcomputation and rendering.3 Because of the web-based, collaborative nature of the system, it is important that it be able to handle multiple concurrent requests forR computations. Thus, it uses Real’s ability to start a singeRserver thread, which then receives and serialises
3http://mirg.city.ac.uk/cp/swish/p/test_r.swinb, but please note thatR
computa-tions and graphics in the SWISH environment are restricted to logged-in users, for security reasons.
Figure 2: An example of howRcan be used inside the SWISH web-based Prolog development
environment. A SWISH ‘term rendering’ plugin is included to allow certain terms to be
recognised as plot specifications and rendered accordingly.
allR computations.
In comparison with previous versions of the system which used Matlab’s engine API to communicate with a separateMatlabprocess, via theplml package [1], the lower overhead of communicating with Real’s in-process embeddedR yields much better performance when numerous relatively small computations are required.
Graphical output from R is included in web pages or the SWISH program-ming environment ultimately as an HTML image element referring to a URL on the server that will dynamically generate the plot and return it as an SVG stream. The handler for this URL takes literal Prolog code as a parameter, checks that this code is safe to run using the SWI Prologsandbox library, runs the code to create the plot, saves the graphic in a temporary directory, and replies with the contents of the file. A simplified view of the code, which can handle several output formats, is shown in Fig. 3.
% this is the HTTP request handler r figure render(Request) :−
% ...code to extract parameters Code, Fmt, W, and H omitted... sandbox:safe goal(Code),
with temp dir(Dir, (
file name extension(tmpfig, Fmt,Filename), directory file path(Dir, Filename,Path),
with mutex(r plot, print fig(Fmt, Code,Path, [size(W,H)])),
reply file(Path, Fmt))).% sends HTTP reply with correct MIME type
% run Code and save graphic in Path in requested format print fig(Fmt, Code,Path,Opts) :−
option(size(Width,Height), Opts), dev(Fmt,Path,Width,Height,Dev),
setup call cleanup(r(Dev), once(Code),r(’dev.off()’)).
% table of R codes to create a graphics context in a given format. dev(pdf, Path,W,H,pdf(+Path,width=W,height=H)).
dev(eps, Path,W,H,cairo ps(+Path,width=W,height=H)). dev(svg, Path,W,H,svg(+Path,width=W,height=H)).
Figure 3: Simplified extract of Prolog code used to serve graphics generated inRin response
to HTTP requests.
3.2. Computational Biology
The development ofReal was strongly motivated by the pervasiveness ofR code in bioinformatics, with many of the numerous relevant R libraries being part of Bioconductor [7]. Realhas been used in a number of projects including a complete pipeline for the functional analysis of SILAC, proteomic datasets [16, 27]. Within the context of this project a number of useful components have been developed as independent Prolog libraries that allow users to tap onRgraphics andRfunctions without writing anyRcode. In what follows we describe three of these libraries. The emphasis here is to assist Prolog programmers that are not familiar with R to take advantage without having to learnR. If later on they become more familiar with the language they can take fuller advantage of RviaReal. The penetration of Prolog into bioinformatics have been also been advocated by more holistic approaches [13]. However the approach we have taken here is to take advantage of SWI’s package manager to produce a number of independent libraries that can be used in a number of application areas.
3.2.1. Basic Reallibrary
An introductory library to usingRisb real. It is based on basicR calls via Realand it contains a collection of predicates that aim to provide a Prolog based interface to a number of simple R tasks. The target audience is Prolog users that have little or no previous experience withR. Providing interface predicates
a b 0 2 4 6 as.factor(pos) 3 2 1 0 2 4 6 a b x y legend 1 2 3 main
Figure 4: ggplot2 based bar plots. Left: with default options. Right: a number of options have altered elements of the plot.
toRfunctions allows: use of untyped arguments or Prolog friendly arguments, ability to use the more familiar Prolog syntax and better control over side-effects of the calls. The predicates described here can use the basic functionality of the underlyingRfunctions and can adjust some of the behaviour entirely in Prolog, while allowing arbitrary option passing to users with some familiarity withR.
Bar plots are basic plots that can present comparative information in a in-tuitive manner. Here we present a Prolog interface toggplot2 [20]. In its most general form, the predicate gg bar plot/2 displays a number of grouped mea-surements such as, for instance, the cpu-times of a number of machine learning algorithms ran on a number of datasets. The following query, produces the plot in the LHS of Fig. 4.
?−Pairs = [a−[1,2,3], b−[2,4,6]], gg bar plot(Pairs,[ ]).
ggplot2 is a complex piece of software able to display many types of plots while gg bar plot/2 only accessing the bar plotting part. Within this, a number of plot elements can be controlled with Prolog options passed in the second argument. The following query changes elements such as the colour of the drawing pen (black) the labels (x,y and main), legend title and fill colours, producing the plot in the RHS of Fig. 4.
?−Pairs = [a−[1,2,3], b−[2,4,6]],
Opts = [geom bar draw colour(black),
fill colours([”skyblue2”,”khaki2”,”#FB9A99”]), flip(false), labels(x,y,main),
legend title(legend) ], gg bar plot( Pairs, Opts).
Maser ati Bor a Chr ysler Imper ial
Lincoln Continental Cadillac Fleetw
ood
Hor
net Spor
tabout
P
ontiac Firebird Ford P
anter
a L
Camaro Z28 Duster 360 Valiant Hor
net 4 Dr iv e AMC J a velin
Dodge Challenger Merc 450SLC Merc 450SE Merc 450SL Honda Civic To yota Corolla Fiat 128 Fiat X1
− 9 F err ar i Dino
Lotus Europa Merc 230 Volv
o 142E
Datsun 710 Porsche 914
−
2
To
yota Corona Merc 240D Mazda RX4 Mazda RX4 W
ag Merc 280 Merc 280C horsepower displacement 100 200 300 400
Figure 5: Heatmap generation with aheatmap() from package NMF.
Heatmap drawing functions are ubiquitous in R. b real provides an inter-face to the aheatmap function. In addition to some simple option mapping aheatmap/2 provides polymorphic support for the first argument which could be a matrixR variable or a Prolog representation of one. The following code uses themtcarsexample dataset, from which it plots a heatmap of two variables: hp(horsepower) anddisp(displacement).
?−MtC ←as.list(mtcars), memberchk(hp=HP,MtC), memberchk(disp=Disp,MtC),x←[HP,Disp], rownames(x)←c(”horsepower”,”displacement”),
←aheatmap(x).
3.2.2. Weighted graphs
R has a number of plotting functions for drawing graphs formed of nodes and edges. Two of these areigraph() andqgraph(). The latter being based on the former with some extra options and facilities for grouping nodes. The Prolog packwgraphprovides a uniform Prolog interface to these twoRlibraries. A plot with the default renderings can be easily drawn from a list representing the graph connections and the weights on the edges:
?−G = [1−2:200, 2−3:400, 2−4:300], wgraph plot(G,[ ]).
A set of Prolog options that control the choice of the drawing function and basic parameters of the graph, and which work irrespective of the drawing function can be provided in the second argument of wgraph plot/2. In the following exampleigraph() is passed the size of nodes to use, the degree at which the node labels should be displayed and the distance of the label from the node edge. The resulting graph is shown in the RHS of Fig. 6.
1 2 3 4 ● ● ● ● 1 2 3 4
Figure 6: Graphs generated bywgraph plot/2. Left: plot uses default rendering withqgraph()
call. Right: render changed toigraph()and a number of options specialised the output.
?−G = [1−2:200, 2−3:400, 2−4:300], Opts = [plotter(igraph),
label distance(−1), label degree(2), node size(4) ], wgraph plot(G,Opts ).
Weighed graphs are a popular means of displaying biological information such as protein-protein interactions. Databases such as String [17] hold inter-action relations over proteins that are either experimentally verified or inferred algorithmically. Depending on the strength of the evidence and corroborating sources, String assigns a degree of belief (0,999) on each possible edge. Given a set of proteins or genes it is thus possible to visualise their inter-connectivity in Stringas weighed graphs with the width of the edges proportional to the degree of belief on the edge’s existence. TheGene Ontology(GO, [18]) annotates genes with a number of terms that belong in one of the ontology’s three categories: cellular component, molecular function and biological process. By combining GO and String we can visualise the physical interactions between genes in a GO term as a weighed graph.
Prolog predicates for both GO andString are provided bybio db [3]. This library implements predicates that map database tables from a number of cu-rated databases to a single library relation. For demonstrating wgraph’s ca-pabilities two predicates are of interest: map gont gont symb(GOterm,Symbol) is the set membership relation of Symbols to gene ontology terms (GOterm). edge string hs symb(Symbol1,Symbol2,Weight) holds theStringdefined gene in-teractions with an associated belief measure (Weight). Having access to these predicates and with Prolog’s powerful search execution model graphs that show the interactions of genes within a GO term can be constructed and easily visu-alised withwgraph. An example of such a network is shown in 7 . The code for
● ● ● ● ● ● ● ● ● ● ● ● ● ● ● ● ● ● ● ● ● ● ● ● ● ● ● ● ● AMBRA1 ATG14 CCL19 CCL21 CCR7 CDC42 EPHA8 ERBB4 FGF2 FGFR3 FGR FLT1 FLT3 IRS1 KIT LYN NOD2 PDGFB PDGFRA PDGFRB PIK3R4 PTK2 PTK2B RAC1 SH3GLB1 TEK TGFB1 VAV2 VAV3
Figure 7: Weighed graph for gene ontology term, GO:0043552,positive regulation of
phos-phatidylinositol 3-kinase activity.
reproducing this is succinct and typical of the high level programming that can be achieved with Prolog.
?−use module(library(bio db)), use module(library(wgraph)).
?−findall( Symb,map gont gont symb(’GO:0043552’,Symb),Symbs), findall( Symb1−Symb2:Weight, (
member(Symb1,Symbs), member(Symb2,Symbs),
edge string hs symb(Symb1,Symb2,Weight) ),
Graph), wgraph plot(Graph).
● ● ● ● ● ● ● ● ● ● ● ● ● ● ● ● ● ● ● ● 1 y ear A UC Falsehood Truism 0.5 0.6 0.7 0.8 0.9 1.0
1 year AUC for falsehood vs truism models
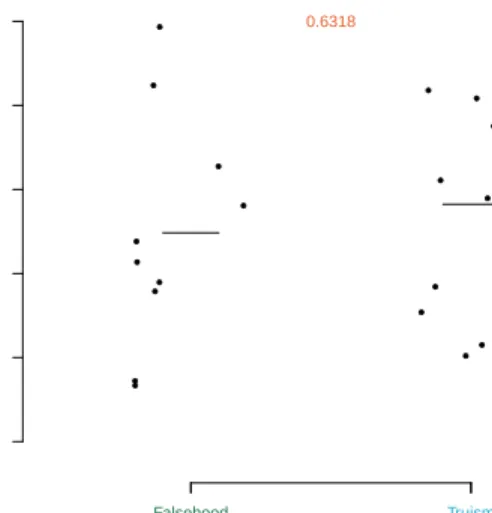
0.6318 AUC(1Y) 0.748434 0.782354 Harrel's C 0.803572 0.87547 R square 0.865959 0.883581
Figure 8: Comparative performance of two simple learners. The first comparative metric is
used to plot the dots where any additional metrics are averaged over theKfolds and displayed
on the right edge.
3.2.3. Machine learning utilities
Machine learning utilities,mlu, is a collection of machine learning predicates that allow users to run machine learning experiments and predictors on the learned models. The library does not implement the learners themselves but deals with tasks such K-fold cross validation and plotting of predicted values that allow evaluation of performance for a number of algorithms. The learners themselves can be either other Prolog predicates such as Aleph (pack(aleph), [15] and Bims (pack(bims), [2]) or one of the plethora of R machine learning and statistical inference functions. The following code declares two determin-istic learners,truism/2 and falsehood/2, which always learnt$$rue andf$$alse respectively. We then define predictors that generate 4 measures of accuracy for each model. In this example the predictors are based on random values that are biased by the type of input model withtruemodels fairing slightly better. Using k fold comparative statistic/6 a number of learners can be compared by running each learner on the same K fold exhaustive partition of the data and obtaining performance statistics. The predictions can then be tabulated or plotted for visual comparison of performance. Figure 8 shows a comparative plot of the performance for the two simple learners presented below. In the plot, the first predictive value is used to draw juxtaposed dots on a scatter plot with all additional predictive measures averaged over the 10 folds and displayed as mean values on the right ledger of the plot.
truism( ,true). falsehood( ,false).
bias(false,Data,c(Rnd,Rnd,Rnd2,Rnd3)) :− random(0.5,1,Rnd),
random(0.65,1,Rnd2), random(0.7,1,Rnd3).
bias(true,Data,c(Rnd,Rnd,Rnd2,Rnd3)) :− random(0.6,1,Rnd),
random(0.75,1,Rnd2), random(0.8,1,Rnd3).
?−numlist(1,10,Data),
Learners = [falsehood,truism], Predictor= bias,
Opts = [post(jitter),
statistic names([’1 year AUC’,’AUC(1Y)’,’Harrel\’s C’,’R square’]) ],
k fold comparative statistic(Data,Learners,Predictor,Ms, Sts,Opts). Although the example given here is a simple one, similar analysis can be ap-plied to a variety of learning contexts such as survival analysis (for example with thecoxph() function) where metrics such as AUC for 1 year survival, Harrrel’s concordance index andR2 can be used to document the relevant performance of alternative learners. We also plan to include bootstrapping inmlualong with more comparative plots.
3.3. Availability
The four libraries discussed here: Real,b real,wgraphandmluare available as SWI-Prolog packages4which can be installed easily from within SWI-Prolog. To download and installReal the user needs to query with:
?−install pack(real).
More information including documentation and full sources are available from the project’s home page 5. These libraries have been developed in the context of Prolog based bioinformatics [3, 5] but are made available as stand alone libraries as they can be of use in a variety of other application areas. The package manager enables easy installation and a central point at which user-contributed libraries can be found.
4http://swi-prolog.org/pack/list 5
4. Conclusions and Future Work
We presented a number of recent advances inReal and we have shown how developments in Prolog syntax allow R calling code to blend naturally into Prolog code. The resulting syntax provides a powerful platform for accessing the extensive collection of open source R code. As a result, Real can have a strong positive influence onto the penetration of Prolog to new application areas such as bioinformatics and the semantic web. With version 2,Real has reached a new level of maturity including facilities for using R in web-servers. In addition, we highlighted predicates from sister packages. As withReal itself, these are freely available and can be easily installed via the SWI-Prolog package manager. In the future we plan to work towards suggesting internal ways for Prolog to work better, or more confluent toR, with NAvalues and infinity.
With regard to web applications, the R server thread serialisesR compu-tations at the level of individual calls to the embeddedR API. This is fine for ‘pure’ functional operations that have no side effects, that is, do not change the state of the R session nor do any input or output. However, it is still possi-ble for operations that require several calls with side-effects to impede on each other’s operation. This is the case for graphical plots that involve several steps, each of which may add elements to a plot, before the final step of writing the resulting image to a file. If two threads attempted to create two such plots concurrently, the single graphics window would become corrupted. The DML server described above avoids this by using an SWI Prolog mutex to protect the R graphics HTTP request handler, essentially turning the entire plotting sequence into an atomic operation. Another, possibly more elegant solution not requiring a mutex, would be to allow the R server thread to receive requests to execute Prolog goals, rather than just atomicR computations. This would allow each Prolog goal, including multiple calls toR, to complete atomically, safe in the knowledge that no other R computations will intervene. Current work by the developers of SWISH [22], the on-line portal for SWI-Prolog, con-centrates on : (a) isolating interactions for each distinct user, (b) capturing the input/output of the underlyingRsessions, and (c) confiningRto a safe subset, such as say to disallowing operating system interactions.
Realhas been used in a number of projects in the areas of web programming and bioinformatics, and has a steady stream of downloads via SWI-Prolog’s package manager. With the enhanced level of integration, Real is becoming a powerful hybrid programming language, which combines the clear computa-tional model of Prolog with the powerful statistical code base ofR.
Acknowledgements
We would like to thank Jan Wielemaker, main developer of SWI-Prolog, for technical advice, and for providing a robust, open source Prolog, as well as for comments on earlier drafts of this paper. We also thank V´ıtor Santos Costa for earlier and continuing support to the development ofReal and the anonymous reviewers for their insightful observations.
References
[1] Samer Abdallah. plml: Prolog-Matlab bridge, 2015. http://www. swi-prolog.org/pack/list?p=plml.
[2] Nicos Angelopoulos and James Cussens. Bayesian learning of Bayesian networks with informative priors. Journal of Annals of Mathematics and Artificial Intelli-gence, 54(1-3):53–98, 2008.
[3] Nicos Angelopoulos and Georgios Giamas. A logical approach to working with biological databases. InInternational Conference of Logic Programming, Cork, Ireland, September 2015. Technical communication.
[4] Nicos Angelopoulos, V´ıtor Santos Costa, Jo˜ao Azevedo, Jan Wielemaker, Rui Camacho, and Lodewyk Wessels. Integrative functional statistics in logic pro-gramming. InProc. of Practical Aspects of Declarative Languages, volume 7752 ofLNCS, pages 190–205, Rome, Italy, Jan. 2013.
[5] Sander Canisius, Nicos Angelopoulos, and Lodewyk Wessels. ProSQLite: Prolog file based databases via an SQLite interface. In Proc. of Practical Aspects of Declarative Languages, volume 7752 ofLNCS, pages 222–7, 2013.
[6] V´ıtor Santos Costa, Ricardo Rocha, and Lu´ıs Damas. The YAP Prolog system. Theory and Practice of Logic Programming, 12:5–34, 1 2012.
[7] Robert C. Gentleman, Vincent J. Carey, Douglas M. Bates, and others. Biocon-ductor: Open software development for computational biology and bioinformat-ics. Genome Biology, 5:R80, 2004.
[8] Robert Tibshirani Jerome Friedman, Trevor Hastie. Regularization paths for generalized linear models via coordinate descent. Journal of Statistical Software, 33:1–22, 2010.
[9] Alexandros Karatzoglou, Alex Smola, Kurt Hornik, and Achim Zeileis. kernlab – an S4 package for kernel methods in R. Journal of Statistical Software, 11(9): 1–20, 2004.
[10] Torbj¨orn Lager and Jan Wielemaker. Pengines: Web logic programming made easy. InInternational Conference of Logic Programming, 2014.
[11] Andy Liaw and Matthew Wiener. Classification and regression by randomforest. R News, 2(3):18–22, 2002.
[12] David MacIntyre, Manju Chandiramani, Yun S Lee, Lindsay Kindinger, Ann Smith, Nicos Angelopoulos, Benjamin C. Lehne, Shankari Arulkumaran, Richard Brown, Tiong Ghee Teoh, Elaine Holmes, Jeremy K. Nicholson, Julian Marchesi, and Phillip R. Bennett. The vaginal microbiome during pregnancy and the post-partum period in a european population. Scientific Reports, 5:Article number: 8988, 2015.
[13] Chris Mungall. Experiences using logic programming in bioinformatics. InLogic Programming, pages 1–21. Springer Berlin Heidelberg, 2009.
[14] R Core Team. R: A Language and Environment for Statistical Computing. R Foundation for Statistical Computing, 2016. http://www.R-project.org/. [15] Ashwin Srinivasan. The Aleph Manual. University of Oxford, 2004.
[16] Justin Stebbing, Hua Zhang, Yichen Xu, Grothey Arnhild, Ajuh Paul, Nicos Angelopoulos, and Georgios Giamas. Reprogramming of the tyrosine kinase-regulated proteome in breast cancer by combined use of RNAi and SILAC quan-titative proteomics. Molecular & Cellular Proteomics, 14(9):2479–92, 2015. [17] Damian Szklarczyk, Andrea Franceschini, Stefan Wyder, Kristoffer Forslund,
Da-vide Heller, Jaime Huerta-Cepas, Milan Simonovic, Alexander Roth, Alberto San-tos, Kalliopi P. Tsafou, Michael Kuhn, Peer Bork, Lars J. Jensen, and Christian von Mering. String v10: proteinprotein interaction networks, integrated over the tree of life. Nucleic Acids Research, 43(D1):D447–D452, 2015.
[18] The Gene Ontology Consortium. Gene ontology: tool for the unification of biol-ogy. Nature Genetics, 25(1):25–9, May 2000.
[19] Terry Therneau. A Package for Survival Analysis in S, 2015. version 2.38. [20] Hadley Wickham.ggplot2: elegant graphics for data analysis. Springer New York,
2009. ISBN 978-0-387-98140-6. http://had.co.nz/ggplot2.
[21] Jan Wielemaker. SWI-Prolog ODBC interface, 2014. http://www.swi-prolog. org/pldoc/package/odbc.html.
[22] Jan Wielemaker. SWISH: SWI-Prolog for SHaring, 2015. http://swish. swi-prolog.org/.
[23] Jan Wielemaker and V´ıtor Santos Costa. On the portability of Prolog applica-tions. InPractical aspects of Declarative Languages, pages 69–83, 2011.
[24] Jan Wielemaker, Zhisheng Huang, and Lourens van der Meij. SWI-Prolog and the Web. Theory and Practice of Logic Prog., 8(3):363–92, 2008.
[25] Jan Wielemaker, Tom Schrijvers, Markus Triska, and Torbj¨orn Lager. SWI-Prolog. Theory and Practice of Logic Programming, 12(1-2):67–96, 2012. [26] Jan Wielemaker, Wouter Beek, Michiel Hildebrand, and Jacco van Ossenbruggen.
Cliopatria: A SWI Prolog infrastructure for the Semantic Web. Semantic Web Journal, pages 1–13, 2015.
[27] Hua Zhang, Nicos Angelopoulos, Yichen Xu, Arnhild Grothey, Joao Nunes, Justin Stebbing, and Georgios Giamas. Proteomic profile of KSR1-regulated signaling in response to genotoxic agents in breast cancer. Breast Cancer Research and Treatment, 151(3):555–568, June 2015.