Debt and Intiernational Finance International Economics Department
The World Bank February 1990
WPS 355
The Evolution
of Credit Terms
An Empirical Study of Commercial
Bank Lending to Developing Countries
SOle
Ozier
The spreadson bank loans todevelopingcountries between 1968
and 1981 were far higher for countries with no loan experience
than for countries with good nondefault records. The cost and
difficulty of assessing risk with new borrowers suggests a
greater fact-finding and fact-dissemination role for international
organizations.
The Policy. Research, and External Affairs Complex distributes PRE Wodking Papers to disseminate the findings of work in progress and to encourage the exchange of ideas among Bank staff and all others intereste4 in development issues. These papers carry the names of the authors, reflect only thetr views, and should be used and cited accordingly. The Findings, interpretations, and conclusions are the authors' own. They should not be attributed to the World Bank, its Board of Directors, its management, or any of its member countries.
Public Disclosure Authorized
Public Disclosure Authorized
Public Disclosure Authorized
This paper - a product of the Debt and Intemational Finance Division, Intemational Economics
Depart-ment- is partof a largereffort in PRE to investigate the determinants of the terns, conditions, and volume of private-source international financial flows to developing countries. Other related work under way includes a review of the determinants of thc volume and destination of foreign direct investment from Gernany and Japan, a study of portfolio investment in developing countries, and a study of the determinants of commercial bank decisions in menu-based rescheduling and debt reduction exercises. Copics of this paper are available free from the World Bank, 1818 H Street NW, Washington DC 20433. Please contact Sheilah King-Watson, room S8-025, extension 31047 (31 pages with figures and tables).
Ozler studied changes in spreads on bank loans ing information about borrowers and the
lend-to developing countries during 1968-81. ers' inability to distinguish different types (t
borrowers in advance. Indeed, intemational
She found that a borrower's experience had institutions have been doing more of this
fact-a significfact-ant impfact-act on sprefact-ads. Sprefact-ads stfact-arted finding since the onset of the debt crisis.
at high values at low levels of loan experience
and decreased as experience increased. Spreads The study was based on loan-.evel data for
at initial-experience levels were about 30 per- 1968-81, when the Eurocunrency market was
cent above benchmark rates and declined to the expanding. Data on renegotiated loans were not
benchmark, with experience. The impact of ex- used. The results are robust to a number of
perience became negligible with 30 prior loans. altemative specifications. They are not a
consequence of the behavior of spreads over
Ozler suggests a greater role for intema- calendar time, but are robust with altemative
tional organization, in collecting and dissemi- definitions of experience variables and
altema-nating infortation about potential borrowers - tive functional forms.
because of the high initial fixed cost of
collect-The PRE Working Paper Series disseminates the findings of work under way in the Bank's Policy, Research, and External Affairs Complex. An objective of the scries is to get these findings out quickly, even if presentations are less than fully polished. The findings, interpretations, and conclusions in these papers do not necessarily represent official policy of the Bank.
by Sule Ozler*
Table of Contents
I. Introduction 1
II. Empirical Issues 4
A. Experience and Spread: A Cursory Look at the Data 4
B. Methodology 5
1. Credit Terms in the Eurocurrency Market 5 2. Credit Terms and Experience with the Borrowers 8
C. Data 9
1. Sources and Discussion of Variables 9
2. The Experience Variable 11
III. Results 12 IV. Conclusions 16 Footnotes 18 Appendix 23 References 26 Figures 28
* I thank Bhagwan Chowdhry, Daniel Cohen, Albert Fishlow, Jeff ry Frieden, Robert Kahn, Richard Kohl, and especially Edward E. Leamer for helpful comments and stimulating conversations. I have also benefitted from comments of the seminar participants at Stanford University, UC Berkeley, UCLA, UC San Diego, USC, Federal Reserve Bank of New York, the World Bank's International Debt Division, and participants at the All UC Economic History Conference. Funding from ISOP at UCLA and from the World Bank's International Debt Division are gratefully acknowledged.
I. Introduction
The developing country debt crisis of the last decade has raised a number of questions related to the pricing of loans, such as whether the lenders considered the economic conditions of the borrowers, or their historical repayment record, in setting the terms on loans. In fact ic has been empirically demonstrated that the rates charged on developing country loans reflected both the economic condition of the borrowers and their historical repayment record (For applications concerning the loans in 1970 see Feder and Just (1977), Edwards (1984), 6zler (1988a); for a study of
loans in 1930s see Eichengreen and Portes (1986)). None of these studies, however, have explicitly considered that each borrower after initially entering the market, typically borrowed repeatedly thereafter. Did the repeated experience of a borrower affect the evolution of credit terms in
the Eurocurrency markets? Did the rates borrowers contracted in their initial loans differ systematically from the rates contracted later in the same market? The purpose of this study is to provide empirical answers to these questions.
Early empirical studies on credit terms primarily focused on the relation between spreads (the difference of the interest rate charged to a country and the base interest rate) and various economic indicators of the borrowers that presumably reflect their default risk (see Feder and Just
(1977), Edwards (1984, 1986)).' A menu of variables, such as investment to GNP ratio, debt service to exports ratio, rate of inflation, GNP growth, have been considered to measure default risk. It has been demonstrated that annual average spreads contracted with countries reflect various measures of default risk r;onsidered.2 These earlier empirical studies are based on mod-els of lending where rational lenders are assumed to operate in a perfectly
competitive market, but facing default risk (see for example Eaton and Gersovitz (1981), Cooper and Sachs (1985), Sachs and Cohen(1985)).
An attempt to determine whether repeated experience of a country had an affect on the behaviour of credit terms requires detailed information on the loan contracts signed by the countries. The data set employed contains information on commercial bank loans from Euroci.rrency credit markets. Three aspects of this data set are important to note. First, since the rates contracted in early stages of borrowing may differ from those contrac-ted later, we incorporate information on early loan contracts.3 Second, since we are concerned with the evolution of the market, and we want to avoid problems surrounding the debt crisis we limit the data to a period before the general debt crisis of 1982. Third, we do not include informa-tion on renegotiated debt. This is because we are concerned with the
operation of the Eurocurrency market for countries that have not experienced repayment difficulties on their commercial bank loans. Accordingly, we
assembled a loan level data for 55 countries during 1968 to mid-1981 (2148 bank loans). The data include information on the terms of the loan
contracts signed, as well as the month and year of the loan agreeement. A measure of repeated experience is simply defined as the cumulative number of months in which the borrower received a loan (other definitions are also
employed as will be presented later in the paper). The experience variable is distinct from a cumulative number of months over calender time since the countries in the sample have different entry dates (Chile in October 1968, Zimbabwe November 1980).
The primary finding is that the experience level of a borrower
contributes significantly to the determination of the spreads. Specifical-ly, the spreads are shown to start at rates that are higher than would be
predicted by benchmark models in which only observable economic
characteristics are accounted for (benchmark models are similar to those employed in earlier empirical studies by Feder and Just (1977) and Edwards (1984)). In particular, it is found that at initial experience levels spreads are approximately 30 percent above the rates that are predicted by the benchmark models and that the spreads decline to the benchmark rate.
An interpretation of these results can be provided by a model of reputation acquisition as developed by Diamond (1989). In his model
initially there is an observationally equivalent cohort of borrowers with no track record. There are different types of borrowers depending upon their access to risky or safe projects. Lenders inability to distinguish them leads to different types being lumped together and initially treated identically. Given the proportions of different types of borrowers in the initial period, lenders set the interest rates to receive a competitive expected return. It is assumed that default leads to a cutoff of credit and hence the class of nondefaulters is now a more select group. Accordingly the interest rates charged in the next loans is less than the initial rate and this decline continues over time for the class of nondefaulters.
One way of interpreting the experience variable employed in this study is to consider it as 'good' experience. This interpretation is consistent with the institutional details of international lending. Typically, count-ries initially borrowed from the competitive Eurocurency credit markets. If countries experienced repayment difficulties, however, they had to enter a rescheduling process. Most reschedulings typically restricted further borrowing from capital markets, and the terms on postponed loans as well as
the new loans that were part of a rescheduling agreement were negotiated between the existing creditors and the borrower. In fact, during the period
under consideration, the spreads on rescheduled loans were more than twice those on new loans.4 Our data includes information only on market loans.
Another interpratation of the empirical finding would be based on some sort of high initial cost of lending. For example, lenders may directly invest in information collection to observe the attributes of the borrowers. Assuming that gathering this information has high initial costs (and long-term debt contracts do not exist), the spreads charged are initially higher than the spreads in the absence of such costs. The incremental information required will, however, decrease as experience with a borrower accumulates. This would lead spreads to decline toward the spr'ads that would prevail in
the absence of such costs.
The paper is organised as follows: In section two, data and the method of estimation are presented, results are in section three, and summary and concluding remarks are in section four.
II. Empirical Issues
A. ExDerience and Spread: A Cursory Look at the Data
As indicated above, most developing countries borrowed repeatedly once they entered the commercial bank market. The evolution of spreads with experience is displayed in Figures 1-3, where experience is defined as the cumulative number of prior months in which the country borrowed. (The sources and the characteristics of the data are discussed in Section C). To obtain Figure 1, normalized spreads are constructed from the actual spreads, first, by dividing the actual spreads of each country by the mean spread of all loans to that country. Second, at each level of experience the average of normalized spreads across countries is calculated. Finally, these aver-ages are smoothed by an averaging routine to aid visualization.5
In this figure, two patterns are immediately noticeable. First, the spread at low levels of experience is higher than average (unity). Second, as experience increases, the spread tends to A zline, but in a very cyclical pattern.
These cyclical patterns can in fact be shown to be a coincidental consequence of the cyclical pattern of spreads over calendar time. This can be seen in Figure 2 for which spreads are constructed in the same way to those in Figure 1, except the averages are taken at each calendar time. The cycl, 'ehavior here is significantly more pronounced than in Figure 1. The dampening of the cyclical pattern in Figure 1 is of course due to countries having different entry dates to the market.
To clarify the evolution of spreads with experience, we implemented a simple procedure: a regression is run in which the spread is the dependent variable, and the only explanatory variables are the dummy variables for
each month.6 The residuals from this regression are treated in the same manner as were the spreads for Figures 1 and 2. Figure 3 displays the relation between these constructed residuals and experience.
It is quite interesting to note that the cyclical pattern apparent in Figure 1 is no longer prominent. The normalized residuals in'itally lie well above unity, declining toward it until the experience level reaches near twenty. This result in itself strongly indicates that experience plays a major role. To eliminate nther possible correlations, we next turn to a more systematic investigation o. the relation between spreads and experience.
B. Methodology
1. Credit Terms in the Eurocurrency Market
It h .s been postulated that the spreads reflect the probabilities of default of a particular country (see Feder and Just (1977), Eaton and
Gersovitz (1981), Sachs (1981) and see Eaton and Taylor (1986) for a review of others). In these formulations, however, no role for experience has been allowed. Our discussion of the existing models of spread determination will be followed by a dircussion of how we employ experience with a borrower to alter the standard specification.
Suppose that the Eurocurrency market is best described as perfectly competitive and that risk-neutral lender banks maximize expected returns by optimally choosing the spreads.7 Expected returns can be formulated as follows: First, consider the return assuming the loan is rep&id according to the contract. To formulate this suppose that a loan of amount L is made for T periods to be repaid in one installment at maturity and servi-ced at equal installments until maturity. If s is the spread then the net
revenue received each period throughout the duration of the contract is sL. Suppose that the cost of capital is i*, then discounted future revenue is expressed by (for notational convenience, the subscripts that would indicate country- and time-periods are not employed):
T
sL t _ sLq (1)
t-l (l+i*)
T
-twhere q - q(i*,T) * E (1+i*) t-l
If there is a failure to fulfill the contract, then the rate of loss is h, a random variable.
Let p(X) represent the probability that the borrower will fail to fulfill the contract, with A incorporating a set of economic indicators that determines the probability (the specification of the elements of the x° vector will be left to the data section). The market equilibrium condition
yields the following relation:
P fi (2)
71-p) q
where h - expected loss rate.
In implementing this model empirically the convention (Feder and Just (1977) and Edwards (1984)) regarding the functional form of p, has been to assume that p has a logistic form:
p J-k (2a)
1 + exp[00 + j-l 0 )
where k is the dimension of ^. Equation (2) can, therefore, easily be rewritten in the logarithmic form.
The expected loss rate in the event of default is not directly
observable. If the expected loss rate is constant over time and countries then the intercept term would capture it. To capture the variations in it across countries and over time, country- and time-specific dummy variables are incorporated. Time-specific dummy variables are also useful in captur-ing the changes in the supply conditions in the Eurocurrency markets. Hence the empirical specification of equation (2) is as follows:
k
In s
-
+
z ixj Inq + pC + tT + w
(3)j-1
where P-o + n h
C - dummy variable that is one when country is c, T - dummy variable that is one when time is t, w - error term with zero expected value.
2. Credit Terms and AN2erience with the Borrowers
Previous investigations of credit terms are based on specifications that are similar to the one discussed in the previous section, and therefore omit the contribution that repeated experience with a borrower in credit markets may have on the determination of the credit terms. Accordingly, here we modify the above specification to incorporate information about experience:
k
Xn s - + E ,xj - In q + p c + P T + I ln(1+1/X) + w (4)
i1-i
where: X - experience measured as a positi.ve integer.
Let us define ln s* as the benchmark rate that would be predicted in a model without employing the experience variable. Accordingly, if 'Y - 0 is
found, then spreads are always equal to the spreads predicted by the bench-mark model. - > 0 indicates that at low levels of experience with a
borrower, spreads are higher than the predicted rates while 7 < 0 indicates the opposite.
The choice of the above functional form for experience, i.e., a general hyperbolic form s - s* (l+l/X)I, was motivated by a number of considera-tions. First, the cursory inspection of the data as presented in Figure 3, was suggestive of hyperbolic form with I > 0. Second, we want to impose a theoretical restriction that even if the rates cont .ted may deviate from s*, as X increases the rates should come to reflect s*. Finally, the hyperbolic form lends itself to be easily estimated with a linear model.
The hyperbolic form is somewhat unsatisfactory despite lending itself to the linear form in equation (4). This is primarily because the same parameter determines the intercept as well as the slope of the experience
term. Furthermore the estimates involving the hyperbolic form will be sensitive to how the experience variable is scaled. A functional form that is not subject to these criticisms is the two parameter Pade' form:
s - s*
((+a)
- bX()
1+(b/a) X
The above form has the virtue that as X increases s/8* smoothly converges from its initial value (l+a) to the asymptotic value unity.8 (The behav-ior of these functional forms based on our estimates is presented later.)
C. DA.t
1. Sources and Discussion of Variables
Models similar to (4) and (5) are estimated, employing loan level data for the period of 1968 to mid-1981. The data incorporates information about the loans as well as borrowers' characteristics. Information on the loans consists of the identity of the borrower, the time of the loan, its terms, and some qualitative aspects such as whether the loan is public. Loans data for the 1973-81 period is obtained from the various issues of the World Bank's Borrowing in International Capital Markets. The data for the prior period, however, has been obtained through an exhaustive search of the fin-ancial press as well as the central bank reports of the borrower countries. We have included only $U.S. denominated loans that have variable interest
rates and that have LIBOR (London Interbank Offer Rate) as the base rate. These restrictions are incorporated to avoid complications that may arise from comparisons across different types of financial instruments. Further-more, the data are constrained to include borrowers that have taken at least three loans. Finally, since this paper is concerned with expansion of the market and we want to avoid problems surrounding the debt crisis, we limit the data to the period ending in mid-1981. After these restrictions, the
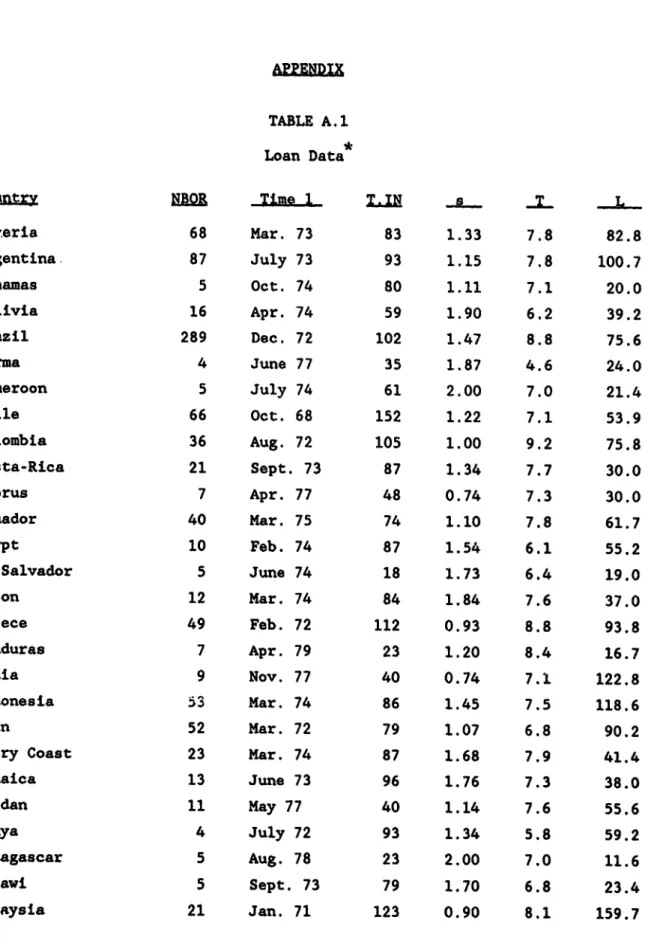
data set contains information on 2148 loans to 55 developing countries that were made betw.en 1968 and June 1981. Since much has been written on the
general nature of these loans they will not be further discussed here. How-ever, the Appendix Table A.1 contains information on some characteristics of our data.
Some information on the loars are among the elements of the _ vector in equation (4). These include maturity of the loan, a dummy variable that
indicates whether the loan is public, and finally a dummy variable that
indicates if the loan is syndicated. A possible problem could arise from the inclusion of maturity to the extent that banks determine spread and maturity simultaneously. However, based upon practices in the Eurocurrency market and the previous literature, loan maturity is assumed to be determined prior to the spread determination (see Feder and Just (1977), Edwards (1984)).
Some borrowers' characteristics are also included in the _ vector. These include information on general economic conditions of the borrower and are presumably important in measuring the riskiness of the borrower. We employed variables that are similar to the ones employed in the previous
studies of credit terms and these variables are: total debt-to-GNP ratio, debt service-to-exports ratio, reserves-to-GNP ratio, imports to GNP ratio, GNP growth, lagged value of investment to GNP ratio, rate of devaluation and
rate of inflation.9 The total debt, and debt service variables are obtained from the World Bank's World Debt Tables. The remaining variables are
obtained from IMF's International Financial Statistics.
The expected signs of these indicators have been discussed extensively in the literature ( for reviews see McDonough (1982), Eaton and Taylor (1986) and Edwards (1984)), hence we will only briefly comment on this issue. It has been suggested that total debt to GNP ratio will have a
positive sign, since it is considered as an indicator of solvency for a country (note that total debt includes the entire stock of debt, not just
the amount contracted by the commmercial banks). Liquidity problems faced by countries will be measured by the ratio of debt service to exports and it is expected that the coefficient of this variable will be positive. If reserves to GNP ratio is an indicator of the level of international liquid-ity of a country it will have a negative sign. Ratio of investment to GNP will be negatively related to spreads, since it indicates the prospects of a countries future growth. Ratio of imports to GNP is expected to have a positive sign to the extent that it measures the vulnerability of a country to outside shocks. Higher rate of growth is argued to result in lower probability of non-payment. High inflation is employed as an indicator of a larger probability of balance of payments crisis. Rate of devaluation is used to measure a country's willingness to use exchange rate adjustments to avoid balance of payments crisis.
2. The ExRerience Variable
The remaining variable, denoted X above, must provide a measure of experience. There is not an obvious unique definition, however, we have
attempted possible definitions of X that seemed reasonable, constrained by the fact that only the month, size and specific borrower are known. Accordingly, the following definitions of the experience variable X were
employed.
Xl - The cumulative number of loans to a particular borrower.
X2 - The cumulative number of months in which the borrower received a loan. X3 - Same as 1, except that loans taken in the same month are assigned the
X4 - Cumulative number of months, irrespective of whether a loan was secured in each, since the month of the first lending.
X5 - Loan amount of each loan contract to GNP ratio for a particular borrower expressed cumulatively.
X6 - Same as 2, but on a regional basis: the cumulative number of months in which any borrower in a geographic region (i.e., Latin America, Asia,
Middle East, Africa, and Europe) has received a loan.
III. Results
In this section, we present and discuss a series of estimation repults that investigate the relation between experience and spreads. First, equa-tion (4) is estimated for alternative definitions of the experience variable for the enLire sample of 1968-81, as presented in Table 1 (in all specifica-tions we employ a month specific and country specific dummy variable
structure unless otherwise noted). Second, we present a set of estimates for subsamples of the data, including only earlier periods such as 1968-76, as presented in Table 2. Third, results from estimations that also include a measure of changing competitiveness in the market are discussed. Fourth, altenative cut-off values for the experience variables are employed, as presented in Table 3. Finally, we estimate a functional form using equation
(5) and compare the results to the ones obtained from equation (4), as is presented in Table 4. The interpretation of the magnitudes obtained from these estimations are provided with the aid of Figure 4.
The estimated magnitudes and signs of the variables other than experience variable will not be discussed here, since there is already a substantial literature on them. It is, however, important to note that the findings concerning these variables are consistent with their expected signs
which were discussed in the data section. (The parameter estimates and their standard errors for one specification are in Appendix Table A.2.)10
Table 1 presents the estimation results of equation (4) employing alternative definitions of the experience variable. In this Table, Xl-X3, which are all based on counting the number of loans, are near 7 - 0.25 with large "t" values.11'12 The interpretation of this magnitude for the hyperbolic form employed is beet demonstrated in Figure 4. Figure 4 plots
s/s* by experience where s* is the benchmark rate. In this figure, when 7 - .25, at initial levels of experience the spread is 20% higher than the benchmark rate. As experience reaches near thirty, however, the spread
reaches the benchmark rate.
Estimations employing X4-X6 definitions of the experience variables are also in Table 1. X4 is estimated with a small "t" value, as well as a small parameter estimate. This result suggests that the total number of months since the borrower first borrowed in this market do not contribute to the determination of the spreads. Instead, the number of repeated trips to the lender is found significant, as is indicated by the behaviour of Xl-X3 variables.
We next investigated whether the cumulative amounts contracted in the repeated trips to borrow had an impact on the spreads. This is done by employing the X5 variable, which is created by cumulating the ratio of the
amounts contracted to GNP. Amounts are scaled with GNP prior to cumulation
so as to generate a variable that measures the relative importance of the
amount contracted for an individual borrower. As seen in Table 1, this
variable has a statistically significant impact, though the level of confidence is not large.
Finally, in Table 1, we present the results from an estimation that employs individual country experience simultaneously with an experience variable foi. ihe region (here we present results using X2 definition, though the results for other definitions are found to be similar to the ones
presented here). These results indicate that country experience continues to be important, however, the experience in the region for the period under consideration does not affect the behaviour of the spreads.
Overall, the results in Table 1 suggest that experience, measured as cumulative number of loans to a particular country and cumulative loan amount to GNP ratio, is important in affecting the evolution of spreads. In contrast, total number of months since the first loan of the country, and
the experience of the countries that are in the same geographic region have not contributed to the spreads.
Next, we investigate whether the findings in Table 1, are a consequence of the change in the competitiveness in the market. This is of concern because, it has been argued that the dramatic increased entry of new banks,
in particular after 1977, lowered the spreads.13 (The behaviour of the spreads over calendar time as presented in Figure 2, may in fact be a consequence of such change in the market.) Since we attempted to control for time effect by employing time specific dummy variables in our estima-tions, and since the borrowers in our sample have diffent entry dates, we do not expect the results discussed so far to be a mere consequence of
increased entry of banks over calendar time. However, we investigated this issue further. In particular, we restricted the sample to periods earlier than 1977. As an alternative we incorporated a proxy for competitiveness borrowers faced in the market.
In Table 2 we present results based on alternative cut-off values for the sample. Instead of employing the entire sample between 1968-mid 1981, we have used the sample for 1968-75, 1968-76 and 1968-77. These results provide further evidence that it is not the general decline of the spreads in the later part of the sample that is driving the results. Experience variables contin e to be statistically significant and important in magnititude.
As an alternative to restricting the sample to early time periods we incorporated an additional variable that proxies for competitiveness each borrower faces in the market. Specifically, the number of banks in the market is assumed to be an indicator of overall competitiveness in the market. In order to create a measure of the competitiveness a borrower
faced, we also used information on the amounts of loans. The percentage of loans made to a country in a particular year, in that market is calculated, and multiplied by the number of banks participating in the market during the
same year. The logarithm of this variable is then included in the regres-sion equations. This variable is estimated with a negative parameter, -.02, and with a "t" value of (-1.95). The remaining parameters did not show notable change. In particular, inclusion of this variable did not alter the estimated magnitude and the standard error of the experience parameter (for X2 variable the parameter estimate and the "t" value are .25 and 2.18, respectively). This result also indicates that it is not a change in the number of banks in the market that is driving the results.
In Table 3, estimations of equation (4) employing the X2 subsamples of the data are presented. Subsamples are based on the cutoff points for
the experience variable. For example, the numbers that correspond to X2 < 11 are results obtained from constraining our data to the first 10
experience of all the borrowers in our sample. Table 3 indicates that the results are sensitive to the cut-off point, such that y declines as the cut-off value increases. The systematic effect of the cutoff on
-
pointsout the weaknesses of this form for treating the observed evolution, hence we also employ the Pade' form.
In Table 4, the results from a form that employs the two parameter Pade' function (5), are presented (along with the results of equation (4) for comparison purposes). Part A of this table uses the same dummy variable structure for countries and time periods that has been used in the paper up to this point. Both the intercept and the slope parameters of the Pade' form are estimated statistically significantly. Table 4.B presents the results of equations with less detailed dummy variable structures, which indicate only the year and the geographic region of the countries. The parameter estimates in Part B are consistent with the results presented in Part A. An F- test, however, is in favor of the specification with the detailed dummy variable structure. Figure 4 presents plots of the Pade' form for alternative parameter values. In comparison to the hyperbolic form, the Pade' form which permits the convergence rate and initial value to be independent, starts higher and descends more rapidly to s*. This form indicates even higher spread values for initial experience levels, near 32% above the benchmark. The results obtained with the two functional forms, however, are quite similar, as evidenced by Figure 4.
IV. Conclusions
In this study we have empirically examined the evolution of the spreads on bank loans to developing countries for thc 1968-81 expansion period. The primary finding of this study is that the experience level of a borrower has
a significant impact on the spreads: Spreads start at high values at low levels of experience and decrease as experience increases. In particular, it is found that at initial experience levels spreads are approximately 30
percent above the asymptotic spreads. The impact of experience becomes negligible when experience reaches near 30 prior loans. These results are found to be robust to a number of alternative specifications. In particular, the results are not a consequence of the behaviour of spreads over calendar
time, they are robust to alternative definitions of experience variable employed and are also robust to alternative functional forms employed.
This finding is important in empirically point out the presence of distortions in the allocation mechanism of international loan markets. A number of alternative interpretations may be plausible. In this paper we have discussed two possible interpretations. One of them is a high initial
fixed cost argument, which is perhaps incurred by the lenders to collect information about the borrower. The second interpretation is one of reputation acquisition by the borrowers, since lenders are unable to
distinguish different types of borrowers ex-ante. These types of arguments would suggest a greater role for international institutions in collecting and
disseminating information. In fact, such institutions have been playing a greater role in this respect since the onset of the debt crisis.
FOOTNOTES
;In practice, in addition to spreads, borrowers also pay commission and fees to the lenders. Data on these, however, are not systematically avail-able, hence these empirical studies rely on spreads only. It is noted, however, that these costs are low relative to spreads for the period under consideration (see Edwards (1984, p. 728) and Cline pp. 82-83).
A number of recent empirical studies investigate the relation between borrower country characteristics and the formation of secondary prices. For
a recent study that also incorporates creditor country elements in this investigation see Ozler and Huizinga (1989).
3
The big up-surge in bank lending began around 1969-1970 (see Williams (1980) for a discussion of the pattern of growth of the market.
4
For an explanation of this observation as well as further discussion of issues concerning reschedulings see Ozler (1989).
Explicitly, if the actual spread of the ith country's j loan is s.., then the normalized spread sij = sij /<si>, where <si> is the mean spread charged to the country over the entire 1968-81 period. Note that the normal-ized spread is a unitless quantity and can be compared across countries. The average over countries, computed at each value of j, is simply
p
<Sj> sij /p
i=l
where p is the number of countries having at least j loans. The smooth-ing routine replaces <s.> with the quantity s where
j+9
s
= <S k>/ 1 06A cursory inspection of the data in fact dictates that the cyclical pattern of spreads over time are related to some global- and macroeconomic events such as the oil shocks and industrialized counrry growth rates. These two variables are also correlated with the number of banks that
entered the Eurocurrency market. Hence a more sophisticated approach would require a model employing such variables to explain the spread behavior over time. Since this is beyond the purpose of this study, we implemented this simpler approach.
7The perfect competition assumption is not necessary for the empirical
model derived. A very similar model is developed under the monopolistic competitioi assumption. See Feder and Just (1977).
8Even though this form is not subject to the problem of scaling it is
subject to that of translation which means it is sensitive to changes of the origin for X.
9This particular set of variables was employed for direct comparibility
to existing studies on credit terms (see Edwards (1984)). Similar variables have also been employed in the empirical literature as determinants of
rescheduling probabilities (see Eaton and Taylor (1986) and McDonald (1982) for a review. In creating the ratios in this study, we have employed
monthly data where available.
10We have presented the estimations for only one of these
specifications. Others are quite similar to the one presented and are available from the author upon request.
1 1One may suspect that OLS estimates of this relationship may be
inconsistent. X and w of equation (4) may be correlated if the
borrower's choice of X in part depends on the spread. This, however, is not likely. It is important to recall that most measures of the experience
are in terms of the frequency of borrowing. Inconsistency would be a source of concern if the experience variables were measured employing amounts borrowed.
1"We have also estimated equation (4) with a sample that is constrained
to include borrowers that have at least borrowed 10 times during 1968-81. The results are quite similar to the ones presented in Table 1. For example, for Xl, y is estimated to be 0.29 with a "t" value of 2.19.
1 3See Devlin (1977) for a discussion of the evolution of the market
structure.
TABLE 1
Equation (4): -y For Alternative Definitions of Experience
XL
X2X3
X4
X5
0.26 0.25 0.25 0.09 0.04
(2.49) (2.19) (2.41) (1.00) (1.97)
Country and Region Experience Simultaneously
=u2
X6
0.25 -0.035
(2.22) (-1.02)
R2 of each equation is near .55.
The numbers in parenthesis are the "t" values.
TABLE 2
Equation (4): Alternative Cutoff Values for the Sample
1296-75
12i8-76
1968-77
7 0.44 0.44 0.52
(2.71) (2.91) (4.15)
R2 0.64 0.64 0.62
X2 definition of the experience variable is employed and the numbers in the parenthesis are the "t" values.
TABLE 3
Equation (5): Alternative Cutoff Values for X2
X2 < 11 X2 :5 21 X2 < 31 X2 < 41
7 0.41 0.36 0.33 0.26
(2.71) (3.10) (3.13) (2.46)
R2 0.75 0.67 0.63 0.61
The numbers in the parenthesis are the "t" values.
TABLE 4
*
Alternative Functional Forms
A Bk
Hyperbola Pade' Hyperbola Pade'
IV a b, - __
a
b0.25 0.77 1.00 0.43 0.97 1.17
(2.19) (2.09) (2.41) (5.52) (2.20) (3.00)
Part A is estimated from an equation that employs dummy variables that indicate countries and months in each year. Part B , instead, employs dummy variables that indicate only years and the geographic regions in which the countries are located. Both use the X2 experience variable. The numbers in the parenthesis are the "t" values.
APPENDIX
TABLE A.1 Loan Data
Country NMOR Time I T.IN s
Alteria 68 Mar. 73 83 1.33 7.8 82.8 Argentina. 87 July 73 93 1.15 7.8 100.7 Bahamas 5 Oct. 74 80 1.11 7.1 20.0 Bolivia 16 Apr. 74 59 1.90 6.2 39.2 Brazil 289 Dec. 72 102 1.47 8.8 75.6 Burma 4 June 77 35 1.87 4.6 24.0 Cameroon 5 July 74 61 2.00 7.0 21.4 Chile 66 Oct. 68 152 1.22 7.1 53.9 Colombia 36 Aug. 72 105 1.00 9.2 75.8 Costa-Rica 21 Sept. 73 87 1.34 7.7 30.0 Cyprus 7 Apr. 77 48 0.74 7.3 30.0 Ecuador 40 Mar. 75 74 1.10 7.8 61.7 Egypt 10 Feb. 74 87 1.54 6.1 55.2 El Salvador 5 June 74 18 1.73 6.4 19.0 Gabon 12 Mar. 74 84 1.84 7.6 37.0 Greece 49 Feb. 72 112 0.93 8.8 93.8 Honduras 7 Apr. 79 23 1.20 8.4 16.7 India 9 Nov. 77 40 0.74 7.1 122.8 Indonesia 53 Mar. 74 86 1.45 7.5 118.6 Iran 52 Mar. 72 79 1.07 6.8 90.2
Ivory Coast 23 Mar. 74 87 1.68 7.9 41.4
Jamaica 13 June 73 96 1.76 7.3 38.0 Jordan 11 May 77 40 1.14 7.6 55.6 Kenya 4 July 72 93 1.34 5.8 59.2 Madagascar 5 Aug. 78 23 2.00 7.0 11.6 Malawi 5 Sept. 73 79 1.70 6.8 23.4 Malaysia 21 Jan. 71 123 0.90 8.1 159.7
CouDD;YtKBOR
Time
1
mi a T L Mauritius 4 Dec. 77 36 1.64 6.0 33.0 Mexico 192 Jan. 73 101 1.09 7.3 143.0 Morocco 17 Aug. 75 68 1.21 7.3 153.5 Nicaragua 7 May 73 30 1.65 7.1 26.6 Nigeria 31 Oct. 74 79 0.98 7.8 122.5 Pakistan 7 June 77 47 1.78 6.4 27.5 Panama 25 Oct. 73 87 1.57 7.2 62.2Papua New Guinea 6 Dec. 77 41 0.96 8.5 48.0
Peru 40 Apr. 73 98 1.44 7.6 67.2
Philippines 95 Feb. 73 100 1.28 8.5 73.7
Portugal 49 May 73 97 0.94 7.0 71.5
Senegal 5 Jan. 73 100 1.98 8.0 26.5
South Africa 34 Mar. 73 91 1.32 6.0 64.3
South Korea 125 June 69 114 1.20 7.2 67.9
Spain 305 Feb. 73 100 1.05 7.4 55.0
Sri Lanka 6 June 79 21 0.80 7.3 33.7
Sudan 4 Feb. 74 34 1.71 6.7 60.8 Taiwan 46 May 74 82 1.15 7.4 50.6 Thailand 25 Mar. 76 63 0.89 7.8 66.6 Trinidad-Tobago 8 June 74 77 0.86 8.1 62.6 Tunisia 9 Nov. 77 26 0.80 7.7 51.2 Turkey 9 July 75 48 1.56 5.0 135.8 Uruguay 13 Aug. 75 67 1.32 8.3 52.4 Venezuela 72 May 71 120 1.02 5.9 141.7 Yugoslavia 76 May 77 96 1.25 7.7 62.7 Zaire 6 Mar. 73 25 1.75 8.9 36.8 Zambia 4 June 73 76 1.54 8.0 65.7 Zimbabwe 5 Nov. 80 7 1.33 5.6 22.4
NBOr. : number of times the country has borrowed.
TIME 1: first date the country appears
TIN :number of months between the first and last borrowing of the country
s :average spread expressed as percentage point above LIBOR
T :average loan maturity
TABLE A.2
Equation (4)*: Impact of Borrower and Loan Characteristics on Spreads
Parameter Intercept -3.54 Naturity 0.09 (0.11) (0.003) Syndicated 0.027 Investment/GNP -1.51 (0.019) (0.25) Public -0.14 GNP growth -0.10 (0.016) (0.086)
Total debt/GNP 0.67 Imports/GNP -0.005
(0.17) (0.12)
Reserves/GNP -0.049 Rate of Devaluation -0.04
(0.023) (0.024)
Debt Service/ 0.003 Inflation 0.23
Exports (0.003) (0.09)
X2 0.25
(0.11)
R2 - 0.54 nobs. - 2148
The numbers in parentheses are standard errors. Country and time dummies are not presented here but they are available from the author upon request.
References
Cline, William (1983), International Debt and the Stability .f the World Economv, Washington, DC: Institute for International Economics.
Cooper, Richard, and Jeffrey Sachs (1985), "Burrowing Abroad. The Debtors Perspective," in Smith G., Cuddington J. (eds.) .nt."natig
LDkanA
tQD:e 1oZnCounitries, Washington, DC: World Bank, 21-60.
Devlin, Robert (1987), "The Structure and Performance of International Banking During the 1970s and its Impact on the Crisis or Latin America," Kellogg Institute, Working Paper 090, January.
Diamond, D.W. (1989), "Reputation Acquisition in Debt Markets," Journal of Political Economy, 97,4.
Eaton, Jonathan and Mark Gersovitz (1981) "Debt with Potential Repudiation: Theoretical and Empirical Analysis," Review of Economic Studies, 48,
289-309.
and Joseph Stiglitz (1986) "The pure Theory of Country Risk European Economic Review , 22, 209-265.
Eaton Jonathan and Lance, Taylor (1986) "Developing Country Finance and Debt," Journal of Develogment Economics, 22, 209-265.
Edwards, Sebastian (1984) "LDC's Foreign Borrowing and Default Risk: An Empirical Investigation 1976-1980," American Ec-nomig Review, 74, 726-734.
_ (1986), "The Pricing of Bonds and Bank Loans in International Markets," European Economic Review, 30, 565-589.
Eichengreen, Barry, and Richard Portes (1986), "Debt and Default in the 1930s, Causes and Consequences," European Economic Review, 30, 599-640. Fader, Gershon and Richard Just (1977) "A Study of Debt-Servicing Capacity
Applying Logit Analysis," Journal of Development Economics, 4, 25-38. (1977) "An Analysis of Credit Terms in the Eurodollar Market," EuroRean Econom*ic Review, 9, 221-243.
McDonald, Donogh (1982) "Debt Capacity and Developing Country Borrowing," IMF Staff Paper No. 29, 603-46.
Ozler, Sulo (1988), "Have Commercial Banks Ignored History?" UCLA Dept. of Economics Working Paper #498, December.
(1989a), "Commercial Bank Lending to Developing Countries: The Question of Overlending," Contem=orarv Policy Issues, 1-10.
(1989b), "On the Relation Between Reschedulings and Bank Value", American Economic Review, forthcoming, December.
and Harry Huizinga, (1989) "Secondary Market Prices for Developing Country Debt: The Role of Creditor Country Factors," mimeo, September.
Sachs, Jeffery (1981), "The Current Account and Macroeconomic Adjustment in the 1970s," B&:ookings Papers on Economic Acti.vtX, 1, 201-68.
__
_ and Daniel Cohen (1985), "LDC Borrowing with Default Risk,"
Kredit_und Kapitol.
Williams, R.C., et all.,(1980), International Capital Markets, IMF Occasional Paper No:l, Washington D.C., pp 54-55.
LI.
+++
Numjber o
ObbsYavatlor
1.06
.4-
+ 4.wk"
to
ut
1.06- ***. *
+
* +10
++
+1.02-
+ S~~~
.* .~
~~~~~~+
+ +0.96-
0.94-0.94 .
+
++
0.92-
I
I
I
---10
20
30
40
50
60
70
80
0of1.S5
+o
+X
1.3
0.8- +440+ *0.7
-
; | | | | e |_
I
4197
197
1974
197
197
1 77
197
lo
19
tool
198
Calendar Time1.75
I
~~~~~~~~~~Numbw
ofObsvUn
1.5-
+
&Ww
to vt
jI * io* O* 1 *f +0.75+
+ +
+ .,'.
1
o'
++++
0.a-
5
+
+
e
-Om-
-4..5-o
I I 5 . I I08
204."
+zs1.5
Generalized Hyperbola
1.5
Pade' Approximant
1.4-
1.4-1.3-
1.3-b-1.171.2
1.2
0.9 . 0.9-0.8
,
O.
.
0
5
to
15
20
25
30
0
5
to
15
20
25
30
Experience
Experience
Iil Auhor DA for paper WPS333 An Option-Pricing Approach to Stijn Claessens January 1990 S. King-Watson
Secondary Market Debt (Applied Sweder van Wijnbergen 31047 to Mexico)
WPS334 An Econometric Method for Jaber Ehdaie February 1990 A. BhalIa Estimating the Tax Elasticity and the 37699 Impact on Revenues of Discretionary
Tax Measures (Applied to Malawi and Mauritius)
WPS335 Macroeconomic Adjustmanit and Ramon E. Lopez December 1989 L. Riveros the Labor Market in Four Latin Luis A. Riveros 37465 American Countries
WPS336 Complementary Approaches to Germano Mwabu Financing Health Services in Africa
WPS337 Projecting Mortality for All Rodolfo A. Bulatao December 1989 S. Ainsworth
Countries Eduard Bos 31091
Patience W. Stephens My T. Vu
WPS338 Supply and Use of Essential Drugs S. D. Foster in Sub-Saharan Africa: Issues and
Possibie Solutions
WPS339 Private Investment and Macro- Luis Serven December 1989 E. Khine economic Adjustment: An Andres Solimano 37469 Overview
WPS340 Prudential Regulation and Banking Vincent P. Polizatto January 1990 WDR Office Supervision: Building an Institutional 31393 Framework for Banks
WPS341 Cost-of-Living Differences between Martin Ravallion December 1989 C. Spooner Urban and Rural Areas of Indonesia Dominique van de Walle 30464
WPS342 Human Capital and Endogenous Patricio Arrau December 1989 S. King-Watson Growth in a Large Scale Life-Cycle 31047
Model
WPS343 Policy Determinants of Growth: William R. Easterly December 1989 R. Luz Survey of Theory and Evidence Deborah L. Wetzel 61588 WPS344 Policy Distortions, Size of William Easterly December 1989 R. Luz
Government, and Growth 61588
WPS345 Private Transfers and Public Policy Donald Cox December 1989 A. Bhalla in Developing Countries: Emmanuel Jimenez 37699 A Case Study for Peru
BIw Author DAR r gaear
WPS346 India's Growing Conflict Hans Jurgen Peters January 1990 T. Lim
between Trade and Transport: 34894
Issues and Options
WPS347 Housing Finance in Developing Robert M. Buckley December 1989 WDR Olfice Countries: A Transaction Cost Approach 31393 WPS348 Recent Trends and Prospects Takamasa Akiyama December 1989 D. Gustafson
for Agricultural Commodity Exports Donald F. Larson 33714 in Sub-Saharan Africa
WPS349 A Short-run Econometric Analysis Sadiq Ahmed of the Indonesian Monetary System Basant K. Kapur
WPS350 Legal Process and Economic Cheryl W. Gray December 1989 B. Dhomun
Development: A Case Study of 33765
Indonesia
WPS351 The Savings and Loan Problem in Stanley C. Silverberg February 1990 WDR Office
the United States 31393
WPS352 Voluntary Export Restraints and Jaime de Melo Resource Allocation in Exporting L Alan Winters Countries
WPS353 How Should Tariffs be Structured? Arvind Panagariya
WPS354 How Commodity Prices Respond DhaneshwarGhura February 1990 S. Lipscomb
to Macroeconomic News 33718
WPS355 The Evolution of Credit Terms: An Sole Ozler February 1990 S. King-Watson Empirical Study of Commercial Bank 31047
Lending to Developing Countries
WPS356 A Framework for Analyzing Financial Ian G. Heggie February 1990 W. Wright Performance of the Transport Michael Quick 33744 Sector
WPS357 Application of Flexible Functional Ying Qian February 1990 S. Lipscomb
Forms to Substitutability among 33718
Metals in U.S. Industries
WPS358 An Analysis of the Aggregate Long- Pier Giorgio Ardeni Term Behavior of Commodity Prices Brian Wright
WPS359 A Survey of Recent Estimates of Tae H. Oum January 1990 W. Wright Price Elasticities of Demand for W. G. Waters, ll 33744