Worcester Polytechnic Institute
Digital WPI
Major Qualifying Projects (All Years) Major Qualifying Projects
April 2017
Investigating Whether A Social Media Presence
Impacts Claim Severity
Anton Ifeyimika Libsch
Worcester Polytechnic Institute
Elizabeth Daley Beazley
Worcester Polytechnic Institute
Katherine Ann Curran
Worcester Polytechnic Institute
Robert David Ronacher
Worcester Polytechnic Institute
Follow this and additional works at:https://digitalcommons.wpi.edu/mqp-all
This Unrestricted is brought to you for free and open access by the Major Qualifying Projects at Digital WPI. It has been accepted for inclusion in Major Qualifying Projects (All Years) by an authorized administrator of Digital WPI. For more information, please contactdigitalwpi@wpi.edu.
Repository Citation
Libsch, A. I., Beazley, E. D., Curran, K. A., & Ronacher, R. D. (2017).Investigating Whether A Social Media Presence Impacts Claim Severity. Retrieved fromhttps://digitalcommons.wpi.edu/mqp-all/3782
This report represents work of WPI undergraduate students submitted to the faculty as evidence of a degree requirement. WPI routinely publishes these reports on its web site without editorial or peer review. For more
information about the projects program at WPI, see http://www.wpi.edu/Academics/Projects.
Investigating Whether A
Social Media Presence
Impacts Claim Severity
A Major Qualifying Project Submitted to the Faculty of
WORCESTER POLYTECHNIC INSTITUTE
in partial fulfillment of the requirements for the Degree in Bachelor of Science
in Actuarial Mathematics by
Elizabeth Beazley
Katherine Curran
Anton Libsch
Robert Ronacher
Date: 4/27/2017 Approved by: Jon Abraham Barry Posterro Project Sponsor:2
A
BSTRACTThis project, sponsored by The Hanover Insurance Group, is a preliminary investigation into whether social media information can be used as a statistically significant factor in modeling workers’ compensation claim severity in the restaurant and food services industry. Factors including the existence of a website, Yelp page, or TripAdvisor page were considered in this investigation. Through analysis of these social media variables, we created a generalized linear model of claim severity. While the specific data that we gathered and analyzed did not hold any predictive power, we still believe that social media is a worthwhile field to pursue, but in a different capacity.
3
A
CKNOWLEDGEMENTSOur team would first like to thank our sponsor, The Hanover Insurance Group, for providing us with this project. We would especially like to thank Chief Actuary Rick Burt, without whom the idea for this project would not have existed, and Jaris Wicklund, who helped to shape the direction of the project and provided guidance along every step of the way.
Additionally, we would like to thank Isin Ozaksoy for her help and expertise in the Data Science field.
We would also like to thank our project advisors, Jon Abraham and Barry Posterro. They have been great professors and mentors to us throughout our undergraduate career, and we are incredibly thankful to have had their guidance on this project. Finally, we would like to extend our appreciation and thanks to Professor Randy Paffenroth, who helped us with questions and guided our way in the data analysis field of our project.
4
E
XECUTIVES
UMMARYThe Hanover Insurance Group, Inc. is a property and casualty insurance company based in Worcester, Massachusetts. The company offers a wide range of insurance products through both its commercial and personal business lines. In recent times, Big Data has been
revolutionizing the insurance industry as a way to improve business performance, specifically within pricing, underwriting, and risk selection. Social media is one of the largest, most
comprehensive sources of Big Data available today. The Hanover commissioned a team of four Worcester Polytechnic Institute students to investigate whether social media information can be used as a statistically significant factor in modeling workers’ compensation claim severity for the restaurant industry.
The goal of this project was to determine if collecting and using social media data is a worthwhile method for modeling claim severity. We evaluated this goal through the creation of a generalized linear model to predict claim severity. The success of this project would allow The Hanover to create better-informed underwriting decisions, acting as a component in deciding whether or not to write a policy or as a rating factor for calculating the premium to charge. Additionally, in the marketing segment, this information could be used to target groups with the lowest predicted claim severity.
Our methodology for this project consisted of four main steps. The first was to filter our data set of claims down to a sample that we thought would produce the most meaningful results. In our case, this meant choosing to exclusively analyze workers’ compensation insurance within the restaurant and food services industry. We did this to have a homogenous group of data for analysis, and also because this was the bucket for which we had the most data. Our next step was to determine the set of social media variables to be gathered that we felt could best predict the claim severity associated with a business. Due to legalities with screen scraping and APIs, we manually collected this data for each of our businesses. Next, before building our model, we performed exploratory analyses on our final data set. During this stage of our project, we investigated interesting relationships we found within our data, as well as built histograms and trend graphs. Once this was complete, we proceeded to our final step: data modeling. We used a generalized linear model with a gamma distribution and log link to predict the claim severities of our business policies. We iteratively tested this model, comparing p-values and other statistical
5
parameters, until we arrived at our best-fitting model. Limited to the variables that we were able to gather, there was no model that possessed high predictive power. From this conclusion, we developed a comprehensive list of recommendations to utilize in future endeavors.
The purpose of this project was to determine if social media data can improve The Hanover’s underwriting process. While the specific data that we gathered and analyzed did not hold any predictive power, we still believe that social media is a worthwhile field to pursue, but in a different capacity.
6
T
ABLE OFC
ONTENTS Abstract ... 2 Acknowledgements ... 3 Executive Summary ... 4 Table of Contents ... 6 List of Figures ... 7 Introduction ... 8 Background ... 9The Hanover Insurance Group ... 9
Workers’ Compensation Insurance ... 9
The Power of Big Data ... 10
Current Uses of Social Media in the Insurance Industry ... 13
Legal Constraints ... 14
Claim Severity ... 15
Generalized Linear Models ... 16
Assessing Model Fit ... 16
Methodology ... 18
Analysis... 25
Exploratory Analysis ... 25
GLM Results ... 31
Conclusions & Recommendations ... 36
References ... 38
7
L
IST OFF
IGURESFigure 1: Top-Growing Big Data Sources ... 11
Figure 2: Top Big Data Challenges ... 12
Figure 3: Data Compression Process ... 20
Figure 4: Correlation of Social Media Variables ... 22
Figure 5: Frequency Chart of Claim Severities ... 23
Figure 6: Actual vs. Predicted Claim Severity for Build Sample ... 24
Figure 7: Actual vs. Predicted Claim Severity for Test Sample ... 24
Figure 8: Claim Severity by Social Media Variable for Censored Data ... 27
Figure 9: Claim Severity by Media Type ... 28
Figure 10: Counts for Claim Severity by Media Type ... 28
Figure 11: Trend Graphs for Each Social MEdia variable ... 29
Figure 12: Claim Severity by the Number of Yelp and TripAdvisor Reviews ... 30
Figure 13: Count for the Number of Businesses in each Review Bucket ... 30
Figure 14: Claim Severity by Yelp and TripAdvisor Rating ... 31
Figure 15: Count for the Number of Businesses in Each Rating Bucket ... 31
Figure 16: Parameter Estimates from SAS GLM Output ... 32
Figure 17: Actual Versus Predicted Claim Severity Scatterplot ... 33
Figure 18: Zoomed In Actual Versus Predicted Scatterplot ... 33
8
I
NTRODUCTIONThe Hanover Insurance Group, Inc., based in Worcester, MA, consists of several property and casualty companies, making it one of the largest P&C insurance companies in the U.S. by net premium (Moynihan, 2014). The company writes both commercial and personal policies for coverages including automobile, homeowners, and specialty insurance. This project is a
preliminary investigation into whether social media information can be used as a statistically significant factor in modeling workers’ compensation claim severity for the restaurant industry.
Currently, The Hanover does not have a formal structure to utilize social media data during the underwriting process, but it is interested in the practicality of using such information. With the increasing popularity of social media, the potential usefulness of this data is increasing as well. However, incorporating more data into businesses decisions does not necessarily yield more insight. Vast amounts of data can be difficult to structure, and the benefits of incorporating the data may be negligible if the data holds little predictive power. If The Hanover allocated resources to research and develop projects to try to harness the power of social media data, the outcome could be futile. Consequently, The Hanover proposed our project to determine if social media presence is an indicator of claim severity, thus a worthwhile research and development project.
Our project intends to use statistical analysis and data interpretation techniques to turn social media data into information utilizable by The Hanover. We aim to determine if collecting and using social media data is a worthwhile method for modeling claim severity.Factors
including the existence of a website, Yelp page, or TripAdvisor page were considered in this investigation. With these factors, we developed a generalized linear model in SAS to describe the relationship between a company’s online presence and its claim severity. We intend to
recommend whether or not there is enough information available for The Hanover to formally incorporate social media data into its underwriting process and pursue further research beyond our project.
9
B
ACKGROUNDT
HEH
ANOVERI
NSURANCEG
ROUPThe Hanover Fire Insurance Company was founded in 1852 and originally located at Hanover Square in Manhattan, New York. From its advent, the company’s strategy combined prudent risk-taking and long-term investing. This combination has led The Hanover to grow beyond fire insurance and become one of the leading property and casualty companies (“Our History,” n.d.). Now branded as The Hanover Insurance Group and based in Worcester, Massachusetts, they offer a variety of commercial and personal insurance products such as automobile, homeowners and specialty insurance (“Our History,” n.d.). Among The Hanover’s advertised core skills are the “timely delivery of technology improvements” and “exceptional underwriting” (“Core Skills,” n.d.). These skills are essential in remaining competitive in the insurance market and keeping products up-to-date. Currently, Big Data and social media are revolutionizing the market, leading top-performing companies to begin innovating their products with data analytics. As of this time, The Hanover does not use data that is available through social media in a formalized manner. Although underwriters will gather informal research about a potential policy through social media, the collection and use of this data in a broad manner remains unutilized.
The Hanover has seen precedent with other insurance providers innovating their data collection processes, and recognizes the potential in utilizing the vast amount of information available through social media (StackIQ, 2012). Specifically within the restaurant and hospitality businesses, information sources such as Yelp and TripAdvisor may provide key insight into the working conditions or risks that customers and employees are prone to on a day-to-day basis. These sources are intended to provide new information and shed light on other factors that may be predictive of risk in order to make more accurate underwriting decisions.
W
ORKERS’
C
OMPENSATIONI
NSURANCEWorkers’ compensation insurance is a business insurance that covers medical costs and lost wages for workers who become injured or ill on the job. Most states require a business to have this type of insurance to ensure that employers pay fairly for workplace injuries or occupational diseases. Employers are also safeguarded by having workers’ compensation
10
insurance; it acts as a trade-off whereby the injured employee gives up his right to sue his
employer in court in exchange for the right to receive benefits, regardless of who was at fault for their injuries. Only injuries relating to the job are covered, such as lifting heavy equipment or falling on a wet floor. If an employee is not acting “within the scope of employment,” such as playing football with co-workers, then this sort of injury will likely not be covered (“Get Workers’ Comp,” n.d.). Workers’ compensation claims can be categorized into two classes: medical-only and indemnity. Medical-only claims require medical treatment for the injury, but allow the employee to return to work immediately after the injury. Indemnity claims are more serious, as the employee cannot return to work until healed and so must receive medical
treatment and wage support (Reeves, n.d.). The top five workers’ compensation claims include: strains and sprains (30% of all workers’ comp claims), cuts or punctures (19%), contusions (12%), inflammation (5%), and fractures (5%). Most of these claims come from handling materials, slip-and-falls, or object collisions. Higher costing injuries such as amputations, dislocation, electric shock, and multiple trauma injuries typically occur less frequently overall (“Top 5,” 2016).
T
HEP
OWER OFB
IGD
ATAThere is a common maxim among successful businesses that “data is synonymous with answers” (Sorokina, 2015). Online data is virtually limitless, which is why it is referred to as ‘Big Data’, meaning data that is too vast to be captured all at once. Big Data originated in the advent of the digital age, and it has been alluring to businesses ever since. One of the strongest draws for online data is its potential as a current and relatively free source of genuine
information. Within the realm of Big Data, an area with high potential is social media. Social media websites and review sites are founts of potential information for both business owners and insurers.
The core usefulness of Big Data, especially in a decision-making process, is how quickly it gives insight for a decision maker. Downloading data and running computer-generated
analyses are more rapid than techniques involving hand gathered data. Manual processes generally take much more time to complete, and are often done in a discontinuous process that leads companies to rely on outdated information. In contrast, companies with a steady stream of
11
information have more agility in their decision-making processes since they receive information sooner and can thus react faster (Sorokina, 2015).
Telematics and social media are some of the largest sources of Big Data available today. The major importance of these sources is that any user has the potential to share an opinion and, for that reason, companies can consider them essentially free opinion sources for decisions.
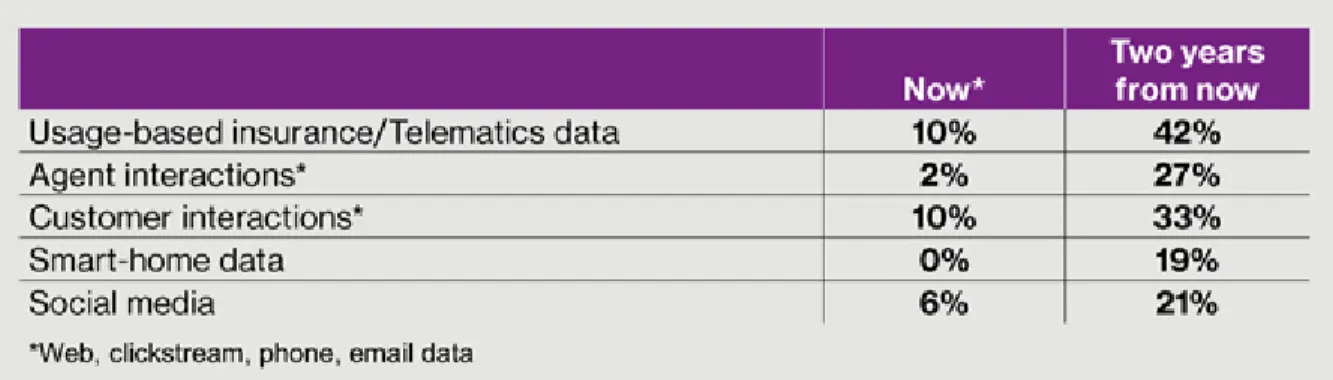
Over the last few years, property and casualty insurance has seen a surge in the emergence and use of Big Data and predictive analytics to improve business performance. In 2015, 42% of insurance companies were using Big Data in some capacity to improve pricing, underwriting, and risk selection. By 2017, this number is expected to more than double (Southwood & Ihrke, 2016).
While this project focuses on social media, there are many other sources of Big Data. As seen in the figure below, all of these aspects are expected to grow significantly by 2017
(Southwood & Ihrke, 2016).
FIGURE 1: TOP-GROWING BIG DATA SOURCES
This multitude of sources can tell insurers and analysts far more than past data collection methods could. By gathering this sort of information, insurers can improve the accuracy of policy prices, customize products to cater to client needs, improve customer relations, and create more effective loss prevention methods.
Big Data can be harnessed by many industries in order to gather the information needed for each type of policy. For example, in the auto industry, telematics-based insurance products, such as embedded navigation systems and on-board diagnostics, can be used to create
personalized plans for insureds. Two of these options are “Pay-As-You-Drive” plans, where customers are charged based on how far they drive, and “Pay-How-You-Drive” plans, which takes into account factors such as speed, acceleration, braking, and fuel consumption.
12
Progressive predicts that, by the year 2020, over 25% of auto insurance premiums will be determined through telematics (“Data Science in Insurance,” n.d.). To follow the auto insurance industry, insurance companies are looking to create a similar “usage-based” system for
homeowners, combining both internal and external sources to produce more accurate pricing models. Internal data sources include “moisture sensors that detect flooding or leaks, utility and appliance usage records, security cameras, [and] sensors that track occupancy” (“Data Science in Insurance,” n.d.). By using these internal data sources in conjunction with outside sources such as traffic and crime reports, companies can create a comprehensive analysis of a customer’s property claim risk.
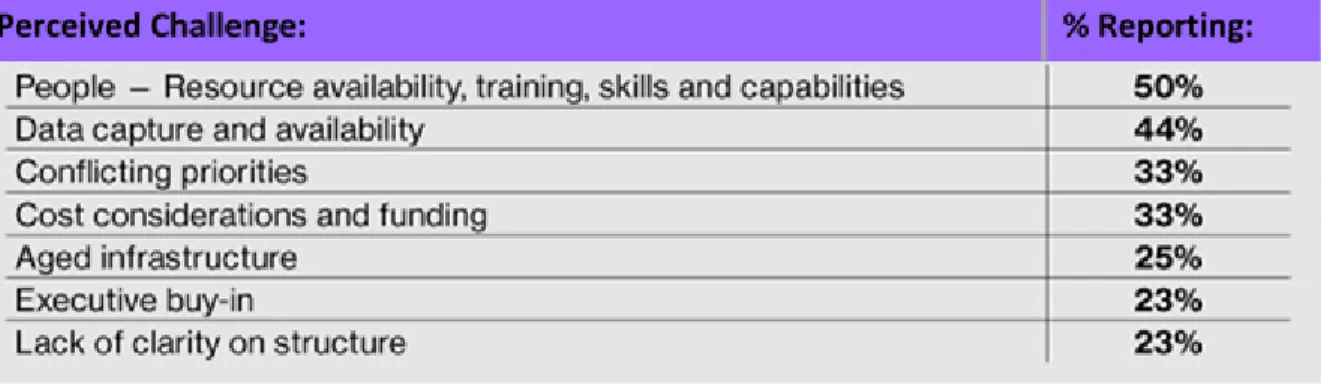
However, with this great amount of potential comes a significant number of challenges. A survey conducted by Towers Watson highlighted the vast number of challenges that insurers have encountered with Big Data, shown below.
FIGURE 2: TOP BIG DATA CHALLENGES
The top problem of resource availability, training, skills, and capabilities is one that many experts have identified, as “there is a disconnect between our ability to create, collect and store data – and our capability to thoroughly process and exploit it” (Burger, 2013). A lot of useful data is already public, and what is not can easily be bought, giving all companies access to the same information. The top performers in the industry will be the companies that take on this new technological innovation and adapt to the new “super abundance” of available data (Golia, 2013).
Based on a survey by the Chartered Institute of Insurers underwriting faculty, 95% of respondents agreed that most underwriting departments lack the necessary equipment to fully utilize Big Data, with 81% also stating that many departments lack the specialized set of skills
13
needed to analyze the data (“The big data rush,” 2013). Sarah Adams, manager of the Financial Services Sector of Ordnance Survey, stated, “Data is more powerful when it’s linked with other datasets, allowing underwriters to not only validate existing data, but also identify previously unseen patterns and risks” (“The big data rush,” 2013). For this reason, companies need to increase their model sophistication, moving beyond the industry standards of generalized linear models (GLMs), one-way analyses, and decision trees. Many companies already supplement these models with competitive market analyses and industry data. Towers Watson predicts that, by 2017, insurers will expand their mix of analysis techniques beyond GLMs, with 43%
expecting “to incorporate machine-learning techniques into modeling results” (Southwood & Ihrke, 2016).
C
URRENTU
SES OFS
OCIALM
EDIA IN THEI
NSURANCEI
NDUSTRYIn current times, it is common for people to turn to social media to share their opinion and hear the opinions of others. Before buying a product or visiting a restaurant, consumers may turn to friends to ask questions or look at comments written on review platforms. These
platforms can provide a wealth of information for insurance companies. While many companies are looking to innovate with Big Data to further their underwriting and loss prevention methods, customers can also use social media to make a decision about which insurance carrier to choose. Accenture’s 2013 Consumer-Driven Innovation Survey found that 48% of customers said that they would place value on comments found online through social media when making an insurance buying decision (Gil, 2014). Social media channels provide the possibility of improving customer relations with brokers and agents, helping to “fill in the gaps...given the relative infrequency of contact between consumer, agent and insurer through traditional channels” (Gil, 2014).
One of the primary uses of social media by insurance companies is fraud detection. The Coalition Against Insurance Fraud reported that 36% of insurance companies use social media for such purposes (Rose, 2013). Each year, $80 billion is lost across all lines of insurance to fraud. Many people have public social media accounts on which they make statuses and post images and videos, allowing insurance companies to be able to detect fraud. In one situation, a woman who had filed a claim saying that she had lost her wedding ring posted a photo to
14
for an auto accident, but a bystander posted a video of this man intentionally driving his car into the water (Windt & Henk, 2016).
Social media can also be used for underwriting and claims purposes, which is what we are most interested in. The immediacy of data is one of the many drawing points of utilizing social media over the static methods of the past. Mike Fitzgerald, a senior analyst at Celent L.L.C., described a situation where underwriters utilized Facebook to upgrade an existing policy. A general contractor, who they insured, detailed his venturing into the roofing business through a Facebook post, unaware that roofing was not included in his current contract. The underwriter saw the post, alerted the customer, and was able to make the change to the policy before anything tragic happened (Kenealy, 2013).
Another use of social media is in situations of loss. Oftentimes, bystanders take videos, pictures, and commentary of a loss, such as a fire, as it occurs. This can be instrumental in gathering information for claims and subrogation. David Brisco, from the law firm Cozen O’Connor L.L.P., described a case where insurance investigators used social media to determine the starting point of a wildfire in Malibu, California. The investigators found a photo from just days before the fire that showed a utility pole in a precarious position, which turned out to be the cause of the fire (Kenealy, 2013).
All of the examples noted within this section involve situations which are useful to the insurers, but which do not lend themselves to automation or replication on a large scale.
L
EGALC
ONSTRAINTSOne hindrance to collecting online data is the illegality of screen scraping, which is the process of using a computer program to collect data from a website and translate it to another application. Parties are potentially able to gather entire databases worth of information through this method. If someone were to translate this data into a more modern application, a company could potentially see its visitor traffic move to this new website (“Screen Scraping,” n.d.). Regulations in place protect both the information on the site and the underlying code that displays that information. A typical mode of screen scraping is with an Application Program Interface (API) which is a set of protocols or tools for building software applications, providing the ‘building blocks’ for a program (Beal, n.d.). Some websites publish APIs that can be used on their forums, but what is permitted varies greatly from site to site. For TripAdvisor, the API
15
could not be used for academic purposes, and for Yelp, only a set amount of data could be gathered and stored per day (“FAQ,” n.d.).
To ensure that visitors are aware of the fair use policy of the site’s copyrighted content, many commercial websites have expressly written terms of service that users are required to agree to by clicking “I Accept” upon accessing the website. These terms frequently include clauses that prohibit screen scraping for the purpose of data collection. Courts have also
considered whether screen scraping is a violation of the Computer Fraud and Abuse Act, which forbids access to websites or databases “‘without authorization’ or in a way that ‘exceeds authorized access’ of the computer” (Snell & Care, 2013).
Because of the above limitations, we were not able to gather the amount of data that we would have liked to have to do our analysis. Data had to be hand-collected for each of our businesses, which was a long process for the size of our data set. An automation of this process, which would only be allowed through partnering with an organization or paying a fee, would greatly improve this process and allow for a greater selection of variables.
C
LAIMS
EVERITYIn insurance, there are two usual ways to determine the impact of claims on a company. The first one is the loss ratio, a simple ratio of total losses paid divided by total premium. Loss ratio looks solely at total numbers, not individual claims. The other option is to look at claim severity, which is a ratio of total losses paid over the number of losses. Claim severity looks at how poor the claims for a location were on average, and therefore is a better measurement of claims than loss ratio. Loss ratio takes into account all policies, even those that do not experience a claim, while severity only looks at policies that report a claim. For our analysis, we decided to look at locations that had a claim, so we chose claim severity as the response variable for our model.
In the insurance industry, claim severity traditionally follows two distributions: gamma and lognormal. This is because “insurance claims have been found in numerous studies to be positive and usually positively skewed with variances often proportional to the mean squared” (Fu & Moncher, n.d.). Gamma and lognormal distributions are the most widely used
distributions that also fit this criteria. A study by Luyang Fu and Richard Moncher used Monte Carlo simulations to show that gamma distributions provide the most accuracy and efficiency
16
(Fu & Moncher, n.d.). For these reasons, and the fact that our data fit this distribution, we chose a gamma distribution for our generalized linear model.
G
ENERALIZEDL
INEARM
ODELSTraditional linear models are used extensively in data analysis, but are not always the most appropriate choice, as they involve assumptions such as the data following a normal distribution and having constant variance. A generalized linear model (GLM) goes beyond traditional linear models, drawing from a range of different distributions to find the best fitting model (“6.1 - Introductions to GLMs,” n.d.). GLMs are commonly used in the insurance industry because losses and severities are positive values that are typically positively skewed. GLMs assume that data is from the exponential family, which has a shape consistent with that of losses and
severities. Additionally, GLMs can evaluate variables “simultaneously and adjust for interactions and correlations among them,” an important concept in the insurance business (Fu & Moncher, n.d.).
There are three main components to a GLM: a random component, systematic component, and link function. The random component is the distribution of the response variable, or the value that is being predicted or explained. The systematic component specifies the linear combination of the explanatory variables in the form β0 + β1x1+ β2x2 +...+ βnxn, where the
βn values are the parameter estimates from the GLM and the xn terms are the explanatory
variables. Finally, the link function specifies the relationship of the linear variables to the
predictor. For example, the link function takes the form “η = g(E(Yi)) = E(Yi)” for linear regression
and “η = logit(π)” for logistic regression (“6.1 - Introductions to GLMs,” n.d.).
Statistical Analysis System (SAS), a statistical analysis package, can create Generalized Linear Models through its PROC GLM and PROC GENMOD features. The model is fit through the method of least squares and can output fit diagnostic measures such as predicted values and residuals (“The GLM Procedure,” n.d.). This type of program greatly simplifies the process of iteratively fitting a GLM to a data set to find the best fit.
ASSESSING MODEL FIT
SAS provides three statistical measurements as values for a model of best fit: AIC, AICC and BIC. They combine parsimony, or simplicity, with the models maximum likelihood estimate to help measure a ‘best’ model. When trying to choose between two models, one must find the delicate balance between the number of variables and the degree of fit. AIC, AICC, and BIC
17
target this goal; as these values decrease, model quality increases. For all future equations, we will define the log likelihood (LL), as the log of the product of the probability density function at the observed data values, p as the number of estimated parameters in the model, and n as the sample size.
AIC, or Akaike’s Information Criterion, is defined as AIC = -2*(LL) + 2*p (Generalized Linear Models, 2010). AIC is a measure of goodness of model fit that balances model fit against model simplicity. AIC falls short in small samples, and has over fit models (Simonoff, 2003).
The AICC, or Corrected Akaike’s Information Criterion, was created to help address this problem. This model uses most of AIC, but adds a bit more punishment for models with more parameters; in large samples, the two are nearly identical (Simonoff, 2003). AICC can be calculated as AICC = -2*(LL) + 2*p*(n/(n-p-1)) (“Generalized Linear Models”, 2010).
BIC, or Bayesian Information Criterion, is equally as similar, but replaces the 2*p factor in AIC with p*ln(n) to help address errors in smaller sample sizes, leading to the formula BIC = -2*(LL) + p*ln(n) (Generalized Linear Models, 2010). BIC typically penalizes for the number of parameters more than AICC; this leads to choosing a more parsimonious model when choosing based on BIC values (Simonoff, 2003).
We will use two outputs of AIC, AICC, and BIC that we obtained from our model iterations to demonstrate how to choose the better fitting model. While the variables being used have not been explained at this point, it will still be clear how these measurements work. The first model in this example utilizes four variables (website, Yelp page, policy sub-region, and bucketed policy years), while the second model has seven variables (website, Facebook, Google Reviews, Yelp, Yelp rating, TripAdvisor, and TripAdvisor rating).
Comparing these two models, we can see that the first model has lower AIC, AICC, and BIC values. This means that the first model is a better fit because of its simplicity and the fact that smaller AIC, AICC, and BIC values represent a better fit.
18
M
ETHODOLOGYIn this section, we outline the steps taken to reduce our data set to the sample to be used for our generalized linear model, as well as the steps to create said model. Within our original data set provided by The Hanover were policies and claims dating back to 1999 for two industries, restaurants & food services and hospitality, and three lines of business, workers’ compensation, commercial package policy, and monoline liability. For our project, we focused on developing a model for workers’ compensation insurance within the restaurants and food services industry. The statistical model created was designed to take into account social media variables, as well as variables such as year and region, and produce a single point, the predicted claim severity of a business. Before developing the model, there were three steps taken in order maximize the accuracy of our results. The first step was to filter our data set of claims down to a sample that we thought would produce the most meaningful results. Next, we determined the set of social media variables to be gathered that we felt could best predict the claim severity
associated with a business. Finally, we censored our data in order to minimize the impact of outliers in our claims.
Our team began with data sets of 47,574 policies and 43,181 claims, with relevant information corresponding to each. The original data set contained information dating back to 1999. To improve our analysis, we filtered our policies and claims to effective dates between 2010 and 2016. The primary reason for this was a large acquisition of new policies for The Hanover in 2010 that significantly changed their book of business. As such, policies and claims before this time cannot easily be compared to those after. Additionally, social media sites like Yelp and TripAdvisor are relatively modern, having been around since 2004 and 2000, respectively. Since we do not have specific information about when the companies began appearing on these sites, using a more recent date range should give more accurate results. After reducing our time period, the team removed any claims that did not have a corresponding policy listed, as a safeguard in case we wanted to include policy premium in our analysis. We then removed claims incurring a zero loss amount to remove the effects of claims that may have been reported but never actually evolved into a payout. Afterwards, we filtered our scope to only businesses within the restaurants and food services industry with workers’ compensation claims.
19
The data that we received had six potential combinations between two industries and three lines of business, as shown below.
Industry Line of Business Total Number of Claims
Restaurants and Food Services C/L Workers Comp 4,890 Restaurants and Food Services C/L CPP 3,632 Restaurants and Food Services C/L Monoline Liability 216 Hospitality C/L Workers Comp 672
Hospitality C/L CPP 2,959
Hospitality C/L Monoline Liability 310
We chose to exclusively analyze the restaurant and food services industry and the workers’ compensation line of business (the first line of the table). This was done for several reasons. The most significant is that, with a homogenous collection of data, we could avoid any chance that the new social media data would have a different effect on different lines of business or industries. A Yelp review, for example, can be expected to give different insights for
restaurant workers’ compensation versus restaurant commercial package policy. As a result, our conclusions can be expected to be both stronger and more accurate. Our reasoning for choosing restaurant and workers’ compensation specifically was that, as the largest within the six buckets, we would get a narrower margin of error. Additionally, in terms of social media review sites, restaurants are typically reviewed more often than hotels. Therefore, we believed that we could find more data online for the restaurant industry.
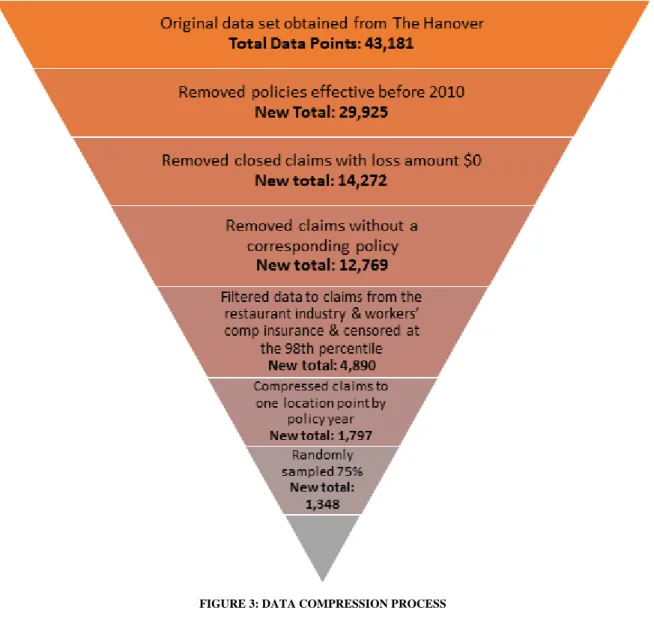
Since claim amounts varied significantly within the sample, we decided to censor our data at the 98th percentile. Claim amounts originally varied from a minimum of almost zero dollars to a maximum of $2,342,404.79. Censoring the data capped the highest 97 claims at a maximum claim value of $72,133.83. After censoring by claim amount, the 4,890 data points were compressed into unique data points by business and policy year. This left us with 1,797 data points for analysis. Each business could show up in this data set however many times they had a policy with The Hanover and experienced at least one claim in that policy year.
20
To begin the modeling process, we separated our censored data sets into a build sample and a validation sample. We used 75% of the data (the build sample) for model calibration, and reserved the other 25% for later testing. The validation sample would ensure that our model was not over-fit to our data. We created these two random samples through the “rand” function in Excel, where each data point was assigned a random number from 0 to 1. Afterwards, we sorted the data according to the random numbers each point had been assigned, and chose the first 75% as the build sample.
This data compression process is summarized in the flowchart below.
FIGURE 3: DATA COMPRESSION PROCESS
After trimming our data, our team began collecting new variables to perform analyses on our businesses.Through discussions with The Hanover and other industry professionals, we
21
they would take to collect. These variables were also decided upon as the best choices for long-term use by The Hanover with minimal legal risk or personal information gathering. Each of these nine variables were manually gathered for each of the 1,797 data points. The nine are as follows:
1. Website: Does the location have its own website?
2. Facebook Page: Does the location run its own Facebook page? (Fan pages are excluded.) 3. Google Reviews: Was the location in question reviewed by Google Reviews?
4. Yelp Page: Does the location have a Yelp Page? 5. Yelp Rating: If reviewed, what is the Yelp rating?
6. Number of Yelp Reviews: If reviewed, how many times was it reviewed? 7. TripAdvisor Page: Does the location have a TripAdvisor page?
8. TA Rating: If reviewed, what is the TripAdvisor rating?
9. Number of TA Reviews: If reviewed, how many times was it reviewed?
Before running the modeling procedure within SAS, we performed exploratory analyses on our final data set. During this stage of our project, we investigated relationships we found within our data, as well as built histograms and trend graphs for analysis. Additionally, we used
statistical analysis tools within Excel to fit a model to our data. These analyses will be discussed in detail in the next section of our paper.
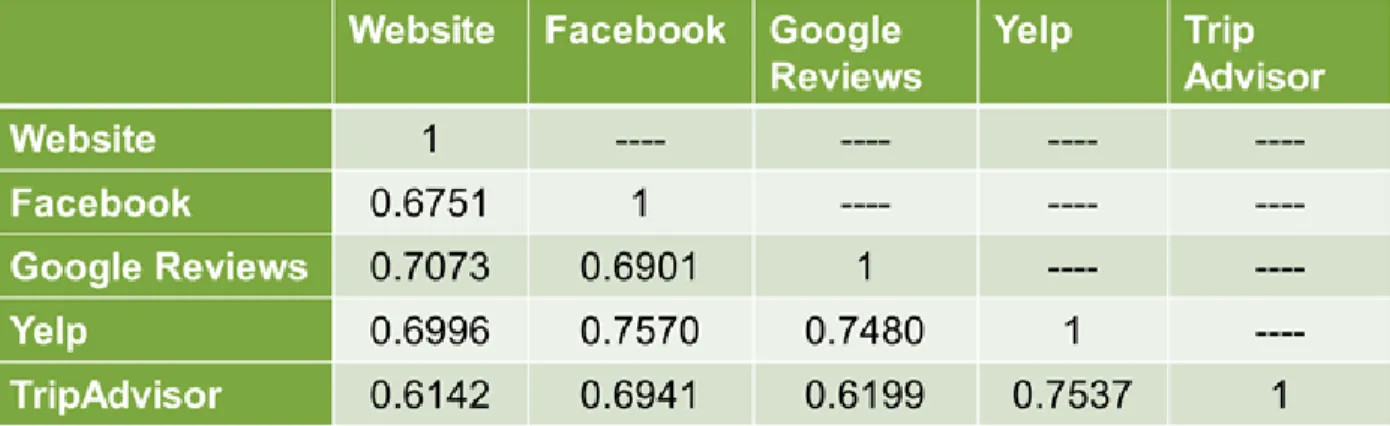
Another aspect that we considered before creating our model was correlation.
Multicollinearity exists when two or more variables are moderately or highly correlated. The regression coefficients for any given variable depend on the other predictors that are used in the model, with the precision of these coefficients decreasing as more predictors are added (“What is Multicollinearity?,” n.d.). If two variables are highly correlated, it can make it difficult to
identify which has the greatest effect on the dependent variable being investigated. We used the Pearson coefficient function in Excel to calculate our correlations, and set our correlation tolerance to 80%. As can be seen in the table below, we did not find any of the variables to be highly correlated enough to be removed.
22
FIGURE 4: CORRELATION OF SOCIAL MEDIA VARIABLES
We chose to use a generalized linear model for our data for several reasons. Most importantly, GLMs can be used to model binary data (“Introduction to Generalized Linear Models,” n.d.). Since the majority of our social media data was primarily yes/no answers, this was a good method for modeling our data. Additionally, GLMs can take into account several different variables and the correlation between them. Lastly, GLMs are very common in the insurance industry. Delivering a GLM to The Hanover would provide them with the most useful information in a format that they are already familiar with. Details about the creation of a GLM can be found in the Background.
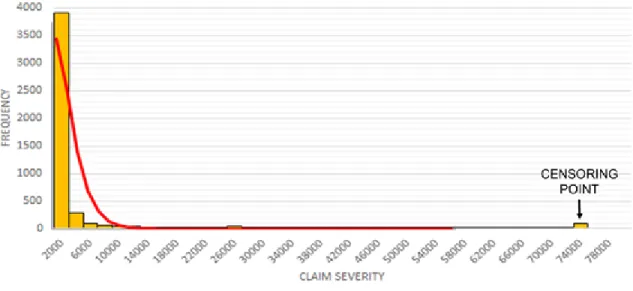
Claim severity is the response variable for our model. To determine the distribution of this variable, we created a frequency plot and overlaid the best fitting distribution, which ended up being a gamma distribution. It is important to note that claim severity is most commonly modeled with either a gamma or a lognormal distribution (Fu & Moncher, n.d.). PROC
GENMOD, the function that we used within SAS to create the GLM, does not have functionality for lognormal distributions, so our team pursued the Gamma. The graph below shows our claim severity plot with a gamma line superimposed over it.
23
FIGURE 5: FREQUENCY CHART OF CLAIM SEVERITIES
The next two steps were relatively straightforward. We began our iterations with all of our social media variables, as well as the policy year and subregion that was provided by The Hanover. We utilized a log link function, the effect of which will be further discussed in the Analysis section.
To improve our model, we utilized three key outputs from SAS to determine our best model. The first output we used was the Chi-Squared p-value associated with the parameter estimates. This value was used to determine which variable was the least significant in the Maximum Likelihood Estimate of the current model fit. The variable associated with the highest p-value was the variable we removed when running a new iteration. After running a new model, we compared the AIC, AICC and BIC values (discussed in the Background) of the two models. We also looked at the residual plots of the new model. An ideal model would show random scattering of the residuals about zero to demonstrate that the model does not over-fit the sample. Residuals both above and below zero would also indicate that our model did not introduce any sort of bias.
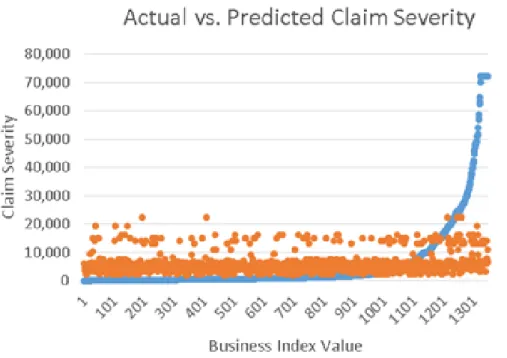
Through trial and error, we determined the most effective variables to be Website, Yelp page, Policy SubRegion, and Bucketed Policy Years (2010-2013, 2014-2016). After fitting the model, we analyzed the scatter plot of the actual versus predicted claim severities for each business. Although the model was not at all satisfactory despite exhausting different variable combinations, we did continue with validation testing. The first scatterplot below shows the results of the GLM using our build sample. The second scatterplot shows the result of testing the GLM that we created with the validation set. The overall shape is very similar to that of the build
24
sample. We did not perform any future analyses for this GLM fit, as this confirms that, limited to the variables that we collected, there is not a model that possesses high predictive power.
FIGURE 6: ACTUAL VS. PREDICTED CLAIM SEVERITY FOR BUILD SAMPLE
25
A
NALYSISIn order to effectively understand the data we were given and its relationship to our gathered social media variables, we performed exploratory analyses on our data set. Our strategy for these analyses was:
1. Familiarize ourselves with the data set and the social media fields that we gathered. 2. Observe the relationship between the variables and claim severity.
3. Identify changes to improve the data set.
Once we felt as though we had a thorough understanding of our data set, we built a generalized linear model and analyze the output from it.
E
XPLORATORYA
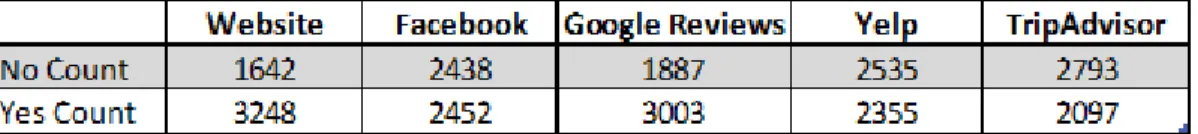
NALYSISOur first analysis step was to examine the relationship between the presence of our five main social media variables (website, Google Reviews, Facebook, Yelp, TripAdvisor) and the average claim severity for each. The table below shows this relationship for our uncensored data set of 1,797 points.
FIGURE 8: COUNTS FOR EACH SOCIAL MEDIA BUCKET
26
FIGURE 9: CLAIM SEVERITY BY SOCIAL MEDIA VARIABLE FOR ORIGINAL DATA SET
As can be seen from the ‘No’ and ‘Yes’ counts in the first table, businesses are
essentially evenly divided between having or not having a Facebook, Yelp, and TripAdvisor. For a website and Google Reviews, business are roughly twice as likely to have them as opposed to not.
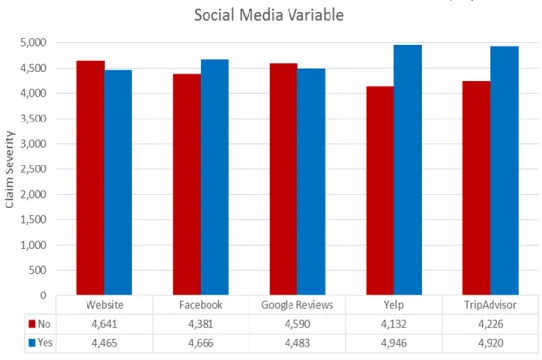
In the histogram, the average claim severities within each ‘No’ and ‘Yes’ bucket are weighted by the number of businesses matching that criteria. Upon examining the graph, there does not seem to be any sort of consistent relationship between having or not having a presence on a given social media site. Initially, website, Yelp, and TripAdvisor presence show a slightly higher average claim severity for a ‘No’ answer, while the opposite is true for Facebook and Google Reviews. With a total loss amount of $32,057,222 and 4,890 total claims, the average claim severity within each bucket was $6,555.67.
As described in the Methodology, we determined that it would be best to censor our data in order to eliminate large losses that were driving up the average claim severity. Censoring the data capped the highest 97 claims to a maximum value of $72,133.83.
27
FIGURE 8: CLAIM SEVERITY BY SOCIAL MEDIA VARIABLE FOR CENSORED DATA
From this histogram, we can now see that the relationship between Google Reviews, Yelp, and TripAdvisor has been inverted from the relationship in the first histogram. For Yelp and TripAdvisor, this indicates that many of the censored claim values had a ‘No’ presence for these two variables. After censoring, the total loss amount was $22,122,300; this means that censoring 97 data points accounted for nearly $10 million worth of claims. With 4,890 total claims, the average claim severity for the censored data was $4,523.99.
We can divide our data into two main variables: consumer generated media and company generated media. Yelp, TripAdvisor, and Google Reviews would be considered consumer
generated, as the actual business had no part in creating a presence on these platforms. A website and Facebook page are company generated media; a business must make the effort to create their own website or Facebook page in order to have this presence. We created a histogram of this data in order to determine if there was any relationship between these two groupings.
28
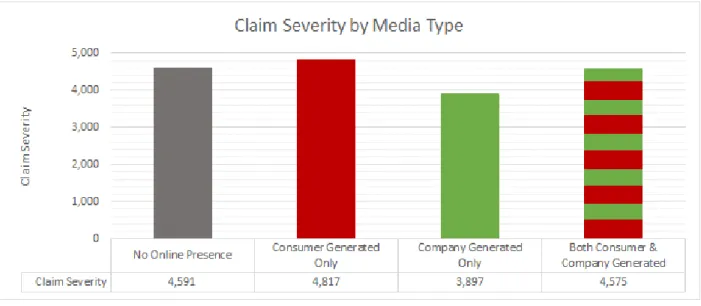
FIGURE 9: CLAIM SEVERITY BY MEDIA TYPE
FIGURE 10: COUNTS FOR CLAIM SEVERITY BY MEDIA TYPE
‘No Online Presence’ indicates that a business has neither consumer nor company-generated media. ‘Consumer Generated Only’ means that the business has at least one of the consumer-generated medias, and likewise for ‘Company-Generated Only.’ ‘Both Consumer & Company-Generated’ means that a business has at least one platform from both of the groupings. As can be seen in the histogram, there is no clear relationship between having, or not having, any of the media types. The counts in the graph show that businesses most often have either neither or both types of media, as opposed to just one type.
In order to determine if year could possibly be an important factor in our GLM, we looked at variable trend graphs over the seven year period from 2010 to 2016. These were created for each social media variable by determining the claim severity for each year for both ‘Yes’ and ‘No’ presence.
29
FIGURE 11: TREND GRAPHS FOR EACH SOCIAL MEDIA VARIABLE
Overall, none of these trend graphs show a clear relationship between year and claim severity by presence. Ideally, we would have liked to see the ‘No’ and ‘Yes’ lines moving parallel to each other, as this would indicate a defined difference in claim severity year by year.
Next, we analyzed the relationship between claim severity and the number of reviews on either Yelp or TripAdvisor. We chose to bucket the number of reviews by increments of one hundred.
30
FIGURE 12: CLAIM SEVERITY BY THE NUMBER OF YELP AND TRIPADVISOR REVIEWS
FIGURE 13: COUNT FOR THE NUMBER OF BUSINESSES IN EACH REVIEW BUCKET
The chart below the graph features the count of businesses contained within each bucket. Most notable is the tapering off of a presence for both Yelp and TripAdvisor beyond 100
reviews. In this bucket, it is also worthwhile to note how similar the claim severities for both websites are, with a value of $4,792.66 for Yelp and $4,967.24 for TripAdvisor. Since most of both sites’ presence is concentrated within this first bucket, it may be a worthwhile venture in the future to break down this bucket into smaller increments. A business with only one review could be considered to be very different from a business with 99 reviews. After this first bucket, no clear pattern can be observed between the two sites.
A similar analysis involved investigating the relationship between the overall business rating on either Yelp or TripAdvisor and their average claim severities.
31
FIGURE 14: CLAIM SEVERITY BY YELP AND TRIPADVISOR RATING
FIGURE 15: COUNT FOR THE NUMBER OF BUSINESSES IN EACH RATING BUCKET
In this case, a rating of 1.0 is the worst, while 5.0 is the best. One can once again see that there is a drastic difference between the counts of businesses within each bucket. For Yelp, a rating of greater than 3.0 seems to be most popular. For TripAdvisor, very few businesses have below a 4.0 rating. We found that businesses were consistently rated higher on TripAdvisor than Yelp. One possible reason behind this could be that for Yelp, users are able to rate businesses by 0.1 increments, while TripAdvisor uses 0.5 increments. This means that a business could perhaps receive a 4.3 on Yelp, but a 4.5 on TripAdvisor. However, this could also work against
TripAdvisor; a business could receive a Yelp rating of 4.2 but a TripAdvisor rating of 4.0. Aside from this rating discrepancy, we could not identify any other reasons for the major difference between the two websites. In the buckets where counts are somewhat comparable (3-4 and 4-5), the average claim severities are very similar between the two sites.
GLM
R
ESULTSThe best iteration of the GLM utilized the parameters website, Yelp page, policy sub-region, and bucketed policy years (2010-2013, 2014-2016). The linear combination of the
32
create the equation to generate the predicted claim severity. Since we utilized the log link function, this means that the log of the expected claim severity is set to be equal to the linear combination of the parameters and estimates, as seen below.
log(E[claim severity]) = β0 + β1×WebsiteNo + β2×WebsiteYes + β3×YelpPageNo + … + ε
The Beta values from the equation are obtained from the estimate column of the SAS GENMOD output shown below.
FIGURE 16: PARAMETER ESTIMATES FROM SAS GLM OUTPUT
To better judge the fit of the model, we created a scatterplot of the actual versus predicted claim severity values, shown below.
33
FIGURE 17: ACTUAL VERSUS PREDICTED CLAIM SEVERITY SCATTERPLOT
To create this scatterplot, the data set of 1,348 businesses were sorted from smallest to largest actual claim severity and given an index number. Each business’ actual and predicted values were plotted. The scatterplot visibly shows that the GLM equation is not a good fit. The model overstates the lower claim severities, while severely understating the higher.
The graph below shows the result of zooming in closer to where the ‘Actual’ line crosses the ‘Predicted.’
34
There is still a lot of volatility around the ‘Actual’ line, over-predicting values by up to $4,000 and under-predicting them by up to $8,000. This further shows the poor fit of our GLM and the lack of a predictive relationship between our variables and claim severity.
As stated in the methodology, we did perform validation testing of our model to further confirm the lack of a good fit. The scatterplot below shows a similar plot to those above for the actual versus predicted claim severity for the test sample.
FIGURE 19: ACTUAL VS. PREDICTED CLAIM SEVERITY FOR THE TEST SAMPLE
Once again, the similar shape as the build sample and the lack of a clear pattern further confirms the ill fit of this GLM. At this point, we concluded our analyses and accepted that, limited to the variables that we collected, there is not a model that possesses high predictive power.
There are several reasons that we have identified for the lack of a well-fitting predictive model. The first is that we utilized reviews made by customers, but losses for claims relating to workers. In order to do this comparison, we had to make the intuitive leap that if a business is treating its customers poorly (or well), then they are also treating their workers the same way. It is possible that we could see stronger predictive power if we analyzed consumer reviews and general liability insurance or worker reviews and workers’ compensation insurance. With the
35
data that we were originally given, we had the most information relating to workers’
compensation insurance and the restaurant industry; the other buckets were too small for us to consider using them for a worthwhile analysis. Employee sites like Glassdoor exist, where past and current employees can leave reviews of businesses where they have worked. However, these sites are not as common for the restaurant and hospitality industry, so we chose not to utilize them since we were under time constraints for collecting data.
Additionally, since we were looking at claim severity, we only analyzed businesses where a claim was reported. Ideally, a company would want to insure a business that has no claims, as opposed to a small amount. It may be worthwhile to analyze businesses with no claims as well and use a response variable such as loss ratio.
Finally, due to the time constraints of this project and the illegality of screen scraping data, we were only able to gather easily-collected data for each business. It is possible that social media presence does have predictive power, just with variables that we were not able to collect. We will go into more detail about future recommendations for the continuation of this project in the next section.
36
C
ONCLUSIONS&
R
ECOMMENDATIONSWith the growing presence of social media, it is becoming more and more important to harness the potential wealth of information from these sources. For our project, we analyzed current Big Data trends and determined how to best involve social media data in our project. We further developed a generalized linear model to predict claim severity for The Hanover’s
workers’ compensation insurance in the restaurants and food services industry. We then compared each business’ actual claim severity to the predicted claim severity calculated by the model. Looking at these results, we came to one main conclusion:
The social media variables that we gathered are not accurate predictors of claim severity for an individual business. Through our scatterplot analysis of actual versus predicted claim severity variables, it is easy to see that our model is not accurate, even when iteratively reduced to the best combination of variables. Thus, we can conclude that the specific social media variables that we gathered are not accurate in terms of predicting claim severity for workers’ compensation insurance in the restaurant industry.
While there is not much that can be drawn from the actual results of our analysis, we do have several recommendations that could be used to improve the usability of our project and other social media data in the future:
Our first recommendation is to expand the original data set that we received for analysis. Our group received mailing addresses for each policy, which sometimes did not correspond to the business’ actual location. Thus, for these businesses, we could not be sure if they did not exist on social media or if we were just given their mailing address. This may have made some of our gathered social media data inaccurate, as these businesses were automatically recorded as not having a social media presence.
Additionally, for workers’ compensation insurance, there are two major types of claims: medical and indemnity. Medical claims refer to instances when the injured party is able to
immediately return to work, while indemnity claims require time off and payment for lost wages. As can be expected, indemnity claims typically have a much higher loss amount than medical.
37
We believe that it would have been helpful if each workers’ compensation claim could have been categorized as medical or indemnity. Adding this variable would have improved our model, especially in reducing the residuals for very large and very small claims.
We also recommend gathering more data in the future. Since our data had to be hand-collected in a very short period of time, we were very limited in what we could or could not collect. We think that it would be beneficial to gather data such as review dates, which would allow for the tracking of trends over time, and the review rating distribution, to see the composition of reviews making up the overall score.
Additionally, Sentiment Analysis could be used on the actual text of each review to determine the writer’s overall attitude towards the business. Also known as ‘opinion mining,’ Sentiment Analysis evaluates key words within text to determine if the expression is positive, negative, or neutral and to what degree (“What is Sentiment Analysis?,” n.d.). In order to perform this sort of analysis, The Hanover would likely have to form a relationship with the site from which they are gathering reviews. For example, with Yelp, their API restricts users to 25,000 calls per day and only allows for the storing of its data for up to 24 hours. Users must pay a fee in order to gather and store more information, the cost of which is provided on a case-by-case basis (“FAQ,” n.d.).
Finally, we recommend gathering information from industry-specific websites, such as Zomato and OpenTable for restaurants, or ezCater for catering/food services companies. Intuition suggests that these sites may provide more valuable information in certain
circumstances. Finally, it would be helpful to look at employer websites such as Glassdoor, which allow former or current employees to leave reviews of businesses where they work. This would be especially helpful for workers’ compensation insurance, as it would not involve making the leap that customers and workers are treated similarly, which is what we did for our project.
38
R
EFERENCESBeal, V. (n.d.). “API - application program interface.” Webopedia. Retrieved from http://www.webopedia.com/TERM/A/API.html.
Breiman, L. (2001, January). “Random Forests.” University of California. Retrieved from https://www.stat.berkeley.edu/~breiman/randomforest2001.pdf.
Brownlee, J. (2016, April 8). “Classification and Regression Trees for Machine Learning.”
Machine Learning Algorithms. Retrieved from
http://machinelearningmastery.com/classification-and-regression-trees-for-machine-learning/.
Burger, K. (2013, June 4). “Is Big Data Insurers’ Savior - Or Destroyer?” InformationWeek Insurance & Technology. Retrieved from http://www.insurancetech.com/data-and-analytics/is-big-data-insurers-savior-and-8212-or-destroyer/a/d-id/1314594?.
“Capitalizing on Big Data Analytics for the Insurance Industry.” (2012). StackIQ. Retrieved from
https://cdn2.hubspot.net/hub/173001/file-18488782-pdf/docs/stackiq_insuranceind_wpp_f.pdf.
“Core Skills.” (n.d.). The Hanover Insurance Group. Retrieved from http://www.hanover.com/about-core-skills.html.
“Data Science in Insurance.” (n.d.). Master’s in Data Science. Retrieved from http://www.mastersindatascience.org/industry/insurance/.
Dunham, K. (2014, May 7). “The Beginner’s Guide to Social Media Metrics: Sentiment.”
Hootsuite. Retrieved from https://blog.hootsuite.com/beginners-guide-sentiment/. “FAQ.” (n.d.) Yelp. Retrieved from https://www.yelp.com/developers/faq.
Fu, L. and Moncher, R.B. (n.d.). “Severity Distributions for GLMs: Gamma or Lognormal? Evidence from Monte Carlo Simulations.” Casualty Actuarial Society. Retrieved from https://www.casact.org/pubs/dpp/dpp04/04dpp149.pdf.
“Get Workers’ Comp for your small business.” (n.d.). Progressive Commercial. Retrieved from https://www.progressivecommercial.com/business-insurance/workers-compensation-insurance/.
“Generalized Linear Models Theory” (2010, June 22). SAS Support. Retrieved from
https://support.sas.com/documentation/cdl/en/statug/63347/HTML/default/viewer.htm#st atug_genmod_sect037.htm#statug.genmod.genmodll
Gil, L. (2014, September 25). “9 ways to unleash the power of social media in insurance.”
LifeHealthPRO. Retrieved from http://www.lifehealthpro.com/2014/09/25/9-ways-to-unleash-the-power-of-social-media-in-ins.
39
Golia, N. (2013, June 26). “Are Insurers Ready for Technological Disruption?” InformationWeek Insurance & Technology. Retrieved from http://www.insurancetech.com/are-insurers-ready-for-technological-disruption/a/d-id/1314638?.
Hampton, K., Raine, L., Lu, W., Dwyer, M., Shin, I., & Purcell, K. (2014, August 26). Social Media and the ‘Spiral of Silence’ | Pew Research Center. Retrieved from
http://www.pewinternet.org/2014/08/26/social-media-and-the-spiral-of-silence/. Kenealy, B. (2013, June 3). “Insurers finding ways to use social media in underwriting, claims
handling.” Business Insurance. Retrieved from
http://www.businessinsurance.com/article/99999999/NEWS070109/130609971?tags. Leskovek, J. (2011). Analytics and Predictive Models for Social Media [Powerpoint Slides].
Retrieved October 26, 2016, from http://snap.stanford.edu/proj/socmedia-www/socMedia-www11-part1.pdf.
“Likelihood, AICc, and BIC.” (n.d.). JMP. Retrieved from
https://www.jmp.com/support/help/13-1/Likelihood_AICc_and_BIC.shtml.
Loh, W. (2011). “Classification and regression trees.” Data Mining and Knowledge Discovery, 1(1), 14-23. Retrieved from http://www.stat.wisc.edu/~loh/treeprogs/guide/wires11.pdf. Moynihan, P. S. (2014, June 12). Top 100 P&C Insurance Companies, Ranked by Net Premiums
Written. Retrieved from http://www.propertycasualty360.com/2014/06/12/top-100-pc-insurance-companies-ranked-by-net-premi
“Our History.” (n.d.). The Hanover Insurance Group. Retrieved from http://www.hanover.com/about-history.html.
Reeves, L. (n.d.). “What is Workers’ Comp Indemnity?” AZ Central. Retrieved from http://yourbusiness.azcentral.com/workers-comp-indemnity-16623.html.
“Regression Trees.” (n.d.) FrontlineSolvers. Retrieved from http://www.solver.com/regression-trees.
Rose, S. (2013). “PERSPECTIVES: Social media helps insurers detect fraud, but doesn’t replace analytics.” Business Insurance. Retrieved from
http://www.businessinsurance.com/article/20130610/STORY/130619975?template=print art.
“Screen Scraping.” (n.d.). Techopedia. Retrieved from
https://www.techopedia.com/definition/16597/screen-scraping.
Simonoff, J. S., SpringerLink (Online service), & SpringerLink ebooks - Mathematics and Statistics (Archive). (2003). Analyzing categorical data (1st ed.). New York, NY: Springer New York. doi:10.1007/978-0-387-21727-7
40
“6.1 - Introduction to Generalized Linear Models.” (n.d.). Penn State: Department of Statistics Online Learning. Retrieved from https://onlinecourses.science.psu.edu/stat504/node/216. Snell, J. & Care, D. (2013, August 28). “Use of Online Data in the Big Data Era: Legal Issues
Raised by the Use of Web Crawling and Scraping Tools For Analytics Purposes.”
Bloomberg BNA. Retrieved from http://www.bna.com/legal-issues-raised-by-the-use-of-web-crawling-and-scraping-tools-for-analytics-purposes.
Sorokina, O. (2015, January 20). “How To Make Social Media Data Work For You.” Hootsuite. Retrieved from https://blog.hootsuite.com/social-media-data/.
Southwood, K. & Ihrke, J.J. (2016, February). “P&C insurers’ big data aspirations for advanced predictive analytics.” Willis Towers Watson. Retrieved
from https://www.towerswatson.com/en-US/Insights/Newsletters/Americas/americas-insights/2016/pc-insurers-big-data-aspirations-for-advanced-predictive-analytics.
“The big data rush: how data analytics can yield underwriting gold.” (2013, April 25). Ordnance Survey. Retrieved from https://www.ordnancesurvey.co.uk/about/news/2013/the-big-data-rush.html.
“The GLM Procedure.” (n.d.). SAS/STAT 9.2 User’s Guide. Retrieved from
https://support.sas.com/documentation/cdl/en/statugglm/61789/PDF/default/statugglm.pd f.
“Top 5 Workers Compensation Claims and Their Causes.” (2016, 18 May). Insurance Journal. Retrieved from http://www.insurancejournal.com/news/national/2016/05/18/409006.htm. “12.1 - What is Multicollinearity?” (n.d.). Penn State: Department of Statistics Online Learning.
Retrieved from https://onlinecourses.science.psu.edu/stat501/node/344. “What is Sentiment Analysis?” (n.d.). Clarabridge. Retrieved from
http://www.clarabridge.com/sentiment-analysis/.
Windt, L. & Henk, M.A. (2016, July 20). “Insurance fraud and social media.” Milliman.
41
A
PPENDIX:
SAS
C
ODEODS GRAPHICS ON; PROC SQL;
CREATE VIEW WORK.SORTTempTableSorted AS SELECT *
FROM WORK.'data set for analysis'; QUIT;
TITLE1 "Generalized Linear Models Analysis"; FOOTNOTE;
FOOTNOTE1 "Generated by the SAS System (&_SASSERVERNAME, &SYSSCPL) on %TRIM(%QSYSFUNC(DATE(), NLDATE20.)) at %TRIM(%SYSFUNC(TIME(), TIMEAMPM12.))";
%web_drop_table(WORK.IMPORT);
FILENAME REFFILE '/folders/myfolders/sasuser.v94/’data set for analysis.xlsx'; PROC IMPORT DATAFILE=REFFILE
DBMS=XLSX
OUT=WORK.IMPORT; GETNAMES=YES; RUN;
PROC CONTENTS DATA=WORK.IMPORT; RUN; %web_open_table(WORK.IMPORT);
PROC GENMOD DATA=WORK.IMPORT PLOTS(ONLY)=ALL;
CLASS Website YelpPage PolicySubRegions BucketedPolicyYears;
MODEL ClaimSeverity = Website YelpPage PolicySubRegions BucketedPolicyYears/ LINK= LOG DIST=GAMMA TYPE1 TYPE3 WALD CL ALPHA=0.05 CORRB COVB LRCI;
OUTPUT OUT=WORK.PREDGLMPredictions(LABEL="Generalized Linear Models predictions and statistics for WORK.'data set for analysis'")
42 PREDICTED=predicted_ClaimSeverity RESDEV=resdev_ClaimSeverity RESCHI=reschi_ClaimSeverity RESLIK=reslik_ClaimSeverity STDRESCHI=stdreschi_ClaimSeverity STDRESDEV=stdresdev_ClaimSeverity ; RUN; QUIT; TITLE;
TITLE1 "Generalized Linear Models Predictions";
PROC PRINT NOOBS DATA=WORK.PREDGLMPredictions ;
RUN; QUIT;
FOOTNOTE;