International Publications Key Workplace Documents
4-2017
Why Do Migrant Households Consume So Little?
Why Do Migrant Households Consume So Little?
Xiaofen ChenTruman State University
Follow this and additional works at: https://digitalcommons.ilr.cornell.edu/intl Thank you for downloading an article from DigitalCommons@ILR. Thank you for downloading an article from DigitalCommons@ILR. Support this valuable resource today!
Support this valuable resource today!
This Article is brought to you for free and open access by the Key Workplace Documents at DigitalCommons@ILR. It has been accepted for inclusion in International Publications by an authorized administrator of
DigitalCommons@ILR. For more information, please contact catherwood-dig@cornell.edu.
If you have a disability and are having trouble accessing information on this website or need materials in an alternate format, contact web-accessibility@cornell.edu for assistance.
Exploring data from the urban and migrant household surveys of the Chinese Household Income Project (CHIP), this paper dissects the underlying causes of the depressing effect of the hukou system on migrant household consumption into two channels. On one hand, the disentitlement to local urban hukou promotes temporary migration and incentivizes migrant households to save their transitory income. On the other hand, it creates financial insecurity through barriers to employment, social welfare, and medical insurance, etc., thereby encouraging precautionary saving. Factors reflecting these considerations, such as medical and pension insurance, the duration of migration, and local homeownership, are specifically modeled, and are found to contribute to the discrepancies in consumption between migrant and local urban households, among other factors. In addition, the marginal propensity to consume exhibits heterogeneity across households; it is higher with a longer duration of migration, local homeownership, and self-employment. The lack of these attributes further reinforces the reluctance of migrant households to consume.
Keywords Keywords
consumption, migrant household, marginal propensity to consume Comments
Comments Suggested Citation Suggested Citation
Chen, X. (2017). Why do migrant households consume so little? (ADBI Working Paper Series No. 727). Tokyo: Asian Development Bank Institute.
Required Publisher's Statement Required Publisher's Statement
© Asian Development Back. Available at ADB’s Open Access Repository under a Creative Commons Attribution license (CC BY 3.0 IGO).
ADBI Working Paper Series
WHY DO MIGRANT HOUSEHOLDS
CONSUME SO LITTLE?
Xiaofen Chen
No. 727
April 2017
The Working Paper series is a continuation of the formerly named Discussion Paper series; the numbering of the papers continued without interruption or change. ADBI’s working papers reflect initial ideas on a topic and are posted online for discussion. ADBI encourages readers to post their comments on the main page for each working paper (given in the citation below). Some working papers may develop into other forms of publication.
ADB recognizes “China” as the People’s Republic of China. Suggested citation:
Chen, X. 2017. Why Do Migrant Households Consume So Little? ADBI Working Paper 727. Tokyo: Asian Development Bank Institute. Available: https://www.adb.org/publications/why-do-migrant-households-consume-so-little
Please contact the authors for information about this paper. Email: xiaofen@truman.edu
Xiaofen Chen is professor, Department of Economics, Truman State University, Missouri, United States.
The views expressed in this paper are the views of the author and do not necessarily reflect the views or policies of ADBI, ADB, its Board of Directors, or the governments they represent. ADBI does not guarantee the accuracy of the data included in this paper and accepts no responsibility for any consequences of their use. Terminology used may not necessarily be consistent with ADB official terms.
Working papers are subject to formal revision and correction before they are finalized and considered published.
Asian Development Bank Institute Kasumigaseki Building, 8th Floor 3-2-5 Kasumigaseki, Chiyoda-ku Tokyo 100-6008, Japan Tel: +81-3-3593-5500 Fax: +81-3-3593-5571 URL: www.adbi.org E-mail: info@adbi.org
Abstract
Exploring data from the urban and migrant household surveys of the Chinese Household Income Project (CHIP), this paper dissects the underlying causes of the depressing effect of the hukou system on migrant household consumption into two channels. On one hand, the disentitlement to local urban hukou promotes temporary migration and incentivizes migrant households to save their transitory income. On the other hand, it creates financial insecurity through barriers to employment, social welfare, and medical insurance, etc., thereby encouraging precautionary saving. Factors reflecting these considerations, such as medical and pension insurance, the duration of migration, and local homeownership, are specifically modeled, and are found to contribute to the discrepancies in consumption between migrant and local urban households, among other factors. In addition, the marginal propensity to consume exhibits heterogeneity across households; it is higher with a longer duration of migration, local homeownership, and self-employment. The lack of these attributes further reinforces the reluctance of migrant households to consume.
Keywords: consumption, migrant household, marginal propensity to consume
Contents
1. INTRODUCTION ... 1
2. FINANCIAL INSECURITY, TEMPORARY MIGRATION, AND CONSUMPTION ... 2
3. THE MODEL ... 6
4. RESULTS ... 11
5. CONCLUSION ... 17
1. INTRODUCTION
In recent decades, urban areas in the People’s Republic of China (PRC) have received large flows of migration from rural areas, a typical phenomenon in a dual economy during a period of rapid economic growth. In the meantime, persistently low domestic consumption has raised concerns over the insufficiency of demand to cope with external shocks. Since migrant workers account for an increasing portion of the urban labor force, the importance of their consumption expenditure has risen for the local economy as well as the national economy.
This paper contributes to the scant literature on explaining migrant consumption in the PRC. It distinguishes from the existing literature in the following aspects. First, it attempts to dissect the effect of the hukou system (household registration of residence) on consumption, rather than considering the hukou system as a whole, as in the literature. It argues that the hukou system affects consumption and saving through two distinct channels. On one hand, disentitlement to local urban hukou is the main reason why the nature of rural-to-urban migration in the PRC is temporary, which causes migrant households to treat their income as transitory income. Consistent with the permanent income theory, research has shown that temporary migration results in increased saving (Dustmann, 2003; Dustmann and Görlach 2015). On the other hand, non-local hukou also creates financial insecurity through barriers to employment, social welfare, and medical insurance, etc., thus increasing the need for precautionary saving. These motives for saving should be clearly modeled to disentangle the underlying causes of the depressing effect of the hukou system on migrant consumption. By doing so, this paper contributes to the understanding of how different privileges associated with local urban hukou affect consumption, thereby providing implications for possible paths for reforms to accommodate rapid urbanization and economic transformation. Second, this paper considers how well migrants are integrated in tastes and values in local urban areas as a factor in determining their consumption levels, deriving from the literature on the effect of cultural values on consumption, for example, Kim et al. (2002). In the literature on migrant household consumption, Acharya and Leon-Gonzalez (2015) find that consumption by migrant households in Nepal gradually increases and converges to the level of local residents. Danzer et al. (2014) discover that recent migrant workers may resort to conspicuous consumption in an effort to gain higher socioeconomic status despite having similar income levels.
With the above considerations, this paper examines new household characteristics that have not been specifically studied by the existing literature on explaining migrant consumption in the PRC, for example, medical insurance coverage (for the precautionary saving motive), local homeownership (an indicator of permanent migration), duration of migration (to represent the transience of migration and convergence in tastes and values), and employer-provided room and board subsidies (as an unreported source of income and a substitute for consumption to some extent). The literature explaining migrant consumption in the PRC is sparse, but several studies have emerged recently, including Chen et al. (2015), Wang and Fang (2015), Dreger et al. (2015), Fang and Sakellariou (2016), and Chen (2017), all of which suggest that migrant households consume less than their local counterparts. As pointed out previously, these studies often treat the hukou system as a whole, and specific disadvantages of non-local hukou are rarely examined, except for the household pension coverage rate in Wang and Fang (2015). Thus, the link of consumption to institutional conditions and household characteristics is far from being adequately explained.
In addition, sample weights may be neglected in the aforementioned studies on migrant consumption in the PRC, likely resulting in biases in estimation. In contrast, the sample weights used in this study are carefully constructed following a publication on the design of the surveys (Song et al. 2013). Moreover, the model in this paper incorporates nonlinearity of the functional form and employs a larger database that combines both CHIP 2007 and CHIP 2008. It also introduces extensive interactions between household characteristics and income per capita, leading to the derivation of heterogeneity of marginal propensity to consume.
The paper finds that consumption and the marginal propensity to consume exhibit heterogeneity across households, unlike in Chen et al. (2015) and Wang and Fang (2015). Social welfare programs (especially medical and pension insurance), self-employment, an urban hukou, longer durations of migration, living in self-owned homes, and education all have sizable positive effects on consumption. In addition, the marginal propensity to consume is higher with a longer duration of migration, local homeownership, and self-employment. The lack of these attributes further reinforces the reluctance of migrant households to consume. Thus, to increase migrant households’ consumption, policies improving these conditions for migrant households may be designed, among which providing adequate medical and pension insurance may be the easiest to adopt.
2. FINANCIAL INSECURITY, TEMPORARY MIGRATION,
AND CONSUMPTION
Consumption and saving are essentially two perspectives of the same issue. A lower consumption rate represents a higher saving rate and vice versa. A host of literature exists on the explanation of household saving behavior. Typical theories being tested in the empirical literature include the permanent income theory, the life cycle theory, and the motives for precautionary saving and intergenerational transfer. Based on these theories, factors such as per-capita income growth, income uncertainty, the age dependency ratio, inflation, and the real interest rate are commonly examined in the literature. Determinants specific to the PRC are also tested in various research. Examples include housing prices (Wang and Wen 2012), health insurance (Cheung and Padieu 2015), bequests (Yin 2012), the pension reform (Ang 2009), family structure (Zhou 2014), and the pre-marital sex ratio (Wei and Zhang 2011). Studies on migrant household consumption in the PRC are rather scant, as reviewed in Section 1. Data used in this paper are from the urban and migrant household surveys in CHIP 2007 and 2008.1 The Urban Household Survey in CHIP 2008 does not include
expenditure data. Thus, the analyses are mainly based on the 2007 urban and migrant household surveys and the 2008 migrant household survey. Each dataset contains about 5,000 randomly selected households in 15 large and medium-sized cities from nine provinces and provincial-level metropolises.2 The migrant surveys are in
essence surveys of rural-to-urban migrant households. The vast majority (81%) of household heads have non-local rural hukou; an additional 18% have local rural hukou. The remaining 1% either have non-local urban hukou or have acquired local urban hukou. Likewise, the urban household surveys are essentially surveys of local urban households.
1 CHIP 2007 and CHIP 2008 were actually conducted in 2008 and 2009, respectively.
2 For detailed descriptions of the survey design, see Luo et al. (2013), Kong (2010) and Akgüç et al.
(2014).
2
A comparison of data from the 2007 migrant and urban household surveys reveals that migrant households consume much less than their local urban counterparts. As shown in Table 1, the mean consumption rate for all migrant households is two percentage points lower than for all urban households, even though migrant income per capita is less than half of the local urban level.3 To examine further, three types of migrant and
local urban households with similar structures and income levels are compared: unmarried individuals without children, married or cohabiting couples without children, and married or cohabiting couples with one child.4 Those with spouses and children
living apart or with additional family members living in the same household are excluded, and local urban households’ income level is limited to no more than CNY50,000. With these constraints, the difference in the consumption rates between migrant and local urban households is further enlarged to 9 percentage points. For those residing in metropolises and coastal cities, it is a wide gap of 15 percentage points.5 Even if their remittances (about 8% of household income on average) are
treated as consumption, which may well not be the case as these are households with all family members living in the same household, the average consumption rate is still substantially lower than the local urban level.
Table 1: Annual Household Income and Consumption Per Capita Income (CNY) Per Capita Consumption (CNY) Consumption Rate (%) Migrant Households
All households in CHIP 2007 27,358 10,774 62.7
Common household structure with
1–3 people in sizea 32,646 8,993 66.4
Unmarried living alone 16,847 9,850 58.7
Couple without children 32,142 9,632 65.5
Couple with one child 39,877 8,319 70.3
Metropolises and coastal citiesb 34,657 9,616 63.9
All households in CHIP 2008 27,468 11,223 65.8
Urban Households
All households in CHIP 2007 57,779 12,181 68.3
Common household structure with
1–3 people in sizea,b 31,267 9,004 74.5
Unmarried living alone 22,108 14,173 69.4
Couple without children 30,609 10,224 69.3
Couple with one child 32,513 7,914 77.4
Metropolises and coastal cities 32,749 10,103 79.3
a For households with all family members living in the same household.
b For households with income of no more than CNY50,000.
Source: Author.
3 Summary data presented in this section are not adjusted by sample weights.
4 Composition of household structure differs widely between the 2007 and 2008 Migrant Household
Surveys, with a much higher portion of unmarried persons living alone in the 2008 survey. The mean consumption rates are higher in 2008 than in 2007 for all three subgroups in the table (although still lower than the local urban level in 2007), especially for unmarried persons living alone. This is likely caused by macroeconomic reasons, since the survey time is toward the end of a global recession. For these reasons, the 2008 survey data are not included in the comparison of the subgroups.
5 Including Shanghai, Chongqing, Chengdu, and cities in Jiangsu, Zhejiang, and Guangdong.
3
Note that even after controlling for household structure and income, consumption is still not perfectly comparable between migrant and local urban households, for reasons such as price discrimination. For example, because of the constraint of their non-local hukou, migrant households often cannot send their children to public schools and have to pay considerably higher tuition in private schools. For this reason, the consumption level can be overstated for migrant households who have young dependents living with them, which account for nearly one-fifth of the sample. The overstatement can be substantial given that the mean education expenses are 12% and 9% of total expenditure in the 2007 and 2008 surveys, respectively. However, it is not possible to correct for price discriminations since the expenditure data is far less detailed for urban households and only includes five broad subcategories.
A key division in status between migrant and local urban households lies in the hukou they hold. As pointed out by many researchers, the hukou system imposes constraints on migrant households through employment, housing, and access to local public education and welfare programs, etc. Examining the survey data, it is clear that the inferior non-local, rural hukou, to which the vast majority of migrant households are assigned, creates two main problems for migrants: financial insecurity and transience of migration.
Without local urban hukou, migrants have limited employment opportunities and often have to undertake low paid jobs, a situation partly caused by their lower education levels. The median years of schooling are 9 years for migrants aged 16 years or older, which is 3 years less than their local urban counterparts. However, mean income levels for migrants are lower than local urban residents at all education levels, and the education premium is much lower for migrants, as pointed out by Chen (2017). The survey data suggest that per worker migrant income levels are 89%, 73%, and 57% of the local urban levels for those with schooling of 9 years or less, 10–12 years, and more than 12 years, respectively. The discrimination in wages against migrant workers has been documented in existing research (for example, Frijters et al. [2011]).
Table 2 presents combined data derived from the surveys in both 2007 and 2008.6
Most local urban workers (80%) are employed under permanent or long-term contracts; only 11% of them work without contracts, and 9% are self-employed. In contrast, more than half of the migrant workers either hold temporary jobs or are self-employed. Not only is income their more uncertain as a result but they are also far less likely to participate in various social welfare programs, which are more likely to accompany jobs with contracts, especially permanent and long-term contracts. For example, 23% of migrant workers and 87% of local urban workers among those with contracts are covered by pension plans. Among those without contracts or the self-employed, only 6% of migrants and 51% of local urban workers participated in any pension plan. This data also shows a stark contrast in social welfare coverage rates between migrants and local urban residents for all employment types.
Although two-thirds of the migrants reported having medical insurance coverage, their medical insurance is acutely inadequate. When incurring medical expenses, they pay as much as 95% of the expenses out of their own pockets, as opposed to an average of only 53% for local urban residents. The high out-of-pocket payments along with insurance constraints in clinic locations and their unfamiliarity with the local healthcare system often force migrants to avoid or minimize seeking medical help when needed. As a result, their average medical expenses are only a small portion of those for local urban residents. Even for adults aged between 16 and 45 years, for which data are more comparable since migrant workers are relatively younger, the
6 The table also includes data from the 2008 Urban Households Survey.
4
average medical expenses of migrants are less than 40% of the amount of their local urban counterparts.
In addition, for workers with contracts covered by insurance, it is common for employers to pay the entire insurance premium or a majority portion of the premium; but it is rare for workers without contracts to receive such benefits. For example, among those without contracts who are covered by pension plans, over one-third of migrant workers and over one-half of local urban workers have to shoulder the entire cost themselves, in contrast to less than 8% of those with contracts for both migrant and local urban workers. In terms of unemployment and worker compensation insurance, between 18% and 25% of migrant workers and between 31 and 38% of local urban workers without contracts are paying the premiums fully by themselves, as opposed to only 2%–4% of both cohorts with contracts.
Table 2: Comparison of Employment Types and Social Welfare Coverage
(for adults aged 16 years and older)
Migrant Urban Local Employment Type
Permanent, long-term, and short-term contracts 47% 80%
Without contracts 24% 11%
Self-employment 29% 9%
Covered by unemployment insurance 11% 47%
Covered by pension plans 19% 67%
Covered by worker compensation insurance 16% 41%
Housing fund provision 7% 39%
Covered by medical insurance 67% 76%
Individuals with medical insurance and medical expenses during the last 3 months:
Medical expenses due to illnesses or injuries (including expenses
paid by insurance) CNY605 CNY2,084
Medical expenses due to illnesses or injuries if between 16 and
45 years old CNY546 CNY1,373
Out-of-pocket payment as a percentage of medical expenses 95% 53%
Source: Author.
In summary, contract employment provides more security and monetary benefits that are not represented by wages and salaries. These benefits are enjoyed by most local urban households, but not most migrant households. The lack of access to social welfare programs not only directly suppresses consumption of healthcare services but also creates a greater need for migrant households to save for precautionary purposes. The unfavorable environment for migrant households to live and work in urban areas directly results in the temporary nature of rural-to-urban migration. In the 2008 migrant survey, a quarter of the household heads had migrated from their rural homes only two and a half years or less ago (defined as the duration of migration, hereafter).7 The
median duration of migration is 70 months in the 2008 survey and 64 months in the 2007 survey. In both surveys, 15% of all adult migrants returned to their rural homes for
7 Since the precise months of the surveys are unknown, universal survey months, June 2008 and June
2009, are assigned to the two surveys, respectively, to calculate the migration durations.
5
more than 3 months at least once. For the most recent such incidences, more than half of the reasons were due to issues arising from family ties with their rural homes, for instance, looking after family members. Over one-third of the reasons were unsatisfactory jobs, earnings, or living conditions in urban areas. The maintaining of close ties with their rural domiciles reflects the temporary nature of their migration, which is largely caused by hurdles discouraging them from settling in cities. In both surveys, when asked whether they would continue to stay in cities if policy allowed, only 8% indicated that they would stay for more than 3 years, and another 5% for 1–3 years. The rest, or 87% of all adult individuals, were unsure. In other words, a dominating proportion of migrant households were prepared to return to their rural homes in the near future. This is not because of improved income in rural areas. According to the surveys, half of the migrant workers indicated that their current income at least doubled what they would have earned in their rural homes, and another quarter of them earned at least 50% more. Clearly, migrants view themselves as temporary workers and expect that their income will fall sharply on returning to their rural homes. The combination of the two incentivizes migrant households to save more while earning higher income in urban areas.
The temporary nature of migration is also reflected by the relatively younger age of migrants in comparison to local urban residents. In the 2008 survey, the median age for migrants is only 28; for local urban residents it is 42. About 17% of the local urban residents are at least 60 years old, but only 1% of migrants belong to this group. Applying the life cycle theory, the lower old dependency ratio also contributes to lower consumption rate for migrant households.
Another observation likely arising from the temporary nature of migration is the lack of migrant homeownership in host cities. In the 2008 survey, only 4% of migrant households lived in self-owned homes. Homeownership data for local urban households is not available in the survey, but according to Chamon and Prasad (2010), urban homeownership reached 86% in 2005. As documented by Quercia and Song (2007), there are many barriers for migrant households to own homes at affordable prices in their host cities. For example, subsidized homes often require local hukou. Unsurprisingly, the homeownership rate is entirely different for those with local urban hukou. Among the 42 households with local urban hukou in the 2008 migrant household survey, more than half (22 households) lived in self-owned homes.
3. THE MODEL
The CHIP surveys are designed to represent populations in the four regions: the coastal, central, and western regions, and the provincial level metropolises. Random samples are selected from one to three provinces in each region for the migrant and urban household surveys separately. However, within each region, the sample may not necessarily reflect the relative population size in each province, as detailed in Song et al. (2013). Adopting their suggestions in calculating the weights and their estimations of the local urban and long-term migrant populations in 2005, the sample weights in the following analyses account for the respective regional and provincial populations, with the assumption that the total migrant population carries the same proportion of long-term migrants as in both of the 2007 and 2008 migrant surveys in order to include short-term migrants in the estimations. There are nine provincial strata for each of the migrant and local urban surveys. In the pooled estimations with both local urban and migrant households, the population is also pooled to derive total urban population sizes for each province, and the population sizes for the long-term migrants are multiplied using the ratio of long-term migrants in Song et al. (2013) to include
short-term migrants. Accordingly, standard errors in the regressions are calculated using the Taylor series linearization method.
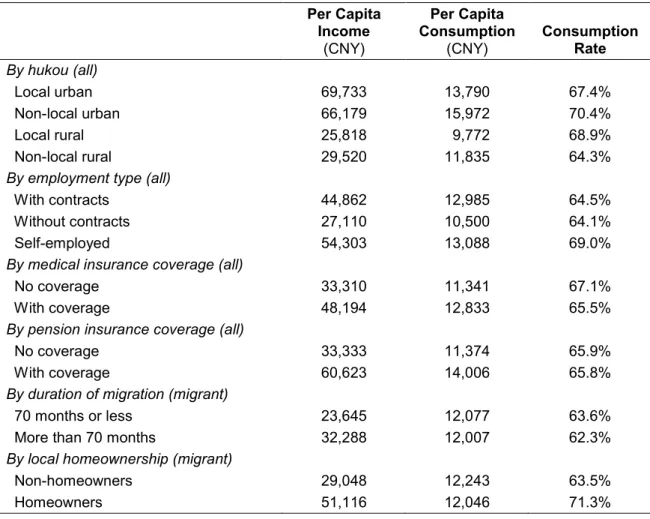
The previous section shows that migrant households are subject to the implications of financial insecurity and temporary migration. Table 3 summarizes the income and consumption levels for the subgroups of migrant households arranged by household head characteristics related to these two issues. To reduce the influence of outliers, the data have been trimmed so that households in the top 0.5% and bottom 0.5% of per capita consumption are excluded.
Table 3: Monthly per Capita Income and Consumption in Urban Areas
(by household head characteristics)
Per Capita Income
(CNY)
Per Capita Consumption
(CNY) Consumption Rate
By hukou (all)
Local urban 69,733 13,790 67.4%
Non-local urban 66,179 15,972 70.4%
Local rural 25,818 9,772 68.9%
Non-local rural 29,520 11,835 64.3%
By employment type (all)
With contracts 44,862 12,985 64.5%
Without contracts 27,110 10,500 64.1%
Self-employed 54,303 13,088 69.0%
By medical insurance coverage (all)
No coverage 33,310 11,341 67.1%
With coverage 48,194 12,833 65.5%
By pension insurance coverage (all)
No coverage 33,333 11,374 65.9%
With coverage 60,623 14,006 65.8%
By duration of migration (migrant)
70 months or less 23,645 12,077 63.6%
More than 70 months 32,288 12,007 62.3%
By local homeownership (migrant)
Non-homeowners 29,048 12,243 63.5%
Homeowners 51,116 12,046 71.3%
Source: Author.
Households with urban hukou included in the migrant surveys have noticeably higher consumption rates than those with rural hukou, as summarized in Table 3. Clearly, households with rural hukou, local or non-local, are at the bottom of the income and consumption per capita ladder; but those with non-local rural hukou distinguish themselves with the lowest average consumption rate. Among other attributes, grouping by duration of migration and medical and pension insurance does not afford evidence for the hypotheses discussed in the previous section, possibly because of large income discrepancies. However, consumption rates are distinctly different depending on local homeownership and employment types.
Evidently, homeowners spend a much higher portion of their income on consumption, in total 8 percentage points higher than non-homeowners. With 55% higher per capita spending on durable goods (not included in the table), homeownership seems to increase consumption through stimulating spending on home furnishing, equipment, and other durables. It is also possible that homeownership creates a sense of belonging toward the local city and strengthens migrants’ commitment to settling in cities, thereby reducing the transience of migration.
About 20% of the migrant household heads are self-employed. For both migrant and local urban households, the mean consumption rate for the self-employed is much higher than wage earners with or without contracts, in spite of higher income for the self-employed. Some causes resulting in the choice of self-employment over wage employment have been identified in the literature, for example, credit constraint (Frijters, Kong, and Meng 2011), unobservable characteristics of individuals (Giulietti et al. 2012), and social-family networks (Zhang and Zhao 2011). In the two migrant household surveys, only 12% of the self-employed suggest they were forced into this choice because of the lack of job opportunities. Almost half of them indicate that the main reason is freedom and flexibility as well as the opportunity of being their own bosses. Another 38% are driven by higher income. Indeed, per worker earnings for the self-employed are nearly 40% more than for wage earners.
It is possible that self-employed households can more easily see the connection between their work and the fruit of their work. Therefore, they have a better sense of control over their income and employment, and therefore feel more financially secure. Self-employed migrant households are also more likely to own homes. The homeownership rate for the self-employed is 9% in the migrant surveys, much higher than for wage earners (2%). Their spending on durable goods is particularly high. Annual per capita spending on durable goods for self-employed migrant households is nearly 40% higher than for non-self-employed migrant households, and the per capita value of durable assets owned by the self-employed ($3,091) is 60% higher than the value owned by wage earners ($1,932).
Next, variables representing the factors implied by the permanent income theory, the precautionary saving motive, and the life cycle theory are tested in the following model to derive their influences on migrant household consumption, controlling for other household characteristics that may also affect consumption. Note that all measurements correspond to members living in the same household, which does not include those living apart.
Ci= α + βYi+ δPi+ φTi+θLi+ λOi+ εi,
In the equation, Ciis annual per capita consumption for household i; α, β, δ, φ, θ, andλ
are sets of parameters; ε is the error term. Y is a vector of variables that have implications for household disposable income, including per capita annual income, per capita annual perceived monetary values of employer-provided room and board subsidies for all workers in the same household, and per capita annual net remittances to rural homes for migrant households. Note that employer-provided room and board subsidies are both an unreported source of income as well as a substitution for observed consumption. However, it is unclear to what extent they substitute consumption, as migrants may choose to spend less on housing and food without these subsidies. Thus, they should not be simply added to consumption. Also note that since urban household expenditure data does not include tuition and living expenditure payments for children living apart, to be consistent, migrant households’
net remittances only include those remitted to their rural homes, not to children who are away but not in their rural homes.
The treatment of the net remittances of migrant households deserves special attention. Clearly, some of the remittances are used for consumption by family members remaining in their rural homes, thereby boosting consumption in the rural areas. However, it is unclear how much of the remittances are spent. Further, household consumption and household size data, and therefore the calculation of per capita consumption, are based on the expenditure of household members who live in the same household in urban areas. Treating a hypothetical portion of remittances as consumption, as considered by Chen et al. (2015), will severely overstate per capita consumption in estimating the marginal propensity to consume, and will also make it problematic to interpret the results for other explanatory variables. Another choice is to treat remittances as a net deduction of disposable income. However, again, it is unclear whether migrants retain some of the remittances as savings and how much they retain. For these reasons, the variable for net remittances is not treated as consumption, but as a factor contributing to the reduction of disposable income to those who live in cities, and is allowed to have a different slope from income per capita, which is indeed the case, as the results later show.
In the above equation, P is a vector of variables representing factors contributing to households’ precautionary saving behavior, including household heads’ employment type, dummies representing whether they are covered by medical insurance, pension plans, unemployment insurance, and worker compensation (equal to 1 if they are, and 0 if not), and dummies representing the type of hukou (the base group is local urban hukou).
The variable set T includes those that reflect or affect the extent to which migrant households view their income as temporary income, including the duration of migration and homeownership in the host city. These variables also allow for differentiation between migrant households. Not having a local urban hukou is, of course, a direct source of temporary migration, as in Chen et al. (2015). The answers to the question of whether they intend to stay if allowed, and for how long, can also be a candidate, but they are self-reported responses to a hypothetical question, and may not reflect what truly governs their consumption behavior. Indeed, the dummies for these answers are highly insignificant when included, and are therefore removed in the subsequent regressions. A potential endogeneity bias for the homeownership dummy is addressed later.
The duration of migration is a close proxy for the duration of urban residence. The shorter it is, the more likely migrants are to view themselves as temporary migrants. On the other hand, it may also represent migrant households’ convergence in tastes and values to those of local urban residents. As demonstrated by researchers (for example, Kim et al. 2002), cultural values play an important role in consumer behavior. Given the large gaps in development and income levels between rural and urban areas, disparities in values may exist between rural and urban households. In recent decades, the PRC has undergone enormous changes culturally and socially. The transformation from a nearly closed society to a remarkably open economy is as extraordinary as its economic miracle. Measured by the KOF globalization index (Dreher [2006] and Dreher et al.[ 2008]), the PRC’s degree of globalization in the social and cultural dimensions has exceeded the world average since the 1990s. New ideas and values are generated and exchanged, reshaping lifestyles and consumption patterns. The urban areas are at the forefront of such transformations, whereas the rural areas lag behind in this aspect. Thus, households in the rural areas would more closely represent the traditional values of Chinese society. When they move to urban areas, their traditional values are bound
to influence how much they consume and what they spend on. But as their duration of urban residence increases, they are likely to be influenced by the local urban culture, and their lifestyles and consumption patterns may then converge to those of local urban residents. In turn, the assimilation of lifestyles will enhance the likelihood for them to continue to stay in cities.
L denotes variables that are based on the life cycle theory, including household head age and the age dependency ratio at the household level. The life cycle theory suggests that the middle-aged group saves the most, implying that the relationship between age and consumption is not linear; thus, the square of age is also included. Also, because parents may save more for unmarried boys than for girls (Wei and Zhang 2011), the young dependent ratio is also split into the young male and female dependency ratios in some regressions. However, detailed information for young dependents that do not live in the same household is often unavailable. To prevent a large portion of the observations from being dropped, when the complete gender information is not available, the number of male dependents in the same household is used to calculate the male dependency ratio, from which the female dependency ratio is derived. Thus, the young male dependency ratio should be interpreted as the lower bound of this ratio, and the young female dependency ratio is the upper bound.
The variable set O includes the control variables. They are the household heads’ years of schooling, a dummy indicating whether they are married, household size, province dummies, and the migrants’ homeownership rate in the local city. A dummy representing the 2008 survey is also included to account for time-varying factors. The role of education in the choice of lifestyles and consumption patterns has been discussed in existing research (see, for example, Michael [1975]). In terms of household structure, living with other family members can have the benefit of economies of scale and allow savings on housing and household operation costs. In the 2008 migrant survey, monthly consumption averages CNY1,106 per month for those living alone, whereas those who live with others only spend CNY844 per person per month. Married couples living together may have a better sense of home in the host city and therefore spend more on home furnishing. On the other hand, they may also save on items such as food if they eat at home more often. The dummies for provinces are used to capture location differences in the cost of living, lifestyles, local economic conditions, etc.
The migrant homeownership rate in the local city (as a percent of all migrant households) differs greatly. It ranges between 0.4% (in the city of Shenzhen in Guangdong province) and 10% (in Bengbu in Anhui province) in the 2008 survey. The difference may indicate disparities in housing prices and the general cost of living since home prices may correlate with rents and other costs; thus, a higher homeownership rate indicates cheaper housing and a lower cost of living, resulting in lower consumption levels. On the other hand, it may also reflect the likelihood of owning homes, affected by the affordability of homes and local policies toward migrants and home purchases. In this case, a higher homeownership rate would indicate a greater incentive for migrants to save for home purchases. In either case, the variable should have a negative effect on consumption.
4. RESULTS
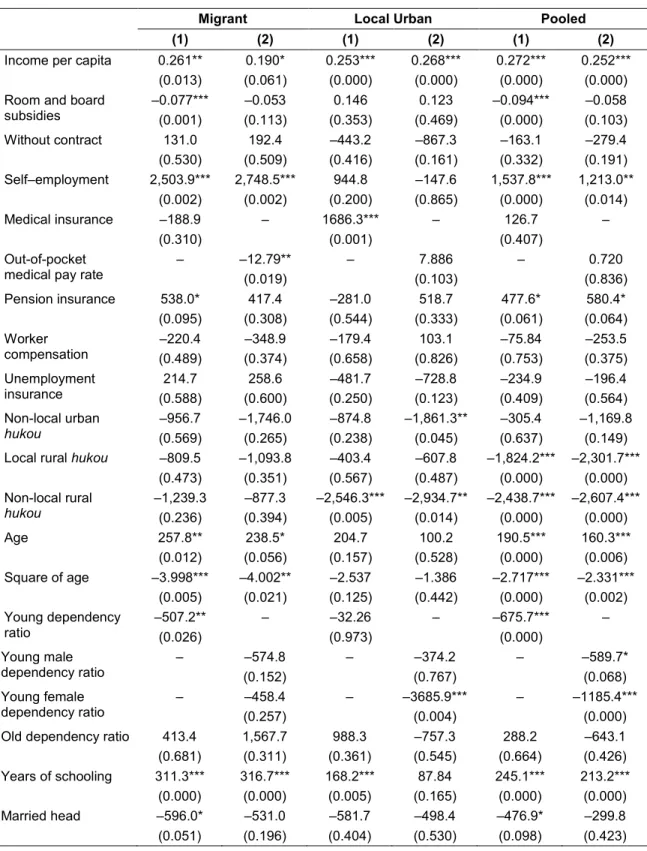
Regressions are run for migrant and local urban households separately and for the pooled data. The variables specific to migrant households are not in the regressions with the pooled or local urban data, including net remittances, migration duration, the homeownership dummy (for which data is applicable but unavailable to local urban households), and local migrant homeownership rate. The results are shown in Table 4. In the second regression for each dataset, the ratio of out-of-pocket medical payment replaces the dummy for medical insurance, and the young male and female dependency ratios replace the young dependency ratio. Because the out-of-pocket medical payment rate data is not available for many households, the numbers of observations for these regressions are much smaller.
Among the variables with implications on disposable income, there is evidence that employer-provided room and board subsidies reduce consumption for migrant households, but the magnitude is far from unity. This is likely due to unaffordability of housing, which results in poor housing conditions for migrant households who do not receive housing subsidies.8 Except in one regression where the p-value is close to the
10% level, the coefficient for net remittances is not significant, and its absolute value is much smaller than the coefficient for income per capita. Such would be the case if households retain part of the remittances as savings. This conjecture is confirmed when the regressions are re-run with income per capita replaced by the remaining unremitted income. The coefficient for net remittances turns positive (0.125 in the first regression) and highly significant with a p-value of 0.000, and as expected, the magnitude of the coefficient is smaller than that for the unremitted income (which is 0.261, the same as for income per capita in the previous regression). The results are not listed in the table since estimations for the rest of the variables are identical.
The dummy for non-local rural hukou reflects the difference in consumption between local urban residents and non-local rural-to-urban migrants that can be attributed to migrants’ precautionary saving and temporary migration, for which the effects are unaccounted for by other explanatory variables. In the regressions for migrant households only, the hukou dummies are not significant, probably caused by the dominating effects of other variables associated with hukou; but they are highly significant and consistent in the regressions with urban households and the pooled sample. Based on the results in the pooled regressions, each non-local, rural-to-urban migrant consumes CNY2,400–CNY2,600 less than local urban residents, all else equal. As noted previously, given that average per capita net remittance is CNY2,200, even if all remittances are used for consumption in their rural homes, the total consumption levels contributed by migrant households’ income would still be lower than those of local urban residents.
Among other variables indicating the need for precautionary saving, there is evidence that adequate medical insurance and pension insurance greatly encourage spending. The medical insurance dummy is not significant for migrant households, most likely because of the inadequacy of the insurance plans, as discussed previously. However, the variable for the out-of-pocket medical payment ratio is significant. If their out-of-pocket payment ratio is reduced from 95% to the level for local urban residents, 53%, their consumption can increase by over CNY500 per person per year.
8 See, for example, Song et al. (2007), for a discussion of urbanizing villages for rural-to-urban migrants.
11
Table 4: Regression Results without Interaction Terms
(dependent variable: annual per capita consumption)
Migrant Local Urban Pooled
(1) (2) (1) (2) (1) (2)
Income per capita 0.261** 0.190* 0.253*** 0.268*** 0.272*** 0.252*** (0.013) (0.061) (0.000) (0.000) (0.000) (0.000) Room and board
subsidies –0.077*** (0.001) (0.113) –0.053 (0.353) 0.146 (0.469) 0.123 –0.094*** (0.000) (0.103) –0.058 Without contract 131.0 192.4 –443.2 –867.3 –163.1 –279.4 (0.530) (0.509) (0.416) (0.161) (0.332) (0.191) Self–employment 2,503.9*** 2,748.5*** 944.8 –147.6 1,537.8*** 1,213.0** (0.002) (0.002) (0.200) (0.865) (0.000) (0.014) Medical insurance –188.9 – 1686.3*** – 126.7 – (0.310) (0.001) (0.407) Out-of-pocket
medical pay rate – –12.79** (0.019) – (0.103) 7.886 – (0.836) 0.720 Pension insurance 538.0* 417.4 –281.0 518.7 477.6* 580.4* (0.095) (0.308) (0.544) (0.333) (0.061) (0.064) Worker compensation (0.489) –220.4 (0.374) –348.9 (0.658) –179.4 (0.826) 103.1 (0.753) –75.84 (0.375) –253.5 Unemployment insurance (0.588) 214.7 (0.600) 258.6 (0.250) –481.7 (0.123) –728.8 (0.409) –234.9 (0.564) –196.4 Non-local urban hukou (0.569) –956.7 –1,746.0 (0.265) (0.238) –874.8 –1,861.3** (0.045) (0.637) –305.4 –1,169.8 (0.149)
Local rural hukou –809.5 –1,093.8 –403.4 –607.8 –1,824.2*** –2,301.7*** (0.473) (0.351) (0.567) (0.487) (0.000) (0.000) Non-local rural hukou –1,239.3 (0.236) (0.394) –877.3 –2,546.3*** –2,934.7** –2,438.7*** –2,607.4*** (0.005) (0.014) (0.000) (0.000) Age 257.8** 238.5* 204.7 100.2 190.5*** 160.3*** (0.012) (0.056) (0.157) (0.528) (0.000) (0.006) Square of age –3.998*** –4.002** –2.537 –1.386 –2.717*** –2.331*** (0.005) (0.021) (0.125) (0.442) (0.000) (0.002) Young dependency ratio –507.2** (0.026) – (0.973) –32.26 – –675.7*** (0.000) – Young male dependency ratio – (0.152) –574.8 – (0.767) –374.2 – –589.7* (0.068) Young female dependency ratio – (0.257) –458.4 – –3685.9*** (0.004) – –1185.4*** (0.000) Old dependency ratio 413.4 1,567.7 988.3 –757.3 288.2 –643.1
(0.681) (0.311) (0.361) (0.545) (0.664) (0.426) Years of schooling 311.3*** 316.7*** 168.2*** 87.84 245.1*** 213.2***
(0.000) (0.000) (0.005) (0.165) (0.000) (0.000) Married head –596.0* –531.0 –581.7 –498.4 –476.9* –299.8 (0.051) (0.196) (0.404) (0.530) (0.098) (0.423)
continued on next page
Table 4 continued
Migrant Local Urban Pooled
(1) (2) (1) (2) (1) (2) Household size –1,044.8*** –1,141.7*** –1,281.6*** –1,019.5*** –690.8*** –650.0*** (0.003) (0.002) (0.000) (0.000) (0.000) (0.001) Rate of migrant homeownership –546.8*** (0.000) –675.3*** (0.000) – – – – Net remittances –0.136 –0.0991 – – – – (0.106) (0.246) Years of migration 53.69*** 90.77*** – – – – (0.004) (0.000) Live in self-owned homes 1,740.7** (0.026) 1,612.1** (0.040) – – – –
Note: p-values are shown in parentheses. ***p < 0.01, **p < 0.05, *p < 0.1.
Source: Author.
Consistent with the previous summary table, being self-employed contributes substantially to consumption for migrant households. However, the dummy for employment without contracts is not significant, probably because the difference between employment with and without contracts is explained by income and benefits. On average, income per worker is almost CNY3,000 less for jobs without contracts than with contracts. Worker compensation insurance and unemployment insurance are also insignificant, possibly because these insurances do not provide much security due to inadequate payment.
Both age and the square of age are significant in the regressions for the pooled and migrant household data. However, the signs of the coefficients indicate that consumption exhibits a pattern opposite to what is suggested by the life cycle theory. Judging by the average of the two regressions for the pooled sample, consumption seems to first increase with age, peaks in the early 30s, then declines. This result coincides with the findings by Chamon and Prasad (2010), who conclude that the saving pattern is U-shaped against age for urban households in the PRC, which can be explained by recent cost increases in housing, education, and healthcare. Higher saving among the elderly may also be due to bequests, as in Yin (2012).
However, the young dependency ratio confirms the applicability of the life cycle theory, especially for migrant households, even though the old dependency ratio is insignificant in all regressions (which is consistent with the estimation for the age variables). In general, migrant households have a higher average young dependency ratio, at 0.3 for all households and 0.8 for those with young dependents, as opposed to 0.2 and 0.3 for local urban households. Note that when the young dependency ratio is split to male and female dependency ratios, the results suggest that urban households save more for girls, contrary to Wei and Zhang (2011).
Estimations for both migration duration and the homeownership dummy are significant. Migrants who own homes in host cities and have lived in cities longer are less likely to view their income as temporary income. As a result, they may consume more. An increase in the duration of migration by 10 years can result in a substantial increase in consumption by CNY500–CNY910 per person. The estimated increase in per capita consumption due to homeownership accounts for at least 7.9% of per capita income (which is about CNY20,500 for the weighted sample).
One may argue that those who spend more are less likely to become homeowners, implying the homeownership dummy is endogenous. However, any bias arising from the endogeneity of homeownership is likely to be limited because of the lack of intention by migrant households to acquire homes. This is a result of their reluctance to stay permanently, the lack of access to home loans, and prohibitively high housing prices. Nevertheless, solutions to the potential endogeneity issue are considered. Unfortunately, no candidate from the survey can serve as a good instrument that is correlated to homeownership while exogenous to consumption, including the provision of housing funds. A housing fund serves as a saving scheme with joint contributions from employers for home purchases. However, an overwhelming proportion of the migrant homeowners (93%) are not subsidized by housing funds.
Cross-province differences in the migrant homeownership rate may offer a clue about how serious the endogeneity bias is. In the 2008 survey, migrant homeownership rates ranged from 1.9% to 8.9%, with Guangdong province at the bottom, Anhui province at the top, and Shanghai in the middle (3.5%). If higher consumption reduces the likelihood of owning homes, the coefficient for homeownership may be biased upward; that is, the true parameter should be smaller. The more likely migrant households are to buy homes, the greater the bias would be. Given the constraints of housing policies and prices, the likelihood for migrants to buy homes is reflected by their local homeownership rate. Thus, it is expected that the upward bias is more severe in provinces with higher homeownership rates, so the estimation of the coefficient should be smaller for provinces with lower homeownership rates, and greater for provinces with higher homeownership rates. A regression is run with the interaction term between homeownership and the province dummies with Shanghai as the base province (which lies in the middle). However, the interaction term is highly insignificant for all provinces but one (Zhejiang), and the estimation of the main effect is similar to the case without the interaction terms. Thus, the endogeneity is not considered to be severe.
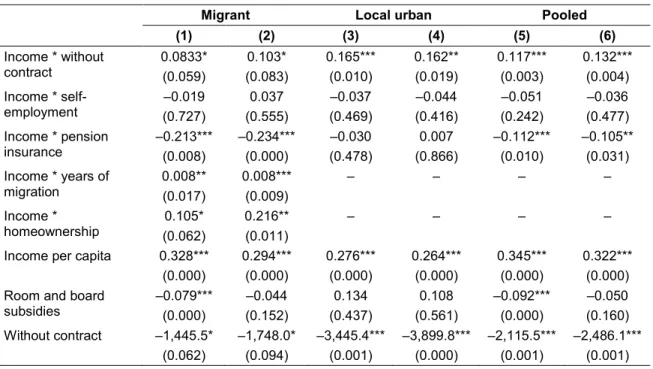
Table 5: Regression Results with Interactions
(dependent variable: per capita annual consumption)
Migrant Local urban Pooled
(1) (2) (3) (4) (5) (6) Income * without contract 0.0833* (0.059) (0.083) 0.103* 0.165*** (0.010) 0.162** (0.019) 0.117*** (0.003) 0.132*** (0.004) Income * self-employment (0.727) –0.019 (0.555) 0.037 (0.469) –0.037 (0.416) –0.044 (0.242) –0.051 (0.477) –0.036 Income * pension insurance –0.213*** (0.008) –0.234*** (0.000) (0.478) –0.030 (0.866) 0.007 –0.112*** (0.010) –0.105** (0.031) Income * years of migration 0.008** (0.017) 0.008*** (0.009) – – – – Income * homeownership (0.062) 0.105* 0.216** (0.011) – – – – Income per capita 0.328*** 0.294*** 0.276*** 0.264*** 0.345*** 0.322***
(0.000) (0.000) (0.000) (0.000) (0.000) (0.000) Room and board
subsidies –0.079*** (0.000) (0.152) –0.044 (0.437) 0.134 (0.561) 0.108 –0.092*** (0.000) (0.160) –0.050 Without contract –1,445.5* –1,748.0* –3,445.4*** –3,899.8*** –2,115.5*** –2,486.1***
(0.062) (0.094) (0.001) (0.000) (0.001) (0.001)
continued on next page
Table 5 continued
Migrant Local urban Pooled
(1) (2) (3) (4) (5) (6) Self-employment 2,149.1** 897.1 1,976.6* 1,130.4 2,528.4*** 1,921.7** (0.045) (0.411) (0.098) (0.410) (0.001) (0.032) Medical insurance –179.6 – 1,571.2*** – 100.3 – (0.299) (0.001) (0.509) Out-of-pocket
medical pay rate – –13.52*** (0.006) – (0.141) 7.118 – (0.956) 0.194 Pension insurance 5,032.5*** 5,241.9*** 428.5 296.8 2,755.9*** 2,735.4*** (0.002) (0.000) (0.618) (0.731) (0.001) (0.003) Worker compensation (0.724) –114.9 (0.957) –21.01 (0.797) –101.8 (0.732) 154.7 (0.848) –46.59 (0.488) –197.4 Unemployment insurance (0.775) –108.0 (0.740) –159.9 (0.341) –386.1 (0.129) –693.6 (0.582) –157.5 (0.727) –122.8 Non-local urban hukou –1,229.6 (0.470) –1,284.8 (0.479) (0.257) –838.2 –1,789.6* (0.059) (0.588) –347.5 –1,121.5 (0.176)
Local rural hukou –943.2 –711.7 –379.7 –693.2 –1,570.4*** –1,998.8*** (0.421) (0.612) (0.592) (0.419) (0.000) (0.000) Non-local rural hukou –1,247.2 –309.2 –2,385.5*** –2,798.8** –2,297.8*** –2,433.4***
(0.250) (0.803) (0.008) (0.019) (0.000) (0.000) Age 202.5*** 152.1 232.1 153.9 166.0*** 135.2** (0.004) (0.105) (0.107) (0.332) (0.000) (0.017) Square of age –3.155*** –2.695** –2.875* –2.038 –2.438*** –2.059*** (0.001) (0.032) (0.081) (0.257) (0.000) (0.005) Young dependency ratio –700.0*** (0.002) – (0.983) 20.42 – –909.4*** (0.000) – Young male dependency ratio – –757.0** (0.046) – (0.768) –372.4 – –714.4** (0.023) Young female dependency ratio – (0.282) –432.1 – –3,600.2*** (0.005) – –1,361.0*** (0.000) Old dependency ratio 645.2 1,371.6 1,240.9 –361.6 83.32 –852.6
(0.472) (0.222) (0.248) (0.776) (0.898) (0.299) Years of schooling 274.4*** 250.0*** 164.5*** 82.67 235.2*** 201.4*** (0.000) (0.000) (0.005) (0.194) (0.000) (0.000) Married head –622.9** –621.0 –396.5 –335.8 –369.7 –241.8 (0.044) (0.125) (0.551) (0.653) (0.219) (0.531) Household size –683.4*** –584.2*** –1,314.5*** –1,028.1*** –638.1*** –571.1*** (0.000) (0.001) (0.000) (0.000) (0.000) (0.000) Rate of migrant homeownership –481.6*** (0.000) –520.4*** (0.000) – – – – Net remittances –0.213*** –0.216*** – – – – (0.000) (0.000) Years of migration –103.9* –81.56 – – – – (0.079) (0.166) Live in self-owned homes (0.438) –759.7 –2,792.3* (0.084) – – – –
Note: p-values are shown in parentheses. ***p < 0.01, **p < 0.05, *p < 0.1.
Source: Author.
The results in Table 4 can be further verified using regressions with interaction terms between household head characteristics and income per capita. Table 5 presents the results with all significant interaction terms for migrant households, and the results for the same regressions for local urban households and the pooled data.
The main effect for employment without contracts is now negative and significant when the interaction with income is included, which is also significant but with positive signs, suggesting its depressing effect on consumption is more severe for lower income households. Similarly, the negative coefficient for the interaction term with pension insurance also means that lower income households value it more than higher income households when deciding how much to consume. The interaction terms for both years of migration and homeownership are positive, which means that marginal propensity to consume is also higher for those who have stayed in the city longer or live in self-owned homes.
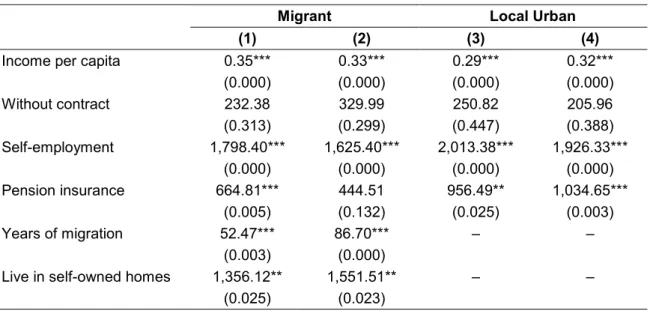
The average marginal effects of the variables involved in the interaction terms for local and urban migrant households are summarized in Table 6, and the heterogeneity in the marginal propensity to consume depending on three attributes of the household heads are presented in Table 7. The marginal propensity to consume for homeowners, the self-employed, and those who have been in the cities longer is clearly higher. Even though the average marginal propensity to consume is higher for migrant households than for local urban households, this positive factor is more than offset by their lower income, inadequate medical and pension insurance, short durations of migration, and absence of homeownership. The acceleration of consumption with income for migrant households with longer durations of migration implies that given time, migrant households’ consumption may catch up with the local urban level. This result echoes the findings based on household data in Nepal by Acharya and Leon-Gonzalez (2015).
Table 6: Average Marginal Effects of the Variables in the Interaction Terms Migrant Local Urban
(1) (2) (3) (4)
Income per capita 0.35*** 0.33*** 0.29*** 0.32***
(0.000) (0.000) (0.000) (0.000) Without contract 232.38 329.99 250.82 205.96 (0.313) (0.299) (0.447) (0.388) Self-employment 1,798.40*** 1,625.40*** 2,013.38*** 1,926.33*** (0.000) (0.000) (0.000) (0.000) Pension insurance 664.81*** 444.51 956.49** 1,034.65*** (0.005) (0.132) (0.025) (0.003) Years of migration 52.47*** 86.70*** – – (0.003) (0.000)
Live in self-owned homes 1,356.12** 1,551.51** – –
(0.025) (0.023)
Note: p-values are shown in parentheses. ***p < 0.01, **p < 0.05, *p < 0.1.
Source: Author.
Table 7: Marginal Propensity to Consume by Household Head Characteristics
All
households Homeowner homeowner Non- employed Self- employed
Non-self-All households 0.334 0.534 0.329 0.412 0.323
Duration of urban residence
29 months 0.292 0.451 0.289 0.344 0.285 70 months 0.322 0.481 0.318 0.373 0.315 135 months 0.363 0.522 0.360 0.415 0.356
Source: Author.
The square of age continues to have a negative coefficient in almost all regressions, and the old dependency ratio remains insignificant, further confirming that the factors outlined by the life cycle theory do not strongly affect household consumption, except for the young dependency ratio. The young male dependency ratio for migrant households is now negative, a sign that competitive saving for sons is more detectable for migrants, whereas local urban parents may worry more about weddings, which are typically paid by brides’ parents in the PRC.
Among the control variables, the coefficient for years of schooling is almost always positive and significant with a large magnitude. Thus, the lower education level is not only a cause for migrants’ lower income and less favorable employment conditions, and indirectly contributes to their lower consumption, but also has a direct adverse effect on their spending.
The migrant local homeownership rate is consistently negative and significant, as expected. However, it is unclear whether it mainly captures the cost of living effect or the likelihood for migrants to own homes and thus the incentive to save for purchasing them. If it mainly reflects the likelihood for migrants to own homes, the variable should have a lesser or no effect on those who already own homes, since the incentive to save to buy another home should be weaker (hence the U-shaped saving pattern for urban households in Chamon and Prasad [2010]). To shed some light on this issue, a regression is run with migrant homeowners only. Although the regression is only for 159 observations, the coefficient for the homeownership rate is highly significant with a p-value of 0.002, but negative and with a greater magnitude (–1,394), refuting the hypothesis that it reflects mainly the likelihood of owning homes. Combined with their general low income levels and reluctance to stay in urban areas in the long run, it can be deduced that the homeownership rate mainly captures the location effect and cost of living differences, and the offsetting effect on consumption of the saving motive for home purchases cannot be observed through this variable.
5. CONCLUSION
This paper studies the consumption patterns of migrant households in the PRC using data from the CHIP 2007 and 2008 urban and migrant household surveys, and seeks to explain what factors contribute to the consumption gap between local urban and migrant households. While the life cycle theory does not provide a good explanation except for the young dependency ratio, the lower consumption for migrant households is well explained by factors attributed to their greater need for precautionary saving and their tendency to view their urban income as temporary income, caused by their financial insecurity and the temporary nature of migration. As argued, both channels originate from migrant households’ non-local hukou. Specific factors contributing to
their financial insecurity mainly include no or inadequate medical and pension insurance. The short-term nature of migration is reflected by the short durations of migration (which represent the durations of urban residence) and the lack of homeownership in host cities. The above two sets of factors are not separate from each other; they are intertwined and reinforce each other. The paper also finds that marginal propensity to consume exhibits heterogeneity. Specifically, it increases with a longer duration of migration, homeownership, and self-employment. However, most migrant households’ marginal propensity to consume is depressed for lacking these characteristics.
Removing the hukou system will have the largest impact on migrant households’ consumption as well as in other aspects of their lives, but it can also have implications for many areas in the host cities, such as the capacity of schools, medical care, transportation, and urban poverty; thus the current gradualism approach taken by some cities. As shown in the paper, the granting of certain benefits associated with local urban hukou, such as providing and improving pension and medical insurance for migrant workers, can also produce sizable effects on consumption, especially for lower income households. From a policy point of view, this may be the easiest approach to increase their consumption.
Host cities can also do more to encourage migrant homeownership by providing affordable and quality housing to migrant households, thereby directly lifting their spending on durable goods and indirectly encouraging consumption by inducing migrants to stay permanently. However, such policies may be ineffective if they induce households to save excessively for home purchases. Policies to reduce the transience of migration may also include accommodating those with school-aged children and providing them with easy access to local public schools, an issue widely covered by the media. Such policies will encourage migrants to form a better sense of belonging to the local city and will also improve their general wellbeing.
A large discrepancy in consumption exists between self-employed households and the non-self-employed. Given the difficulties for migrant households to find employment with adequate income, policies promoting entrepreneurship for migrant workers will be particularly beneficial and will help raise their income level, reduce local income inequality, and boost demand.
REFERENCES
Acharya, C. P., and R. Leon-Gonzalez. 2015. The Assimilation of Migrant Households in the Urban Areas of a Developing Country. Journal of Developing Areas 49(2): 335–54.
Akgüç, M., C. Giulietti, and K. F. Zimmermann. 2013. The RUMiC Longitudinal Survey: Fostering Research on Labor Markets in China. IZA Discussion Paper No. 7860. Ang, J. 2009. Household Saving Behaviour in an Extended Life Cycle Model:
A Comparative Study of China and India. Journal of Development Studies 45(8): 1344–1359.
Chamon, M. D., and E. S. Prasad. 2010. Why Are Saving Rates of Urban Households in China Rising? American Economic Journal: Macroeconomics 2(1): 93–130. Chen, B., M. Lu, and N. Zhong. 2015. How Urban Segregation Distorts Chinese
Migrants’ Consumption? World Development 70 (June): 133–146.
Chen, X. 2017. Half Realized Dreams: Consumption of Domestic Sojourners in Urban China. In Urbanization and Party Survival in China: People vs. Power, edited by Xiaobing Li and Xiansheng Tian, 47–61. Lanham, Maryland: Lexington Books. Cheung, D., and Y. Padieu. 2015. Heterogeneity of the Effects of Health Insurance
on Household Savings: Evidence from Rural China. World Development 66 (February): 84–103.
Danzer, A. M., B. Dietz, K. Gatskova, and A. Schmillen. 2014. Showing Off to the New Neighbors? Income, Socioeconomic Status and Consumption Patterns of Internal Migrants. Journal of Comparative Economics 42(1): 230–245. Dreger, C., T. Wang, and Y. Zhang. 2015. Understanding Chinese Consumption:
The Impact of Hukou. Development and Change 46(6): 1331–1344.
Dreher, A. 2006. Does Globalization Affect Growth? Evidence from a New Index of Globalization. Applied Economics 38(10): 1091–1110.
Dreher, A., N. Gaston, and P. Martens. 2008. Measuring Globalisation – Gauging Its Consequences. New York: Springer.
Dustmann, C. 2003. Temporary Migration, Consumption and Labour Supply. In Studies in Labour Markets and Industrial Relations, edited by M. Baldassarri and B. Chiarini, 231–50. Houndmills, Basingstoke, Hampshire; New York: Palgrave Macmillan.
Dustmann, C., and J.-S. Görlach. 2015. The Economics of Temporary Migrations. Centre for Research & Analysis of Migration Discussion Paper Series. London: University College London.
Fang, Z., and C. Sakellariou. 2016. Living Standards Inequality between Migrants and Local Residents in Urban China - a Quantile Decomposition. Contemporary
Economic Policy 34(2): 369–386.
Frijters, P., T. Kong, and X. Meng. 2011. Migrant Entrepreneurs and Credit Constraints under Labour Market Discrimination. IZA DP No. 5967.
Frijters, P., X. Meng, and B. Resosudarmo. 2011. The Effects of Institutions on Migrant Wages in China and Indonesia. In Rising China: Global Challenges and
Opportunities, edited by J. Golley and L. Song, 245–283. Canberra, Australia: Australian National University Press.
Giulietti, C., G. Ning, and K. F. Zimmermann. 2012. Self-Employment of Rural-to-Urban Migrants in China. International Journal of Manpower 33(1): 96–117.
Kim, J.-O., S. Forsythe, Q. Gu, and S. J. Moon. 2002. Cross-Cultural Consumer Values, Needs and Purchase Behavior. Journal of Consumer Marketing 19(6): 481–502. Kong, S. T. 2010. Rural-Urban Migration in China: Survey Design and Implementation.
In The Great Migration: Rural-Urban Migration in China and Indonesia, edited by X. Meng and C. Manning, with L. Shi and T. N. Effendi, 135–150.
Cheltenham, UK; Northampton, MA: Edward Elgar.
Luo, C., S. Li, T. Sicular, Q. Deng, and X. Yue. 2013. The 2007 Household Surveys: Sampling Methods and Data Description. In Rising Inequality in China:
Challenges to a Harmonious Society, edited by S. Li, H. Sato, and T. Sicular, 445–464. Cambridge and New York: Cambridge University Press.
Michael, R. T. 1975. Education and Consumption. In Education, Income, and Human Behavior, edited by F. T. Juster, 233–252. New York: McGraw-Hill.
Quercia, R. G., and Y. Song. 2007. Housing Rural Migrants in Urban China: Lessons from the United States. In Urbanization in China: Critical Issues in an Era of
Rapid Growth, edited by Y. Song and C. Ding, 191–207. Cambridge, MA: Lincoln Institute of Land Policy.
Song, J., T. Sicular, and X. Yue. 2013. The 2002 and 2007 CHIP Surveys: Sampling, Weights, and Combining the Urban, Rural, and Migrant Samples. In Rising
Inequality in China: Challenges to a Harmonious Society, edited by S. Li, H. Sato, and T. Sicular, 465–486. Cambridge and New York: Cambridge University Press.
Song, Y., Y. Zenou, and C. Ding. 2007. The Role China’s Urbanizing Villages in Housing Rural Migrants. In Urbanization in China: Critical Issues in an Era of
Rapid Growth, edited by Y. Song and C. Ding, 145–168. Cambridge, MA: Lincoln Institute of Land Policy.
Wang, M., and C. Fang. 2015. Destination Consumption. In China’s Domestic
Transformation in a Global Context, 91–110. Acton, Australia: Australian National University Press. http://www.jstor.org/stable/j.ctt16wd0dw.10. Wang, X., and Y. Wen. 2012. Housing Prices and the High Chinese Saving Rate
Puzzle. China Economic Review 23(2): 265–283.
Wei, S.-J., and X. Zhang. 2011. The Competitive Saving Motive: Evidence from Rising Sex Ratios and Savings Rates in China. Journal of Political Economy 119(3): 511–564.
Yin, T. 2012. The ‘Will’ to Save in China: The Impact of Bequest Motives on the Saving Behavior of Older Households. Japanese Economy 39(3): 99–135.
Zhang, J., and Z. Zhao. 2011. Social-Family Network and Self-Employment: Evidence from Temporary Rural-Urban Migrants in China. IZA Discussion Paper No. 5466. Zhou, W. 2014. Brothers, Household Financial Markets and Savings Rate in China.
Journal of Development Economics 111 (November): 34–47.